. 2020 Jan;39(2):368-384.
doi: 10.1038/s41388-019-0993-1. Epub 2019 Sep 2.

β3-adrenoreceptor blockade reduces tumor growth and increases neuronal differentiation in neuroblastoma via SK2/S1P2 modulation

Affiliations

β3-adrenoreceptor blockade reduces tumor growth and increases neuronal differentiation in neuroblastoma via SK2/S1P2 modulation

Gennaro Bruno et al. Oncogene. 2020 Jan.

Abstract

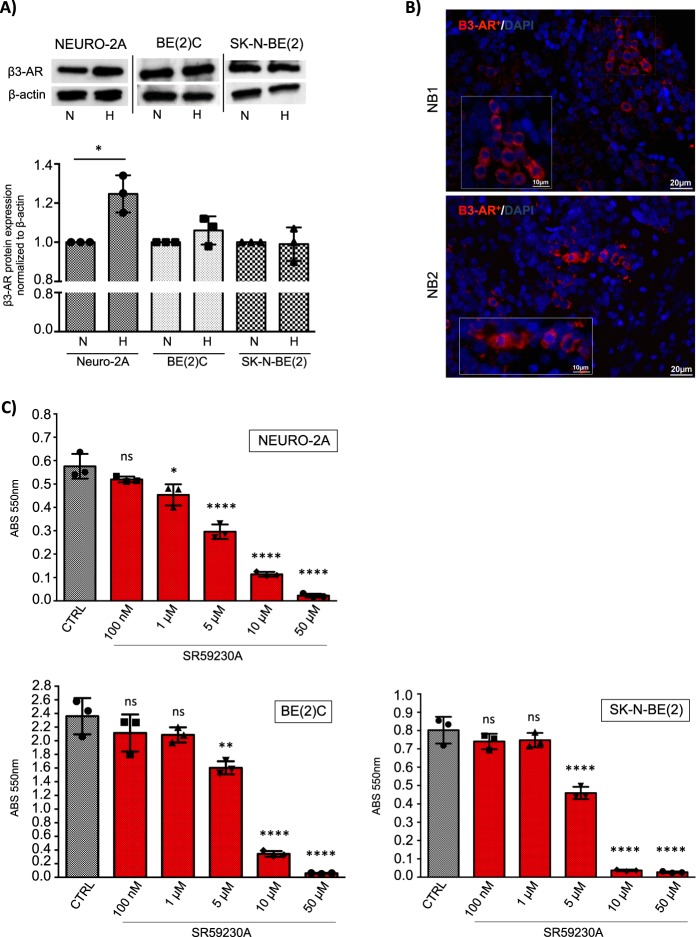
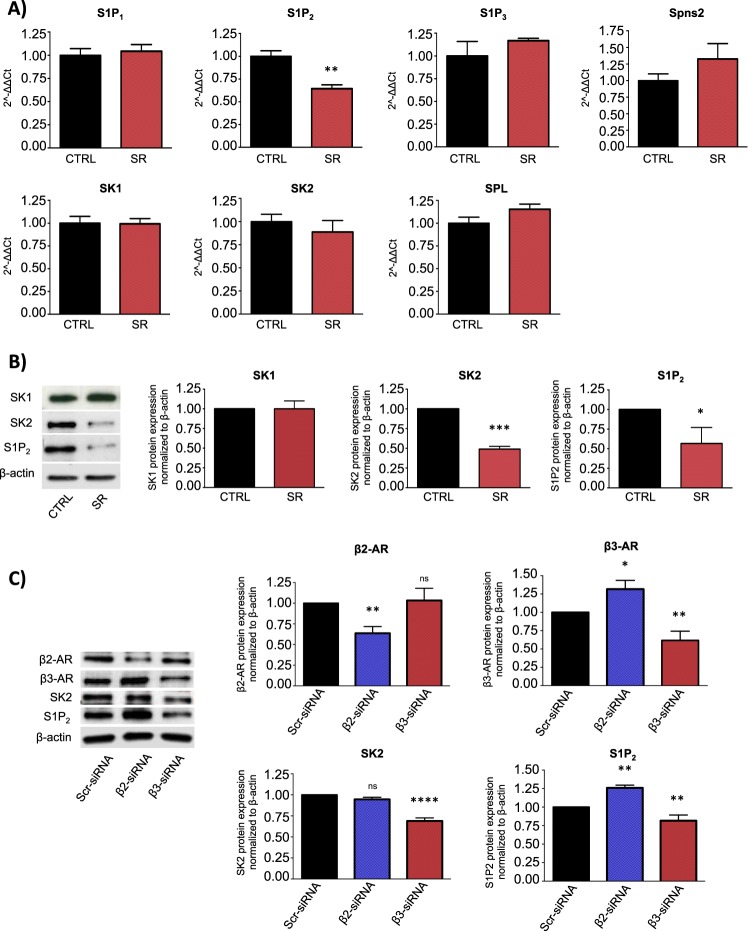
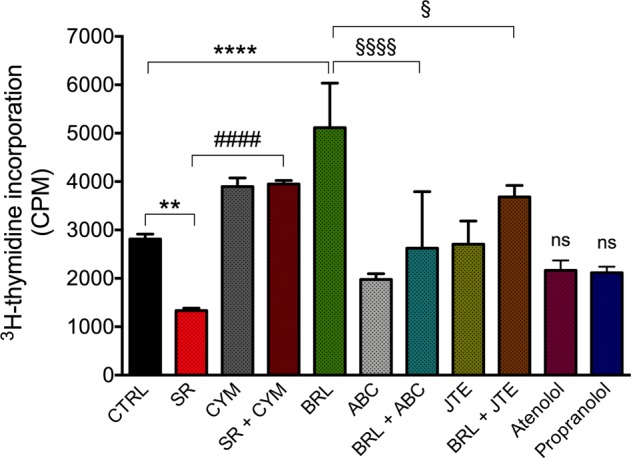
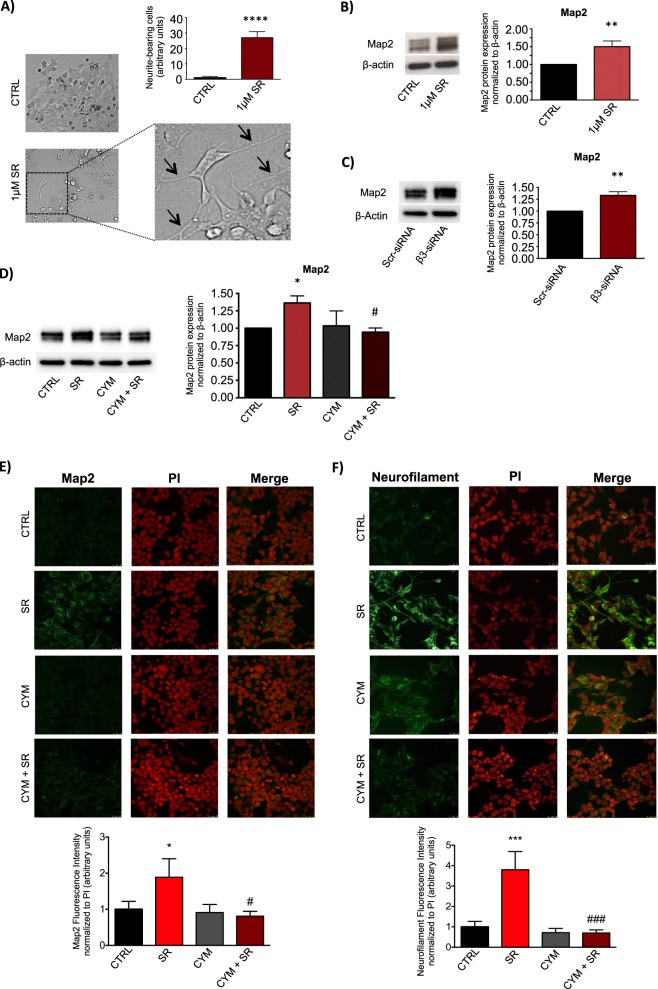
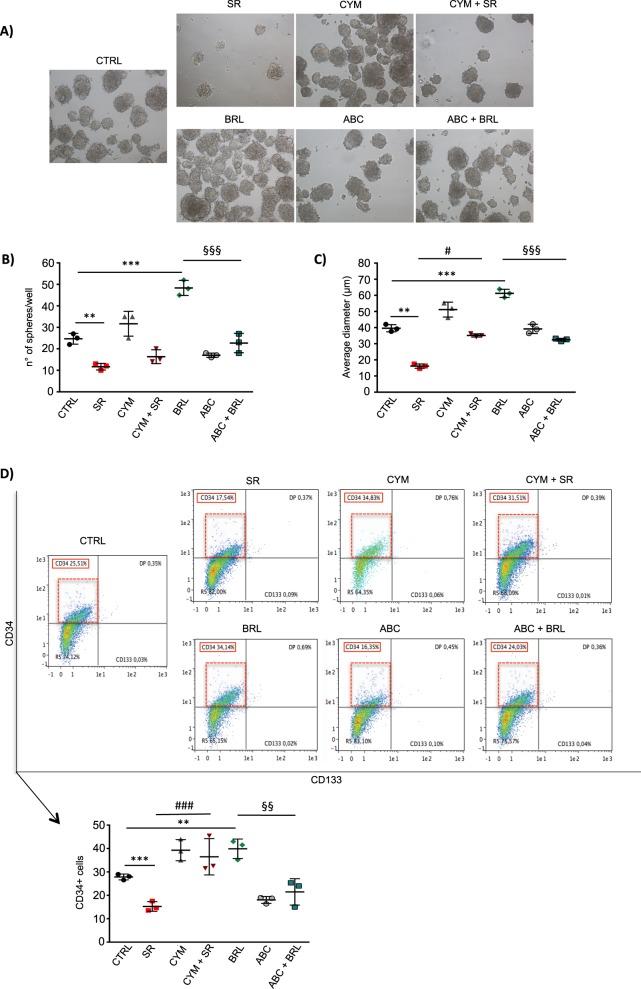
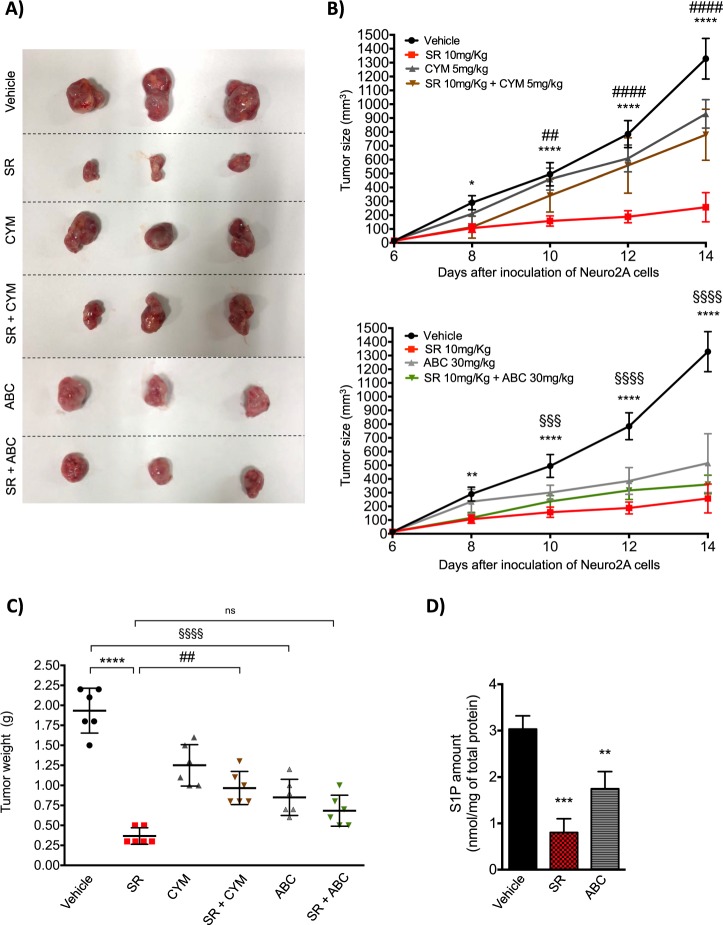
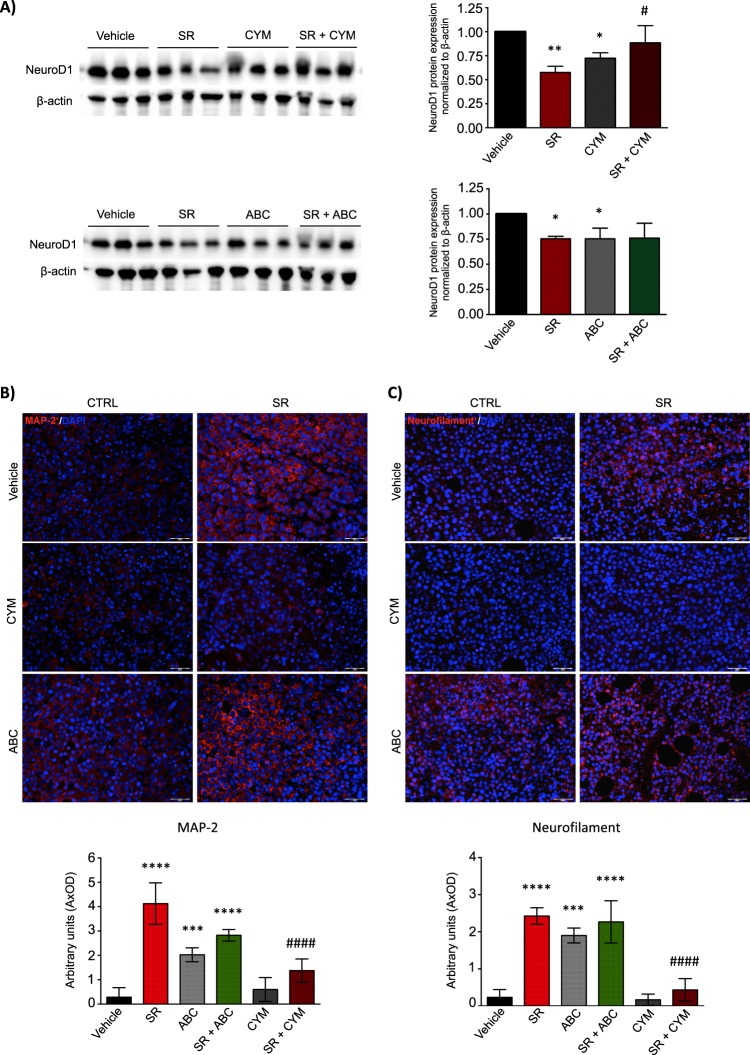
Neuroblastoma (NB) is the most frequently observed among extracranial pediatric solid tumors. It displays an extreme clinical heterogeneity, in particular for the presentation at diagnosis and response to treatment, often depending on cancer cell differentiation/stemness. The frequent presence of elevated hematic and urinary levels of catecholamines in patients affected by NB suggests that the dissection of adrenergic system is crucial for a better understanding of this cancer. β3-adrenoreceptor (β3-AR) is the last identified member of adrenergic receptors, involved in different tumor conditions, such as melanoma. Multiple studies have shown that the dysregulation of the bioactive lipid sphingosine 1-phosphate (S1P) metabolism and signaling is involved in many pathological diseases including cancer. However, whether S1P is crucial for NB progression and aggressiveness is still under investigation. Here we provide experimental evidence that β3-AR is expressed in NB, both human specimens and cell lines, where it is critically involved in the activation of proliferation and the regulation between stemness/differentiation, via its functional cross-talk with sphingosine kinase 2 (SK2)/S1P receptor 2 (S1P2) axis. The specific antagonism of β3-AR by SR59230A inhibits NB growth and tumor progression, by switching from stemness to cell differentiation both in vivo and in vitro through the specific blockade of SK2/S1P2 signaling.


Conflict of interest statement

The authors declare that they have no conflict of interest.

Figures

Fig. 1
Fig. 1
β3-AR is constitutively expressed in murine and human neuroblastoma cells and it is involved in cell survival. a WB and relative densitometric quantification analysis, showing expression of β3-AR protein in murine (Neuro-2A) and human (BE(2)C, SK-N-BE(2)) NB cell lines in normoxic (N) and hypoxic condition (H). Results were normalized to the expression of β-actin and reported as mean ± SD, fold change over controls (normoxic condition), set as 1. Blots are representative of three independent experiments. Significance was calculated by Unpaired t-test analysis with equal SD (*P < 0.05). b Immunofluorescence staining of β3-AR on tumor sections of two NBs (NB1, NB2) derived from human patients, showing numerous β3-AR positive cells. Images are representative of similar results obtained for n = 6. c MTT survival assay in Neuro-2A, BE(2)C and SK-N-BE(2) NB cell lines, treated with different concentration of SR59230A for 24 h. Results are reported as mean ± SD of three independent experiments performed in triplicate. Significance was calculated by one-way ANOVA analysis followed by Bonferroni’s post hoc test (ns = not significant, *P < 0.05, **P < 0.01, ****P < 0.0001)
Fig. 2
Fig. 2
β3-AR blockade modulates S1P signaling in human neuroblastoma BE(2)C cells. a RT-PCR of human NB BE(2)C cell line treated with 1 μM SR59230A for 24 h. Change of mRNA expression levels of receptors (S1P1, S1P2, S1P3), metabolic enzymes (SK1, SK2, SPL) and transporter (Spns2) of S1P are reported as mean ± SD of three independent experiments performed in triplicate, using the 2^(-ΔΔCt) method as described in Methods section. Data were normalized to β-actin RNA expression and values of treated samples reported as fold change over control, set as 1. Significance was calculated by Unpaired t-test analysis with equal SD (**P < 0.01). b WB and relative densitometric quantification analysis, showing protein expression levels of SK1, SK2, and S1P2 in NB BE(2)C cell line after 24 h of 1 μM SR59230A treatment. Results were normalized to the expression of β-actin and reported as mean ± SD, fold change over control, set as 1. Blots are representative of three independent experiments. Significance was calculated by Unpaired t-test analysis with equal SD (*P < 0.05, ***P < 0.001). c WB and relative densitometric quantification analysis, showing protein expression levels of β2-AR, β3-AR, SK2 and S1P2 in NB BE(2)C cell line after molecular silencing of β2- and β3-AR. Results were normalized to the expression of β-actin and reported as mean ± SD, fold change over control, set as 1. Blots are representative of three independent experiments. Significance was calculated by one-way ANOVA analysis followed by Bonferroni’s post hoc test (ns = not significant, *P < 0.05, **P < 0.01, ****P < 0.0001)
Fig. 3
Fig. 3
β3-AR regulates proliferation rate of human neuroblastoma BE(2)C cells through the involvement of SK2/S1P2 signaling. 3H-thymidine Proliferation Assay (1 μCi/well) of BE(2)C cell line treated with 1 μM SR59230A in presence or not of 10 μM CYM5520, 1 μM BRL37344 in presence or not of 1 μM ABC294640 and 1 μM JTE013, 1 μM Atenolol and 1 μM Propranolol for 24 h. Results are reported as mean ± SD of three independent experiments. Significance was calculated by one-way ANOVA analysis followed by Bonferroni’s post hoc test (**P < 0.01 SR vs. CTRL, ****P < 0.0001 BRL vs. CTRL; ####P < 0.0001 SR+CYM vs. SR; §P < 0.05 BRL+JTE vs. BRL; §§§§P < 0.0001 BRL+ABC vs. BRL)
Fig. 4
Fig. 4
β3-AR blockade increases neuronal differentiation of human neuroblastoma BE(2)C cells through the involvement of SK2/S1P2 signaling. a Images showing neurite outgrowth (black arrows) and relative quantification in SR59230A and control condition after 72 h of treatment of BE(2)C cells. To quantify neurite outgrowth, images were acquired from six randomly chosen fields in each well in triplicate for condition, and neurite-bearing cells were counted. Results are reported as mean ± SD of three independent experiments. Significance was calculated by Unpaired t-test analysis with equal SD (****P < 0.0001). b WB and relative densitometric quantification analysis, showing protein levels of the differentiation marker Map2 in BE(2)C cell line treated with 1 μM SR59230A for 48 h. Results were normalized to the expression of β-actin and reported as mean ± SD, fold change over control, set as 1. Blot is representative of three independent experiments. Significance was calculated by Unpaired t-test analysis with equal SD (**P < 0.01). c WB and relative densitometric quantification analysis, showing protein levels of Map2 in BE(2)C cell line transfected with Scrambled (Scr)- and β3-AR-siRNA for 48 h. Results were normalized to the expression of β-actin and reported as mean ± SD, fold change over control, set as 1. Blot is representative of three independent experiments. Significance was calculated by Unpaired t-test analysis with equal SD (**P < 0.01). d WB and relative densitometric quantification analysis, showing protein levels of the differentiation marker Map2 in BE(2)C cell line treated with 1 μM SR59230A for 48 h, in presence or not of 10 μM CYM5520. Results were normalized to the expression of β-actin and reported as mean ± SD, fold change over control, set as 1. Blot is representative of three independent experiments. Significance was calculated by two-way ANOVA analysis followed by Bonferroni’s post hoc test (*P < 0.05; #P < 0.05 CYM+SR vs. SR). e Upper panel: Immunofluorescence images of BE(2)C cells treated with 1 μM SR59230A for 48 h, in presence or not of 10 μM CYM5520 and stained with anti-Map2 antibody, Alexa-fluor488 secondary antibodies and propidium iodide (PI). Images are representative of three independent experiments with similar results. Scale bar 25 µm. Lower panel: Quantification of Map2-associated fluorescence intensity normalized to PI, fold change above control set as 1. Data are mean ± SD of six fields of each specimen quantified in three independent experiments. SR59230A increases Map2 in a statistically significant manner by one-way ANOVA (*P < 0.05); the pharmacological activation of S1P2 by CYM5520 abolishes SR59230A-induced increase of Map2 in a statistically significant manner by two-way ANOVA followed by Bonferroni's post hoc test #P < 0.05. f Upper panel: Immunofluorescence images of BE(2)C cells treated with 1 μM SR59230A for 72 h, in presence or not of 10 μM CYM5520 and stained with anti-Neurofilament antibody, Alexa-fluor488 secondary antibodies and PI. Images are representative of three independent experiments with similar results. Scale bar 25 µm. Lower panel: Quantification of Neurofilament-associated fluorescence intensity normalized to PI, fold change above control set as 1. Data are reported as mean ± SD as described above in section e. SR59230A increases Neurofilament in a statistically significant manner by one-way ANOVA (***P < 0.001); the pharmacological activation of S1P2 by CYM5520 abolishes SR59230A-induced increase of Neurofilament in a statistically significant way by two-way ANOVA followed by Bonferroni's post hoc test (###P < 0.001)
Fig. 5
Fig. 5
β3-AR blockade reduces stemness in human neuroblastoma BE(2)C cells by modulating the SK2/S1P2 signaling axis. Neurospheres formation assay of human neuroblastoma BE(2)C cell line. Cells were plated in MW24 (1 × 104 cells/well) with Neurosphere basic medium (see “Methods” section) and after 24 h treated with 1 μM SR59230A or 1 μM BRL37344, in presence or not of 10 μM CYM5520 or 1 μM ABC294640. Once formed, spheres were disrupted and cells re-plated for a second passage (P2). a Images were taken after 7 days of neurosphere formation (P2). The effect of the treatments on stemness features of BE(2)C neurospheres, was evaluated by using different assays. b Number of neurospheres formed per well was counted using an optical microscope and compared to the control condition. Results are reported as mean ± SD and are representative of three independent experiments. Significance was calculated by Unpaired t-test analysis with equal SD (**P < 0.01, ***P < 0.001) and two-way ANOVA analysis followed by Bonferroni’s post hoc test (§§§P < 0.001 ABC+BRL vs. BRL). c Average diameter of the spheres was quantified by using the ImageJ Software. Results are reported as mean ± SD and are representative of three independent experiments. Significance was calculated by Unpaired t-test analysis with equal SD (**P < 0.01, ***P < 0.001) and two-way ANOVA analysis followed by Bonferroni’s post hoc test (#P < 0.05 CYM+SR vs. SR; §§§P < 0.001 ABC+BRL vs. BRL). d Flow cytometry analysis of neurospheres was performed by using MACSQuant Analyzer 10 (Miltenyi Biotech). After disruption of the spheres, cells were stained with anti-CD34-PE-Vio770, anti-CD133-APC antibodies and Viobility Fixable dyes. Results were reported as mean ± SD of CD34 positive cells and are representative of three independent experiments. Significance was calculated by Unpaired t-test analysis with equal SD (**P < 0.01, ***P < 0.001) and two-way ANOVA analysis followed by Bonferroni’s post hoc test (###P < 0.001 CYM+SR vs. SR; §§P < 0.01 ABC+BRL vs. BRL)
Fig. 6
Fig. 6
β3-AR blockade reduces tumor growth in A/J mice through the involvement of SK2/S1P2 signaling axis. Neuro-2A cells were injected subcutaneously (1 × 106 cells) in the flank of A/J female mice. When a palpable tumor mass was formed (6 days), mice were treated with Vehicle (i.p.), SR59230A 10 mg/kg (i.p.) alone or in combination with CYM5520 5 mg/kg (i.p.) and ABC294640 30 mg/kg (p.o.). a After 8 days of treatment, mice were sacrificed and tumor mass excised; images of tumors are representative of the final size of all tumors respectively for each treatment (n = 6 for group). b Tumor growth rate obtained by measuring tumor size of the mass calculated as Volume = [(length × widht)2/2] in Vehicle (n = 6), SR59230A (n = 6), CYM5520 (n = 6) and SR59230A+CYM5520 (n = 6) (top) and Vehicle (n = 6), SR59230A (n = 6), ABC294640 (n = 6) and SR59230A+ABC294640 (n = 6) (bottom). Vehicle and SR tumor size results reported in (top) and (bottom) graphs are referred to the same tumors. Significance was calculated by two-way ANOVA analysis followed by Bonferroni’s post hoc test (*P < 0.05, **P < 0.01, ****P < 0.0001; ##P < 0.01 SR+CYM vs. SR, ####P < 0.0001 SR+CYM vs. SR; §§§P < 0.001, §§§§P < 0.0001 Vehicle vs. ABC). c Tumor weight at the end point of the experiment (14 days) (n = 6 per group). Results are reported as individual dots with mean (central line) ±SD. Significance was calculated by two-way ANOVA analysis followed by Bonferroni’s post hoc test (****P < 0.0001; ##P < 0.01 SR+CYM vs. SR; §§§§P < 0.0001 ABC vs. Vehicle). d S1P measurement in tumors of Vehicle- (n = 3), SR59230A- (n = 3) and ABC294640-treated mice (n = 3). Results are reported as mean ± SD. Significance was calculated by one-way ANOVA analysis followed by Bonferroni’s post hoc test (**P < 0.01, ***P < 0.001)
Fig. 7
Fig. 7
Neuroblastoma tumor growth reduction exerted by SR59230A via SK2/S1P2 signaling axis is accompanied with an increased neuronal differentiation of NB cells. a WB and relative densitometric quantification analysis, showing the protein expression levels of the early differentiation marker NeuroD1. Lysates were obtained from tumor mass (at 14 days) of Vehicle-, SR59230A-, CYM5520- and SR59230A+CYM5520-treated mice (n = 3 for each group) (top) and Vehicle-, SR59230A-, ABC294640- and SR59230A+ABC294640-treated mice (n = 3 for each group) (bottom). Significance was calculated by two-way ANOVA analysis followed by Bonferroni’s post hoc test (*P < 0.05, **P < 0.01; #P < 0.05 SR+CYM vs. SR). b Upper panel: Immunofluorescence of paraffin-embedded tumor sections showing expression of the neuronal differentiation marker Map2. Images are representative of similar results obtained for Vehicle- (n = 5), SR59230A- (n = 5), CYM5520- (n = 5), SR59230A+CYM5520- (n = 5), ABC294640- (n = 5) and SR59230A+ABC294640-treated mice (n = 5). Lower panel: Quantification of Map2-associated fluorescence intensity. Data are mean ± SD of eight fields of each specimen quantified in three independent experiments. Significance was calculated by one-way ANOVA analysis followed by Bonferroni’s post hoc test (****P < 0.0001 SR vs. Vehicle, ***P < 0.0001 ABC vs. Vehicle, ****P < 0.0001 SR+ABC vs. Vehicle; ####P < 0.0001 SR+CYM vs. SR. c Upper panel: Immunofluorescence of paraffin-embedded tumor sections showing expression of the neuronal differentiation marker Neurofilament. Images are representative of similar results obtained for Vehicle- (n = 5), SR59230A- (n = 5), CYM5520- (n = 5), SR59230A+CYM5520- (n = 5), ABC294640- (n = 5) and SR59230A+ABC294640-treated mice (n = 5). Lower panel: Quantification of Neurofilament-associated fluorescence intensity. Data are mean ± SD of eight fields of each specimen quantified in three independent experiments. Significance was calculated by one-way ANOVA analysis followed by Bonferroni’s post hoc test (****P < 0.0001 SR vs. Vehicle, ***P < 0.0001 ABC vs. Vehicle, ****P < 0.0001 SR+ABC vs. Vehicle; ####P < 0.0001 SR+CYM vs. SR

References

    1. Maris JM, Hogarty MD, Bagatell R, Cohn SL. Neuroblastoma. Lancet. 2007;369:2106–20. - PubMed
    1. Brodeur GM. Neuroblastoma: biological insights into a clinical enigma. Nat Rev Cancer. 2003;3:203–16. - PubMed
    1. Cohn SL, Pearson ADJ, London WB, Monclair T, Ambros PF, Brodeur GM, et al. The International Neuroblastoma Risk Group (INRG) Classification System: An INRG Task Force Report. J Clin Oncol. 2009;27:289–97. - PMC - PubMed
    1. London WB, Bagatell R, Weigel BJ, Fox E, Guo D, Van Ryn C, et al. Historical time-to-progression (TTP) and progression-free survival (PFS) in relapsed/refractory neuroblastoma modern-era (2002-14) patients from Children’s Oncology Group (COG) early-phase trials. Cancer. 2017;123:4914–23. - PMC - PubMed
    1. Garaventa A, Parodi S, De Bernardi B, Dau D, Manzitti C, Conte M, et al. Outcome of children with neuroblastoma after progression or relapse. A retrospective study of the Italian neuroblastoma registry. Eur J Cancer. 2009;45:2835–42. - PubMed

Publication types

MeSH terms

Substances