. 2019 Dec;4(12):2064-2073.
doi: 10.1038/s41564-019-0540-4. Epub 2019 Sep 2.

Intestinal serotonin and fluoxetine exposure modulate bacterial colonization in the gut

Affiliations

Intestinal serotonin and fluoxetine exposure modulate bacterial colonization in the gut

Thomas C Fung et al. Nat Microbiol. 2019 Dec.

Abstract

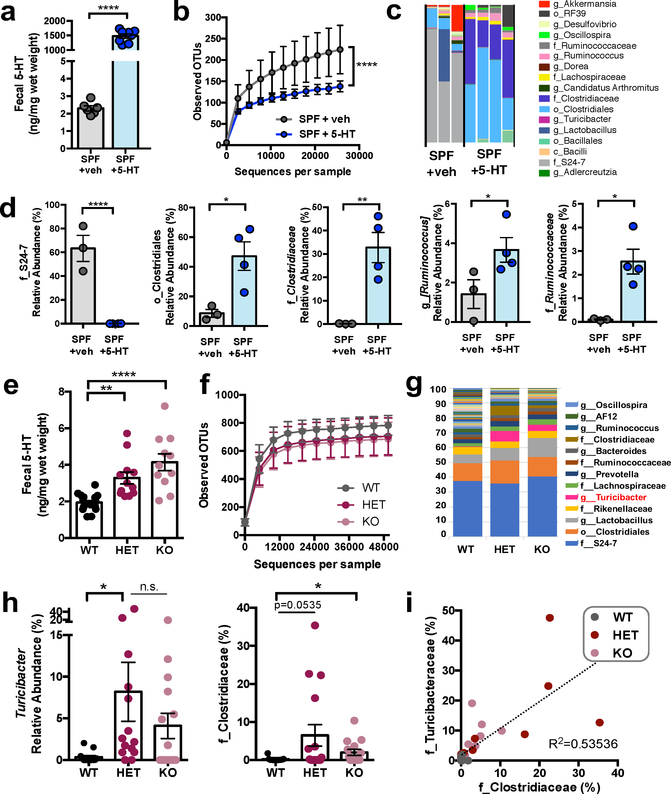
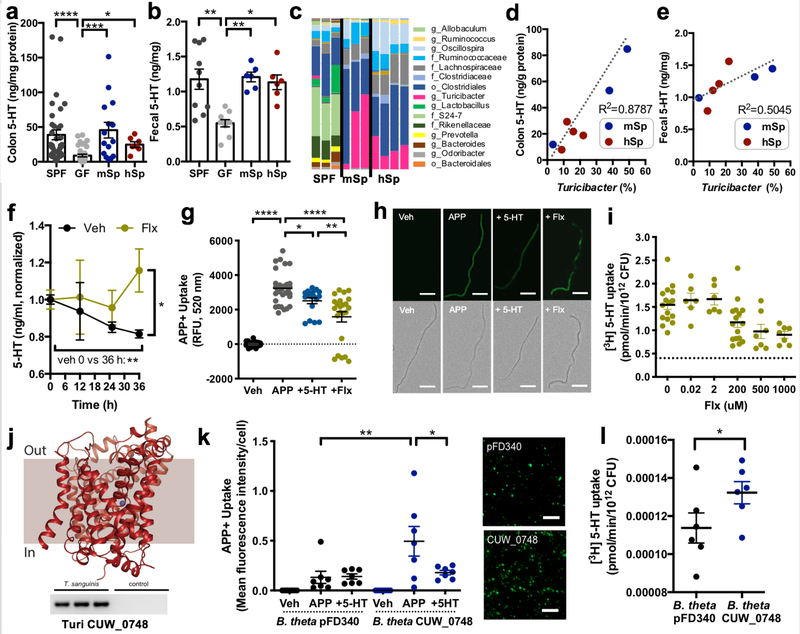
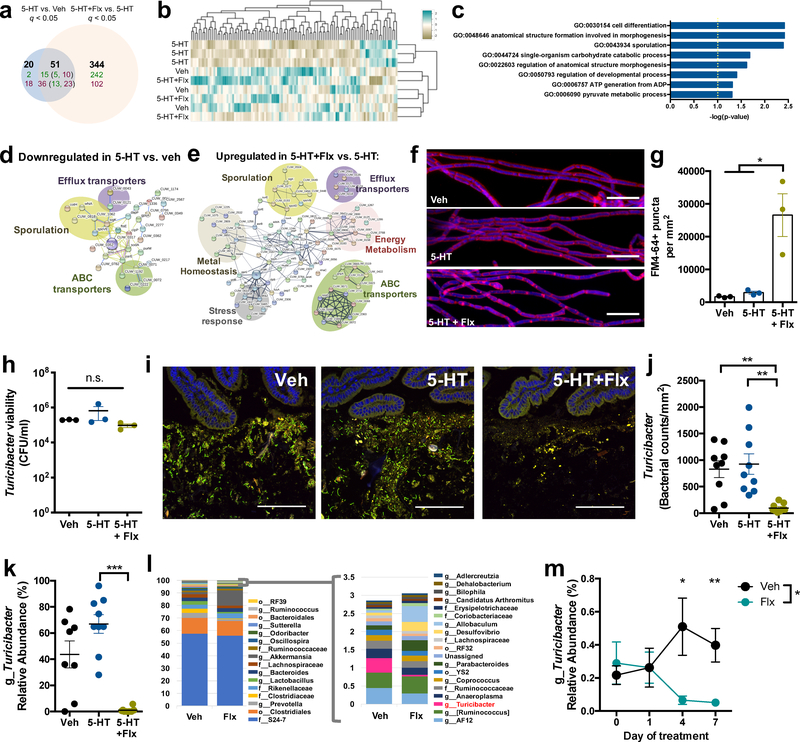
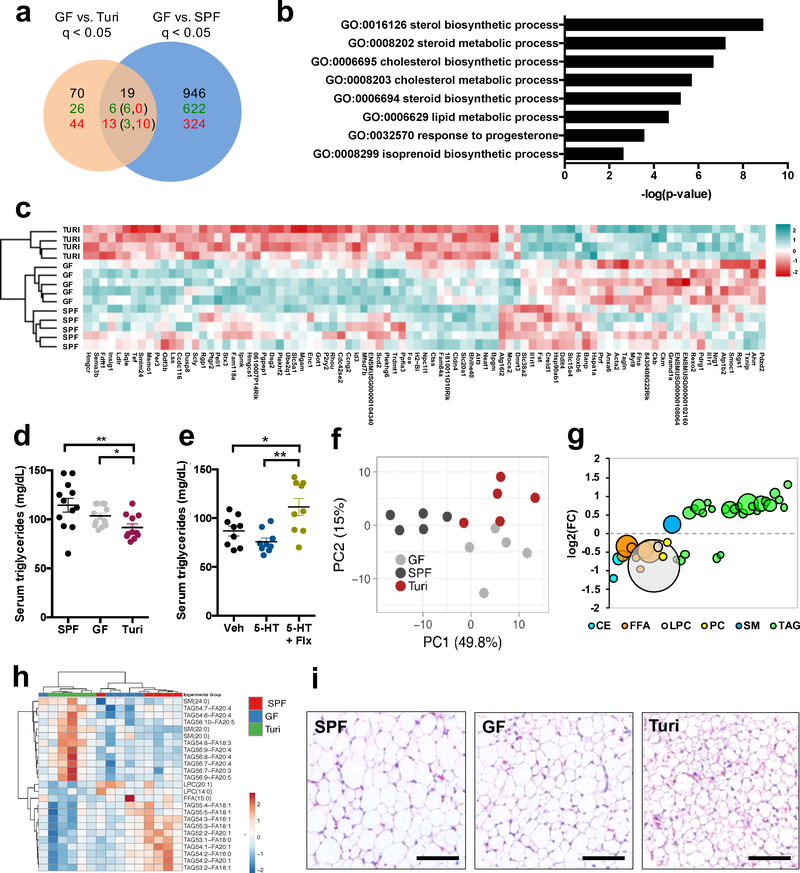
The gut microbiota regulates levels of serotonin (5-hydroxytryptamine (5-HT)) in the intestinal epithelium and lumen1-5. However, whether 5-HT plays a functional role in bacteria from the gut microbiota remains unknown. We demonstrate that elevating levels of intestinal lumenal 5-HT by oral supplementation or genetic deficiency in the host 5-HT transporter (SERT) increases the relative abundance of spore-forming members of the gut microbiota, which were previously reported to promote host 5-HT biosynthesis. Within this microbial community, we identify Turicibacter sanguinis as a gut bacterium that expresses a neurotransmitter sodium symporter-related protein with sequence and structural homology to mammalian SERT. T. sanguinis imports 5-HT through a mechanism that is inhibited by the selective 5-HT reuptake inhibitor fluoxetine. 5-HT reduces the expression of sporulation factors and membrane transporters in T. sanguinis, which is reversed by fluoxetine exposure. Treating T. sanguinis with 5-HT or fluoxetine modulates its competitive colonization in the gastrointestinal tract of antibiotic-treated mice. In addition, fluoxetine reduces the membership of T. sanguinis in the gut microbiota of conventionally colonized mice. Host association with T. sanguinis alters intestinal expression of multiple gene pathways, including those important for lipid and steroid metabolism, with corresponding reductions in host systemic triglyceride levels and inguinal adipocyte size. Together, these findings support the notion that select bacteria indigenous to the gut microbiota signal bidirectionally with the host serotonergic system to promote their fitness in the intestine.


Conflict of interest statement

Competing Interests: The authors declare no competing interests. Findings regarding the host effect of T. sanguinis reported in the manuscript are the subject of provisional patent application US 62/815,760, owned by UCLA.

Figures

Figure 1:
Figure 1:. Elevating intestinal 5-HT enriches for spore-forming bacteria in the gut.
a, Fecal 5-HT levels from SPF mice orally supplemented with 5-HT or vehicle in drinking water (two- tailed, unpaired Student’s t-test; n = 6, 8 cages). b, Alpha-diversity of OTUs derived from 16S rDNA sequencing of feces following vehicle vs. 5-HT treatment (two-way ANOVA with Bonferroni, n=3, 4 cages). c, Taxonomic diversity of the fecal microbiota after vehicle vs. 5-HT treatment (n=3, 4 cages). d, Relative abundance of bacterial taxa in fecal microbiota after vehicle vs. 5-HT treatment (two-way ANOVA with Kruskal-Wallis, n=3, 4 cages). e, Fecal 5-HT levels from SPF wild-type (WT), SERT+/− (HET) and SERT−/− (KO) mice. (one-way ANOVA with Bonferroni, n=13–15 cages). f, Alpha-diversity of OTUs derived from 16S rDNA sequencing of feces from SERT-deficient mice relative to WT controls (n=10–12 cages). g, Taxonomic diversity of the fecal microbiota after vehicle vs. 5-HT treatment (n=10–12 cages). h, Relative abundance of bacterial taxa in fecal microbiota of SERT-deficient mice relative to WT controls (one-way ANOVA with Kruskal Wallis, n=10, 11, 12 cages; n.s.: p=0.2134). i, Linear correlation between relative abundance of Turicibacteraceae vs. Clostridiaceae in fecal microbiota from SERT- deficient mice vs. WT controls (n=13, 15, 14 cages). (Mean ± SEM, * p < 0.05, ** p < 0.01, **** p < 0.0001, n.s. = not statistically significant; refer to Supplementary Table 11 for detailed statistical information)
Figure 2:
Figure 2:. Turicibacter sanguinis uptakes 5-HT, which is inhibited by the selective serotonin reuptake inhibitor, fluoxetine.
a, Colon and fecal levels of 5-HT in mice that are conventionally colonized (SPF), germ-free (GF) or colonized with mouse-derived (m) or human-derived (h) spore-forming bacteria (Sp) (one-way ANOVA with Bonferroni, n=36, 37, 15, 7 mice). b, Fecal 5-HT in SPF, GF or mSp- or hSp-colonized mice (one-way ANOVA with Bonferroni, n=10, 10, 6, 6 mice). c, Taxonomic diversity of the fecal microbiota of SPF, mSp- and hSp-colonized mice (n=3, 4 cages). d, Linear correlation between fecal Turicibacter and colon 5-HT (n=3, 4 cages). e, Linear correlation between fecal Turicibacter and fecal 5-HT (n=3, 4 cages). f, 5-HT in supernatant after 0, 12, 25 and 36 hours of T. sanguinis MOL361 growth in Schaedler broth supplemented with vehicle or 200 uM fluoxetine (two-way ANOVA with Bonferroni, n=3, 4 cultures). g, Uptake by T. sanguinis exposed to vehicle (Veh) or APP+, either alone (APP) or with 200 uM 5-HT (+5-HT) or fluoxetine (+Flx) pre-treatment for 30 min (one-way ANOVA with Bonferroni, n=33, 33, 18, 23 cultures). h, Representative images of T. sanguinis exposed to Veh, APP, +5-HT or +Flx for 30 min (representing n=33, 33, 18, 23 cultures). Scale bar: 20 um. i, [3H] 5-HT uptake by T. sanguinis at 20 min after pre-treatment with Veh or +Flx. Dotted line: average background signal in negative controls. (one-way ANOVA with Bonferroni, n=7–16 cultures). j, Top: Predicted structural model for the putative SERT ortholog CUW_0748 in T. sanguinis MOL361. Bottom: qPCR product for CUW_0748 cDNA generated from T. sanguinis RNA (n=3 cultures). k, APP+ uptake in B. theta expressing CUW_0748 or vector control (pFD340) at 20 min after exposure to Veh, APP or +5-HT (one-way ANOVA with Bonferroni, n=7 cultures). Right: Representative images of APP+ uptake in B. theta expressing CUW_0748 or pFD340 control, with brightness at 90% higher than that in panel H. Scale bar: 20 um. l, Uptake of 1 uM [3H] 5-HT by B. theta expressing CUW_0748 or pFD340 after 20 min (two-tailed unpaired Student’s t-test, n=6 cultures). (Mean ± SEM, * p < 0.05, ** p < 0.01, *** p < 0.001, **** p < 0.0001, n.s. = not statistically significant; refer to Supplementary Table 11 for detailed statistical information)
Figure 3:
Figure 3:. 5-HT and the selective serotonin reuptake inhibitor, fluoxetine, regulate gene expression and intestinal colonization of Turicibacter sanguinis.
a, Differentially expressed genes (q < 0.05) in T. sanguinis MOL361 after 4 hr exposure to vehicle, 200 uM 5-HT, or 5-HT with fluoxetine (Flx). Bold:total genes. Green:upregulated genes; red: downregulated genes. Numbers in parentheses: 5-HT-regulated genes that were further differentially expressed by Flx (Benjamini-Hochberg, n=3 cultures). b, Heatmap of genes with coefficient of variation < 3 (n=3 cultures). c, GO term enrichment analysis of genes differentially expressed in 5-HT vs. vehicle and 5-HT + Flx vs. 5-HT. (Fisher exact, n=3 cultures) d, Protein network analysis of 54 genes downregulated in T. sanguinis treated with 5-HT vs. vehicle. (n=3 cultures) e, Protein network analysis of 257 genes upregulated in T. sanguinis treated with 5-HT + Flx vs. 5-HT. (n=3 cultures) f, Representative images of T. sanguinis treated for 4 hr with vehicle, 200 uM 5-HT, or 5-HT with Flx, and stained with FM 4–64 membrane dye (pink) and DAPI (blue). (n=3 cultures). Scale bar: 10 um. g, Number of FM 4–64 puncta per area of T. sanguinis (one-way ANOVA with Bonferroni, n=3 cultures). h, Viability of T. sanguinis after 4 hr exposure to vehicle, 200 uM 5- HT, or 5-HT with Flx. (one-way ANOVA with Bonferroni, n=3 cultures; n.s.: p=0.9891). i, Representative FISH images of T. sanguinis (green) and small intestinal epithelial cells (DAPI, blue) from antibiotic-treated mice at 3 days after gavage with T. sanguinis pre-treated for 4 hr with vehicle, 200 uM 5-HT, or 5-HT with Flx (n=9 cages). Scale bar: 100 um. j, T. sanguinis cell counts from FISH images (one-way ANOVA with Bonferroni, n=9 cages). k, Relative abundance of Turicibacter by 16S rDNA sequencing of small intestinal lumenal contents (one- way ANOVA with Bonferroni, n=9 cages). l, Taxonomic diversity based on 16S rDNA sequencing of fecal microbiota on day 7 of Flx treatment. m, Relative abundance of Turicibacter in feces from SPF mice at 0, 1, 4, and 7 days after gavage with 10 mg/kg Flx (two-way ANOVA with Bonferroni, n=8, 18 cages). (Mean ± SEM, * p < 0.05, ** p < 0.01, *** p < 0.001, n.s. = not statistically significant; refer to Supplementary Table 11 for detailed statistical information).
Figure 4:
Figure 4:. Turicibacter sanguinis colonization regulates host lipid metabolism.
a, Differentially expressed genes (q < 0.05) in small intestines from T. sanguinis- monocolonized, germ-free (GF) or SPF mice. Bolded numbers represent total differentially expressed genes. Numbers in green denote upregulated genes; numbers in red denote downregulated genes. Numbers in parentheses denote subsets of T. sanguinis regulated genes that were further differentially expressed by SPF (Wald test, n=5, 5, 4 mice). b, GO term enrichment analysis of genes differentially expressed in small intestine in response to T. sanguinis relative to GF controls (Fisher exact, n=4, 5, 5 mice). c, Heatmap of the 89 differentially expressed genes in the small intestine in response to T. sanguinis colonization (n=5, 5, 4 mice). d, Total serum triglyceride levels in GF, SPF and T. sanguinis- monocolonized mice (one-way ANOVA with Bonferroni, n=12, 13, 11 mice). e, Total serum triglyceride levels from antibiotic-treated mice gavaged with T. sanguinis pre-treated for 4 hr with vehicle, 200 uM 5-HT, or 200 uM 5-HT with Flx (one-way ANOVA with Bonferroni, n=9 mice). f, Principal components analysis of serum lipidomic data for lipid species with p < 0.05 for T. sanguinis vs. GF and T. sanguinis vs. SPF mice (two-way ANOVA + Bonferroni, n=5 mice). g, Average fold change (FC) of serum lipid species (p < 0.05) differentially regulated by T. sanguinis compared to GF controls. Largest circle = p < 0.001, smallest circle = p<0.05. CE=cholesterol esters, FFA=free fatty acids, LPC=lysophosphatidylcholines, PC=phosphatidylcholines, SM=sphingomyelins, TAG=triacylglycerides. (two-way ANOVA + Bonferroni, n=5 mice). h, Heatmap of 25 serum lipid species similarly increased (red) or decreased (blue) by T. sanguinis colonization relative to both GF and SPF controls (n=5 mice). i, Representative image of inguinal white adipose tissue from GF, SPF and T. sanguinis-monocolonized mice. Scale bar = 100 um. (representing n=5 mice) (Mean ± SEM, * p < 0.05, ** p < 0.01, *** p < 0.001, **** p < 0.0001, n.s. = not statistically significant; refer to Supplementary Table 11 for detailed statistical information)

Comment in

References

    1. Vuong HE, Yano JM, Fung TC & Hsiao EY The Microbiome and Host Behavior. Annu Rev Neurosci 40, 21–49, doi:10.1146/annurev-neuro-072116-031347 (2017). - DOI - PMC - PubMed
    1. Gershon MD & Tack J The serotonin signaling system: from basic understanding to drug development for functional GI disorders. Gastroenterology 132, 397–414, doi:10.1053/j.gastro.2006.11.002 (2007). - DOI - PubMed
    1. Reigstad CS et al. Gut microbes promote colonic serotonin production through an effect of short-chain fatty acids on enterochromaffin cells. FASEB J 29, 1395–1403, doi:10.1096/fj.14-259598 (2015). - DOI - PMC - PubMed
    1. Wikoff WR et al. Metabolomics analysis reveals large effects of gut microflora on mammalian blood metabolites. PloS one 106, 3698–3703, doi:10.1371/journal.pone.018074510.1073/pnas.0812874106 (2009). - DOI - PMC - PubMed
    1. Yano JM et al. Indigenous bacteria from the gut microbiota regulate host serotonin biosynthesis. Cell 161, 264–276, doi:10.1016/j.cell.2015.02.047 (2015). - DOI - PMC - PubMed

Methods References

    1. Abdala-Valencia H et al. Inhibition of allergic inflammation by supplementation with 5- hydroxytryptophan. Am J Physiol Lung Cell Mol Physiol 303, L642–660, doi:10.1152/ajplung.00406.2011 (2012). - DOI - PMC - PubMed
    1. Caporaso JG et al. Global patterns of 16S rRNA diversity at a depth of millions of sequences per sample. Proceedings of the National Academy of Sciences of the United States of America 108 Suppl 1, 4516–4522, doi:10.1073/pnas.1000080107 (2011). - DOI - PMC - PubMed
    1. Caporaso JG et al. QIIME allows analysis of high-throughput community sequencing data. Nature methods 7, 335–336, doi:10.1038/nmeth.f.303 (2010). - DOI - PMC - PubMed
    1. Langille MG et al. Predictive functional profiling of microbial communities using 16S rRNA marker gene sequences. Nat Biotechnol 31, 814–821, doi:10.1038/nbt.2676 (2013). - DOI - PMC - PubMed
    1. Katoh K, Rozewicki J & Yamada KD MAFFT online service: multiple sequence alignment, interactive sequence choice and visualization. Brief Bioinform, doi:10.1093/bib/bbx108 (2017). - DOI - PMC - PubMed

Publication types

MeSH terms

Supplementary concepts