. 2019 Oct;20(10):1360-1371.
doi: 10.1038/s41590-019-0472-4. Epub 2019 Sep 2.

Follicular regulatory T cells control humoral and allergic immunity by restraining early B cell responses

Affiliations

Follicular regulatory T cells control humoral and allergic immunity by restraining early B cell responses

Rachel L Clement et al. Nat Immunol. 2019 Oct.

Abstract

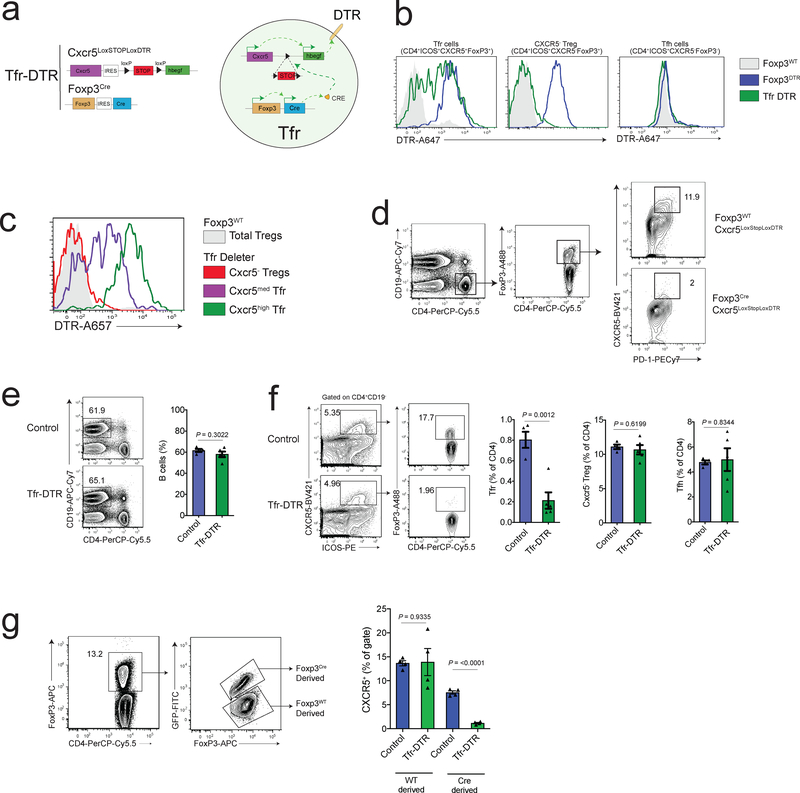
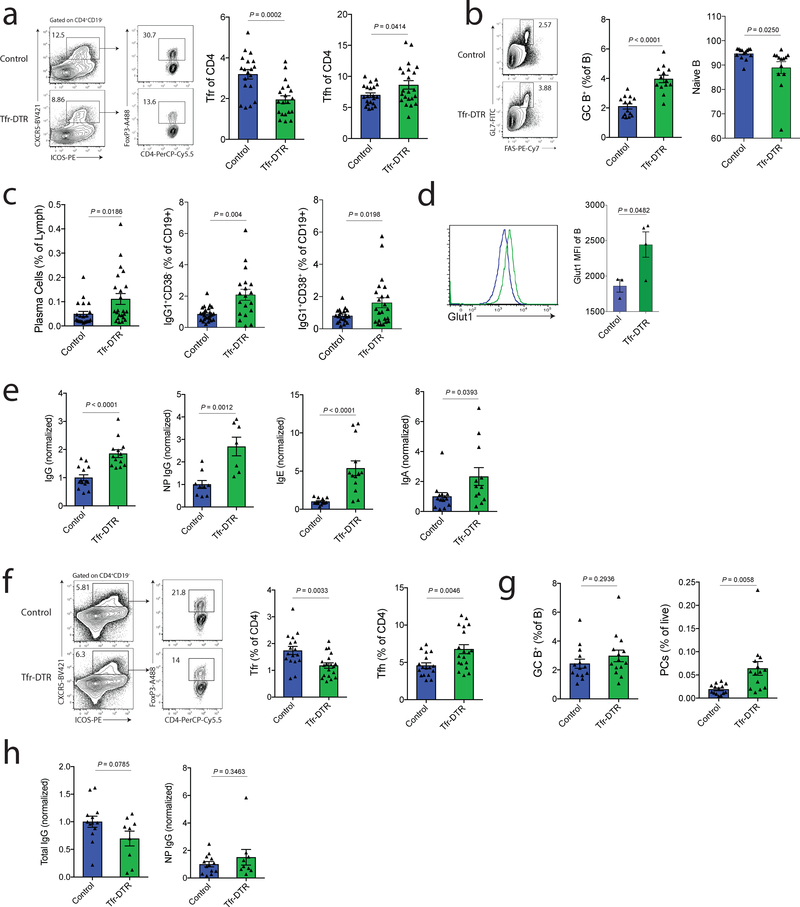
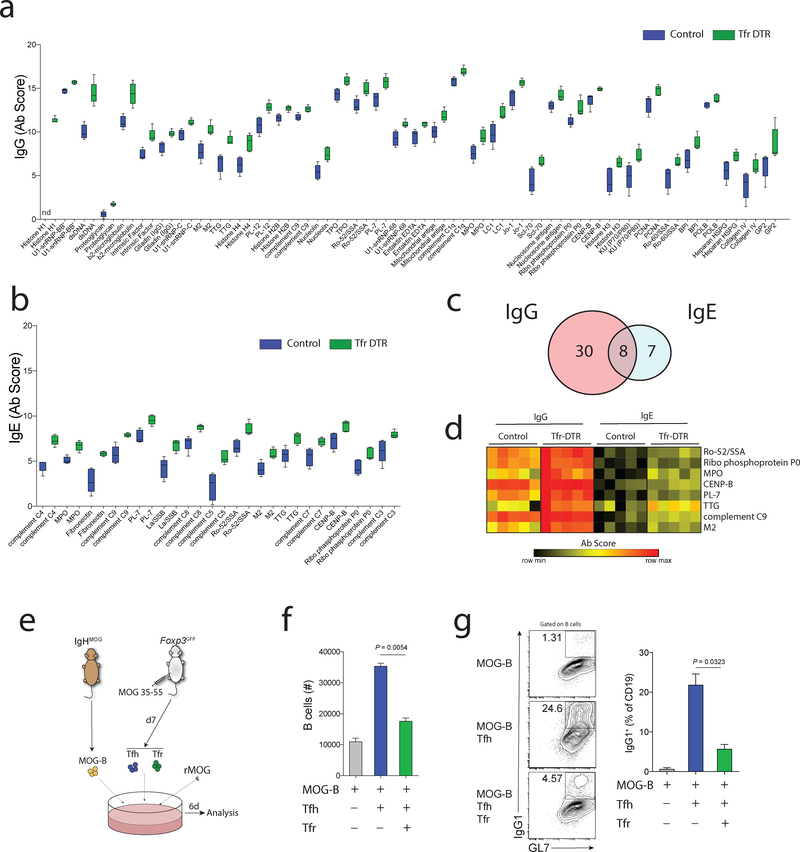
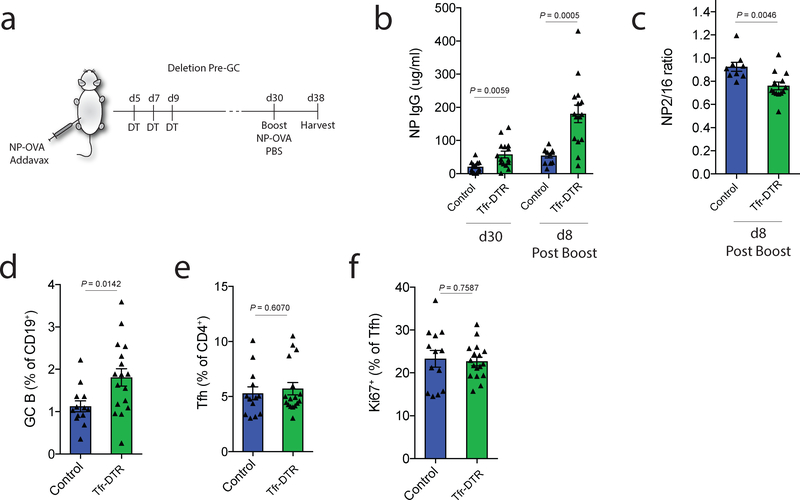
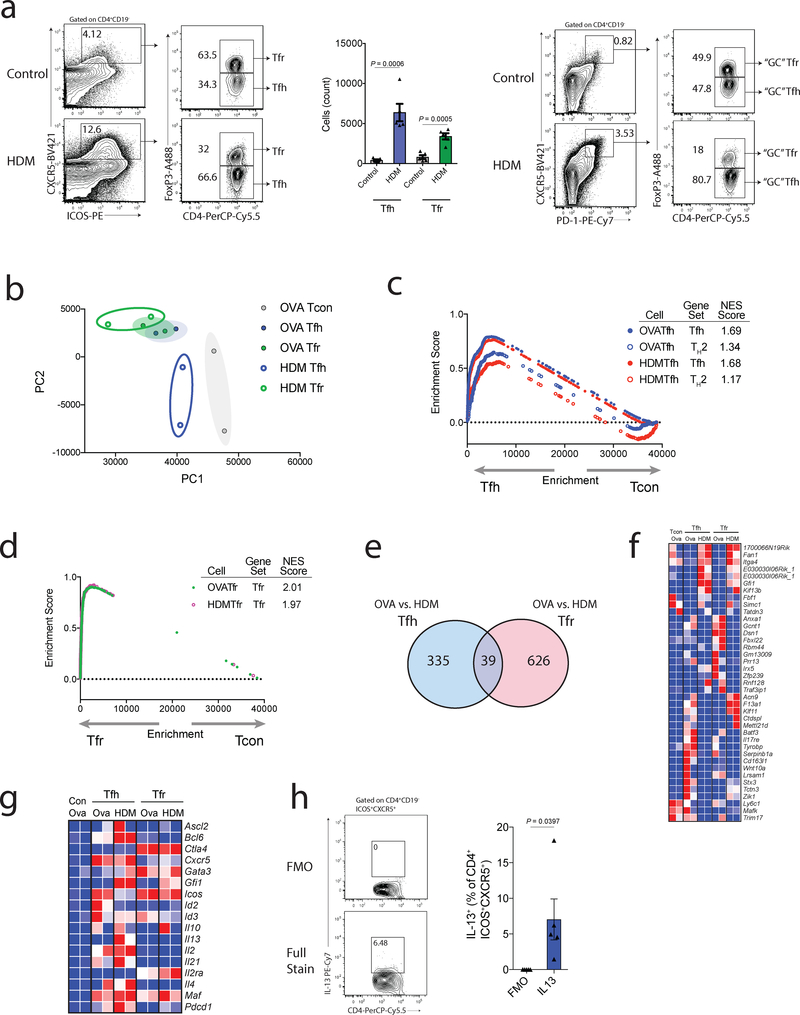
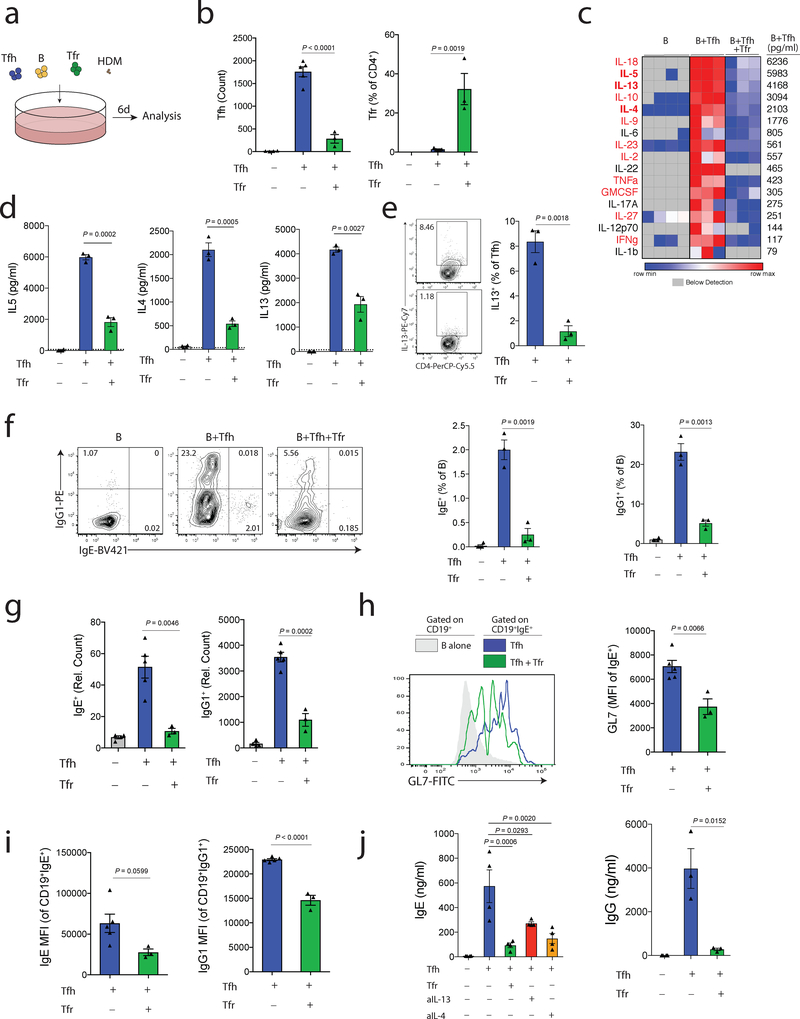
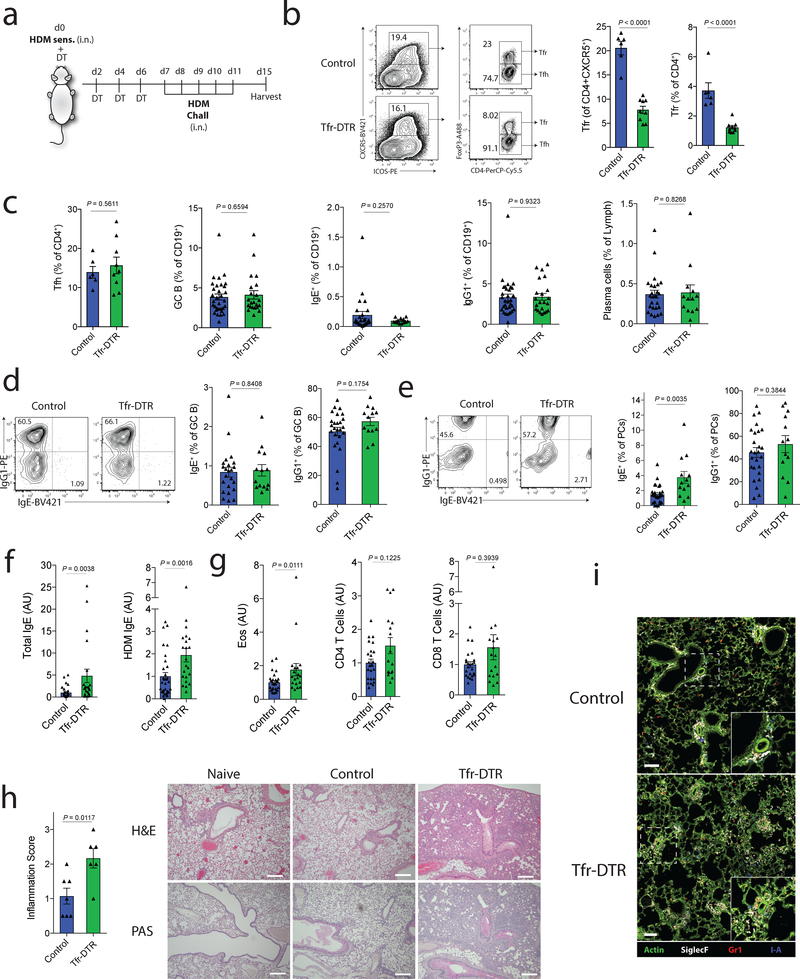
Follicular regulatory T (TFR) cells have specialized roles in modulating follicular helper T (TFH) cell activation of B cells. However, the precise role of TFR cells in controlling antibody responses to foreign antigens and autoantigens in vivo is still unclear due to a lack of specific tools. A TFR cell-deleter mouse was developed that selectively deletes TFR cells, facilitating temporal studies. TFR cells were found to regulate early, but not late, germinal center (GC) responses to control antigen-specific antibody and B cell memory. Deletion of TFR cells also resulted in increased self-reactive immunoglobulin (Ig) G and IgE. The increased IgE levels led us to interrogate the role of TFR cells in house dust mite models. TFR cells were found to control TFH13 cell-induced IgE. In vivo, loss of TFR cells increased house-dust-mite-specific IgE and lung inflammation. Thus, TFR cells control IgG and IgE responses to vaccines, allergens and autoantigens, and exert critical immunoregulatory functions before GC formation.


Conflict of interest statement

Competing interests

The authors declare no competing interests

Figures

Figure 1.
Figure 1.. Development of a Tfr-specific Deleter Model
a) Schematic diagram of the Tfr-DTR strain. Allele details (left) and schematic of events leading to Tfr-specific DTR expression (right) are shown. b) DTR expression on Tfr cells (left), CXCR5- Treg cells (middle) or Tfh cells (right) from control (Foxp3WT), Foxp3DTR, or Tfr-DTR mice. c) DTR expression on CXCR5 negative, CXCR5-medium, or CXCR5-high Tfr cells from Tfr-DTR mice. d) Quantification of Tfr cells from Tfr-DTR (Foxp3Cre Cxcr5LoxStopLoxDTR/WT) or control (Foxp3WT Cxcr5LoxStopLoxDTR/WT) mice which were immunized 7 days previously and received diphtheria toxin 2,4 and 6 days after immunization. e) Quantification of B cells from Tfr-DTR or control mice (Foxp3Cre Cxcr5WT/WT) which were immunized 7 days previously and received diphtheria toxin 2, 4 and 6 days after immunization. f) Quantification of Tfr, CXCR5- Treg and Tfh cells from mice as in (e). g) Quantification of Tfr cells (by assessing CXCR5+ Treg cells) from Foxp3Cre/WT Cxcr5LoxStopLoxDTR/WT or control (Foxp3Cre/WT Cxcr5WT/WT) mice, gated on Cre-derived or WT-derived FoxP3 alleles. Column graphs represent the mean with error bars indicating standard error. P value indicates two-tailed student’s T test. Data are from individual experiments and are representative of 2 (b-d,g) or 4 (e-f) independent experiments with similar results.
Figure 2.
Figure 2.. Tfr cells Potently Regulate Early Geminal Center Formation
a) Quantification of Tfr (gated as CD4+ICOS+CXCR5+FoxP3+CD19) and Tfh (gated as CD4+ICOS+CXCR5+FoxP3CD19) cells from dLNs of Tfr-DTR (Foxp3Cre Cxcr5LoxStopLoxDTR/WT) or Control (Foxp3Cre Cxcr5WT/WT) mice 21 days after immunization. Diphtheria toxin (DT) was administered on days 5,7 and 9 to delete Tfr cells before GC initiation. b) Quantification of GC B cells (gated as CD19+GL7+FAS+) and naive B cells (gated as CD38+IgG1) from dLNs at d21 after immunization as in (a). c) Quantification of plasma cells (gated as CD138+), class switched B cells (gated as CD19+IgG1+CD38-), and memory-like B cells (gated as CD19+IgG1+CD38+) at d21 after immunization as in (a). d) Glut1 expression on B cells from mice as in (a). Representative histogram (left) and quantification (right). e) Quantification of total IgG (far left), NP-specific IgG (middle left), total IgE (middle right) and total IgA (far right) analyzed from serum of mice as in (a). f) Quantification of Tfr (gated as CD4+ICOS+CXCR5+FoxP3+CD19) and Tfh (gated as CD4+ICOS+CXCR5+FoxP3CD19) cells from dLNs of Tfr-DTR (Foxp3Cre Cxcr5LoxStopLoxDTR/WT) or Control (Foxp3Cre Cxcr5WT/WT) mice at d21 after immunization. Diphtheria toxin (DT) was administered on days 10, 12 and 14 to delete Tfr cells after GC formation. g) Quantification of GC B cells (gated as CD19+GL7+FAS+) and plasma cells (CD138+) from dLNs at d21 after immunization as in (e). h) Quantification of total IgG (left) and NP-specific IgG (left). Column graphs represent the mean with error bars indicating standard error. P value indicates two-tailed student’s T test. Data are combined results from 4 (a-c,e) or 3 (f-h) independent experiments, or are from an individual experiment which is representative of two independent experiments (d).
Figure 3.
Figure 3.. Tfr cells control autoreactive IgG and IgE during foreign antibody responses
a) Quantification of IgG scores for indicated autoantigens from Tfr-DTR (Foxp3Cre Cxcr5LoxStopLoxDTR/WT) or Control (Foxp3Cre Cxcr5WT/WT) mice which were immunized with NP-OVA and given DT to delete Tfr cells before GC initiation as in Fig. 2a. Serum was collected at d21 after immunization. Autoantigens which showed a significant different difference between control and Tfr-DTR mice (38 out of 123, p<0.01, Mann-Whitney U test) are shown. b) Quantification of IgE scores for indicated autoantigens as in (a). Autoantigens which showed a significant difference between control and Tfr-DTR mice (15 out of 123, p<0.01, Mann-Whitney U test) are shown. c) Venn diagram showing overlap of differentially expressed autoantibodies for IgG and IgE isotypes in Tfr-DTR mice. d) Heatmap showing IgG and IgE autoantibody scores for the 8 overlapping autoantigens Tfr-DTR compared to control mice. e) Schematic of in vitro autoreactive B cell suppression assay. Tfh and Tfr cells from MOG35–55 immunized mice were cultured with IgHMOG B cells in the presence of rMOG for 6 days. f) Relative count of B cells from suppression assays as in (e). g) Quantification of class switching to IgG1 in suppression assays as in (e). Representative plots (left) and quantification (right) are shown. Graphs are box and whisker plots with horizontal line indicating the mean and bars indicating range of values (a-b). Column graphs represent the mean with error bars indicating standard error (f-g). Data are from an individual experiment with 5 mice per group (a-b), or are replicate suppression assays from an individual experiment and is representative of 3 independent experiments (e-g). P value indicates two-tailed student’s T test.
Figure 4.
Figure 4.. Tfr cells regulate antibody memory responses
a) Schematic of Tfr-deletion to assess memory responses. Tfr-DTR or control mice were immunized with NP-OVA in MF59 and DT was administered on days 5,7 and 9 to delete Tfr cells prior to GC formation. Mice received a boost of NP-OVA without adjuvant at d30. Mice were harvested on d38. b) Analysis of NP-specific IgG levels before and after NP-OVA boost as in (a). c) Quantification of the NP2/NP16 ratio in experiments as in (a). d) Quantification of GC B cells (gated as CD19+GL7+FAS+) from dLN of mice at d38 as in (a). e) Quantification of Tfh (gated as CD4+ICOS+CXCR5+FoxP3-CD19-) cells at d38 as in (a). f) Quantification of Ki67 expression in Tfh cells gated as in (e). Column graphs represent the mean with error bars indicating standard error. P value indicates two-tailed student’s T test. Data represent combined data from 3 independent experiments.
Figure 5.
Figure 5.. House dust mite antigen generates distinct populations of Tfh and Tfr cells
a) Quantification of Tfh and Tfr cells in response to HDM challenge. WT mice were challenged or not (control) with HDM intranasally on days 0, 2, 4 and 6. dLNs were harvested on d7. Gating strategy to identify Tfh and Tfr cells (left), total numbers of Tfh and Tfr cells (middle) and gating strategy for “GC” Tfh and Tfr cells (right) are shown. b) Principal component analysis (PCA) showing relationship between transcriptional profiles of Tfh (CD4+ICOS+CXCR5+FoxP3-CD19-) and Tfr (CD4+ICOS+CXCR5+FoxP3+CD19-) cells generated in response to NP-OVA (subcutaneous) or HDM (intransal) challenge in Foxp3GFP mice. c) Gene set enrichment analysis (GSEA) comparing Tfh cells generated in response to NP-OVA or HDM for Tfh or TH2 signatures (GSEA14308). d) GSEA comparing Tfr cells generated in response to NP-OVA or HDM for Tfr signatures. e) Venn diagram demonstrating the overlap of differentially expressed genes (p<0.05) between NP-OVA and HDM components for Tfh and Tfr cells. f) Heatmap showing the 39 commonly differentially expressed genes in Tfh and Tfr cells in NP-OVA versus HDM challenge as in (e). g) Heatmap of common follicular T cell and TH2 genes in Tfh and Tfr cells generated in response to NP-OVA or HDM challenge. h) IL-13 production by HDM Tfh cells. Intracellular staining was performed on HDM treated mice as in (a). FMO= stain without anti-IL-13 antibody. Column graphs represent the mean with error bars indicating standard error. P value indicates two-tailed student’s T test. Data are representative of 3 independent experiments (a,h), or are combined data from 2 independent experiments (b-g).
Figure 6.
Figure 6.. Tfr cells regulate Tfh13-mediated IgE responses in vitro
a) Schematic of experimental design for an in vitro HDM suppression assay. Total B, Tfh and Tfr cells were purified from the dLN of mice that received HDM on days 0,2,4 and 6 and added to culture wells along with HDM for 6 days. b) Quantification of total Tfh cells (left) and the percentage of Tfr cells (FoxP3+ of CD4+IA-CD19- cells) (right) from cultures as in (a). c) Quantification of cytokines in culture supernatants from cultures as in (a). Cytokines listed in red have levels statistically lower in cultures containing Tfr cells compared to cultures without Tfr cells. d) Column graphs of IL5, IL4 and IL13 from data in (c). e) Intracellular cytokine staining of IL-13 in Tfh cells from cultures as in (a). f) Analysis of class switching to IgG1 and IgE in cultures as in (a). Representative gating (left, pregated on CD19+IA+CD4- cells), IgE+ B cell quantification (middle) and IgG1+ B cell quantification (right) are shown. g) Counts of total IgE+ (left) and IgG1+ (right) B cells expressed as relative counts from experiments as in (a). h) Expression of GL7 on IgE+ B cells from indicated cultures as in (a). i) Expression of IgE on IgE+ B cells (left) and IgG1 on IgG1+ B cells are shown from cultures as in (a). j) Levels of IgE (left) and IgG (right) in culture supernatants from cultures as in (a). Anti-IL13 or anti-IL4 were added to indicated wells. Column graphs represent the mean with error bars indicating standard error. P value indicates two-tailed student’s T test (b-i, j; right) or One-way ANOVA with Tukey’s correction (j; left). Data are from individual experiments and are representative of 3 independent experiments.
Figure 7.
Figure 7.. Tfr cells regulate HDM-specific IgE responses in vivo
a) Schematic of HDM sensitization and challenge model to induce lung inflammation. Tfr-DTR (Foxp3Cre Cxcr5LoxStopLoxDTR/WT) or Control (Foxp3Cre Cxcr5WT/WT) mice received HDM sensitization at day 0 followed by DT administration at days 0,2,4 and 6. Mice were challenged with HDM on days 7–11 and harvested on day 15. b) Analysis of Tfr cells from dLN of HDM challenged mice as in (a). Representative gating (left) and quantification (right) are shown. c) Quantification of Tfh, GC B cells (CD19+GL7+FAS+), total IgE+ B cells (CD19+IgE+), total IgG1+ B cells (CD19+IgG1+) and total plasma cells (CD138+) from dLN of HDM challenged mice as in (a). d) Quantification of IgG1 and IgE expression in GC B cells (CD19+GL7+FAS+). e) Quantification of IgG1 and IgE expression in plasma cells (CD138+). f) Quantification of total IgE or HDM-specific IgE from HDM challenged mice as in (a). (n=30, Control; n=22, Tfr-DTR) g) Quantification of Eosinophils (left), CD4 T cells (middle) or CD8 T cells (right) from the BAL fluid of mice as in (a). (n=24, Control; n=17, Tfr-DTR) h) Lung inflammation scores (left) and representative images of H&E or PAS staining (right) of lung samples. Scale bars = 500μM. i) Immunofluorescence micrographs of lungs stained for Actin, SiglecF, Gr1 and I-A. Scale bars = 100μM. Column graphs represent the mean with error bars indicating standard error. P value indicates two-tailed student’s T test (b-e) or Mann-Whitney (f-h). Data are from individual experiments and are representative of 3 independent experiments (b, c left), are combined data from 4 independent experiments (c right, d-g), or are from one experiment (h-i).

References

    1. Crotty S Follicular helper CD4 T cells (TFH). Annu Rev Immunol 29, 621–663 (2011). - PubMed
    1. Victora GD & Nussenzweig MC Germinal centers. Annu Rev Immunol 30, 429–457 (2012). - PubMed
    1. Crotty S T follicular helper cell differentiation, function, and roles in disease. Immunity 41, 529–542 (2014). - PMC - PubMed
    1. Vinuesa CG, Linterman MA, Yu D & MacLennan IC Follicular Helper T Cells. Annu Rev Immunol 34, 335–368 (2016). - PubMed
    1. Cannons JL, Lu KT & Schwartzberg PL T follicular helper cell diversity and plasticity. Trends Immunol (2013). - PMC - PubMed

Methods only References

    1. Bettelli E et al. Reciprocal developmental pathways for the generation of pathogenic effector TH17 and regulatory T cells. Nature 441, 235–238 (2006). - PubMed
    1. Litzenburger T et al. B lymphocytes producing demyelinating autoantibodies: development and function in gene-targeted transgenic mice. J Exp Med 188, 169–180 (1998). - PMC - PubMed
    1. Sage PT & Sharpe AH In Vitro Assay to Sensitively Measure TFR Suppressive Capacity and TFH Stimulation of B Cell Responses. Methods Mol Biol 1291, 151–160 (2015). - PubMed

Publication types

MeSH terms