. 2019 Dec 2;129(12):5204-5218.
doi: 10.1172/JCI123835.

Soluble epoxide hydrolase promotes astrocyte survival in retinopathy of prematurity

Affiliations

Soluble epoxide hydrolase promotes astrocyte survival in retinopathy of prematurity

Jiong Hu et al. J Clin Invest. .

Abstract

Polyunsaturated fatty acids such as docosahexaenoic acid (DHA) positively affect the outcome of retinopathy of prematurity (ROP). Given that DHA metabolism by cytochrome P450 and soluble epoxide hydrolase (sEH) enzymes affects retinal angiogenesis and vascular stability, we investigated the role of sEH in a mouse model of ROP. In WT mice, hyperoxia elicited tyrosine nitration and inhibition of sEH and decreased generation of the DHA-derived diol 19,20-dihydroxydocosapentaenoic acid (19,20-DHDP). Correspondingly, in a murine model of ROP, sEH-/- mice developed a larger central avascular zone and peripheral pathological vascular tuft formation than did their WT littermates. Astrocytes were the cells most affected by sEH deletion, and hyperoxia increased astrocyte apoptosis. In rescue experiments, 19,20-DHDP prevented astrocyte loss by targeting the mitochondrial membrane to prevent the hyperoxia-induced dissociation of presenilin-1 and presenilin-1-associated protein to attenuate poly ADP-ribose polymerase activation and mitochondrial DNA damage. Therapeutic intravitreal administration of 19,20-DHDP not only suppressed astrocyte loss, but also reduced pathological vascular tuft formation in sEH-/- mice. Our data indicate that sEH activity is required for mitochondrial integrity and retinal astrocyte survival in ROP. Moreover, 19,20-DHDP may be more effective than DHA as a nutritional supplement for preventing retinopathy in preterm infants.

Keywords: Angiogenesis; Apoptosis; Eicosanoids; Ophthalmology; Retinopathy.


Conflict of interest statement

Conflict of interest: The authors have declared that no conflict of interest exists.

Figures

Figure 1
Figure 1. Comparison of the vascular phenotype in retinas from WT and sEH–/– mice with ROP.
(A) Effect of sEH deletion on vascular ablation (avascular area) and neovascularization on P17. Endothelial cells were stained with isolectin B4 (IB4, green) and pericytes with NG-2 (red). Red lines indicate avascular zones. Arrows indicate peripheral neovascularization. Scale bar: 500 μm. n = 8 animals/group. (B) Periodic acid Schiff and hematoxylin staining of cross-sections of retinas from WT and sEH–/– mice with ROP on P17. Periretinal nuclei above the inner limiting membrane are indicated by arrows. Scale bar: 50 μm. n = 6 animals/group. (C) Whole mounts of retinas from WT and sEH–/– mice on P17. Regions with bleeding are highlighted with red dotted lines. Scale bars: 500 μm. n = 6 animals/group. *P < 0.05, **P < 0.01, and ***P < 0.001 (Student’s t test).
Figure 2
Figure 2. Consequences of sEH deletion on vaso-obliteration.
Immunostaining of endothelial cells (isolectin B4) and quantification of the vaso-obliterated area in retinas from WT and sEH–/– (–/–) mice after exposure to hyperoxia for 1 or 5 days (P8 and P12, respectively). Yellow lines indicate the border of the vaso-obliterated region. Scale bars: 500 μm. n = 8 for P8 and n = 6 for P12.
Figure 3
Figure 3. Consequences of sEH deletion on the astrocyte network.
(A) Immunostaining of astrocytes (GFAP, red) and endothelial cells (isolectin B4, green) in P8 retinas from WT and sEH–/– (–/–) mice after exposure to hyperoxia for 1 day and quantification of GFAP intensity throughout the retina. The numbers 0 and 8 represent the optical nerve and retinal boundary, respectively. Scale bar: 500 μm. n = 8 animals/group (2-way ANOVA and Sidak’s multiple comparisons test). (B) Astrocytes (GFAP, red) and endothelial cells (isolectin B4, green) in retinas from WT and sEH–/– mice on P14. Yellow lines highlight the border of avascular region. Arrows indicate peripheral neovascularization. Scale bar: 500 μm. The lower panels are higher-magnification images in the peripheral and central regions in retinas indicated by the boxes. Scale bar: 100 μm. n = 6 animals/group with 8 areas of interest analyzed per retina (2-way ANOVA and Sidak’s multiple comparisons test). **P < 0.01 and ***P < 0.001.
Figure 4
Figure 4. Link between sEH and astrocyte apoptosis.
(A) Annexin V (magenta) and GFAP (blue) in retinal whole mounts from WT and sEH–/– animals exposed to hyperoxia for 24 hours. Scale bars: 50 μm. Arrowheads indicate annexin V+/GFAP+ cells. n = 6 animals/group. (B) Annexin V+/GFAP+ cells in retinal digests from WT or sEH–/– mice maintained under normoxic conditions or exposed to hyperoxia for 24 hours. n = 5 animals/group (2-way ANOVA and Sidak’s multiple comparisons test). Ctl, control. (C) sEH (red) and GFAP (green) expression in cultured primary retinal astrocytes. Scale bar: 50 μm. n = 4 different cell batches. (D) Effect of sEH deletion on primary astrocytes cultured under normoxic (21% O2) or exposed to hyperoxia (75% O2). n = 4 different cell batches (2-way ANOVA and Sidak’s multiple comparisons test). (E) Caspase 3/7 activity in astrocytes under normoxic and hyperoxic conditions. n = 5 different cell batches (2-way ANOVA and Sidak’s multiple comparisons test). *P < 0.05 and ***P < 0.001.
Figure 5
Figure 5. Phenotypes in astrocyte-specific sEH knockout mice.
(A) Astrocytes (GFAP, red) and endothelial cells (isolectin B4, green) in retinas from WT and sEHΔAC littermates after exposure to 75% O2 for 24 hours. Scale bars: 500 μm in the whole mounts and 100 μm for the enlarged images. n = 7 animals/group (ANOVA with Bonferroni’s post test). (B) Quantification of vaso-obliteration and GFAP+ area in retinas after exposure to 75% O2 for 24 hours (Student’s t test). (C) Isolectin B4 staining in retinas from WT and sEHΔAC littermates with ROP on P17. Red lines indicate the avascular area. Scale bars: 500 μm in the whole mounts and 100 μm for the enlarged images. (D) Quantification of the avascular zone and neovascularization on P17. n = 7 animals/group (Student’s t test). *P < 0.05.
Figure 6
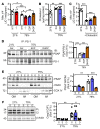
Figure 6. Consequences of hyperoxia on sEH activity.
(A) Fatty acid epoxide and diol levels in retinas from WT and sEH–/– mice exposed to normoxia (21% O2) or hyperoxia (75% O2) for 24 hours starting on P7. n = 5 samples per group and each sample represents a pool of 6 retinas (2-way ANOVA with Tukey’s multiple comparisons test). 17,18-EEQ, 17,18-epoxy eicosatetraenoic acid; 17,18-DHEQ, 17,18-dihydroxy-eicosatetraenoic acid. (B) Immunoblot showing sEH and Cyp2c44 expression in retinas from WT mice after exposure to normoxia or hyperoxia from P7 for 24 hours. Comparable results were observed in 3 additional mice per group. (C) sEH activity in retinas from WT mice after exposure to normoxia or hyperoxia from P7 for 24 hours. n = 6 samples/group (Student’s t test). (D) Tyrosine nitration of sEH in sEH-cMyc expressing-HEK-293 cells exposed to 21% O2 or 75% O2 for 24 hours. n = 6 independent experiments (Student’s t test). (E) sEH activity in sEH expressing HEK-293 cells after exposure to 21% O2 or 75% O2 for 24 hours. n = 6 independent experiments (Student’s t test). (F) Tyrosine nitration of sEH immunoprecipitated from retinas of WT mice after exposure to normoxia or hyperoxia for 24 hours. n = 6 animals/group (Student’s t test). (G) iNOS expression in retinas from WT mice after exposure to normoxia or hyperoxia for 24 hours. n = 6 animals/group (Student’s t test). *P < 0.05, **P < 0.01, and ***P < 0.001. IB, immunoblot.
Figure 7
Figure 7. Effect of the sEH substrate 19,20-EDP and product 19,20-DHDP on astrocyte apoptosis.
(A) sEH–/– mice were treated with a bolus of solvent (Sol) (1% DMSO), EDP/DHDP (50 pmol), or DAPT (100 pmol) via intravitreal injection on P7 and exposed to hyperoxia for 24 hours. GFAP (red) and isolectin B4 (IB4, green) staining in retina whole mounts. Yellow lines highlight the vaso-obliterated zones in the central region of retinas. (B) Quantification of the vaso-obliterated areas in sEH–/– animals exposed to hyperoxia. (C) Quantification GFAP intensity throughout the sEH–/– retina. The numbers 0 and 8 represent the optical nerve and retinal boundary, respectively (2-way ANOVA and Tukey’s multiple comparisons test). (D) Quantification of annexin V+/GFAP+ cells. (E) WT mice were treated with an intravitreal bolus of solvent (1% DMSO) or DHDP (50 pmol) on P7 and exposed to hyperoxia for 24 hours. Retina whole mounts were stained with isolectin B4 (green) and GFAP (red). Yellow lines highlight the vaso-obliterated zones in the central region of retinas. (F) Quantification of the vaso-obliterated areas in WT animals exposed to hyperoxia. (G) Quantification GFAP intensity throughout the WT retina. (1-way ANOVA and Tukey’s multiple comparisons test). n = 5 animals/group in AD and n = 8–9 per group EG. Scale bars: 500 μm. *P < 0.05, **P < 0.01, and ***P < 0.001.
Figure 8
Figure 8. Effect of 19,20-DHDP on mitochondria.
(A) Astrocytes from WT and sEH–/– (–/–) mice were cultured in 21% or 75% O2 for 24 hours in the presence of solvent, 19,20-EDP, or 19,20-DHDP (3 μM). Mitochondrial membrane potential (Mito ΔΨ) was assessed by JC-1 staining. n = 5–9 independent isolations (1-way ANOVA and Tukey’s multiple comparisons test). (B) Cholesterol levels in isolated mitochondria from HEK-293 cells treated with solvent or 19,20-EDP/DHDP (3 μM) and exposed to 21% or 75% O2 for 24 hours. n = 8 isolations (1-way ANOVA and Tukey’s multiple comparisons test). (C) Membrane potential in isolated mitochondria after treatment with cholesterol in the absence and presence of EDP/DHDP (10 nM). n = 6–13 independent isolations/group (1-way ANOVA and Tukey’s multiple comparisons test). (D) Immunoblot showing the association of PSAP with PS-1 immunoprecipitated from astrocytes treated with solvent or 19,20-EDP/DHDP (3 μM) and exposed to 21% or 75% O2 for 24 hours. n = 4 different cell batches (1-way ANOVA and Tukey’s multiple comparisons test). (E) PSAP localization in the outer (OM) and inner (IM) mitochondrial membrane from HEK-293 cells exposed to 21% or 75% O2 for 24 hours in the presence of solvent (S), 19,20-EDP (E) (3 μM) or 19,20-DHDP (D) (3 μM). n = 4 independent isolations (2-way ANOVA and Tukey’s multiple comparisons test). (F) Full-length (FL) and cleaved (Cl) caspase 3 (Casp3) in cultured retinal astrocytes exposed to 21% or 75% O2 for 24 hours in the presence of solvent or 19,20-EDP/DHDP (3 μM), n = 6 independent isolations (2-way ANOVA and Tukey’s multiple comparisons test). *P < 0.05, **P < 0.01, and ***P < 0.001.
Figure 9
Figure 9. Link between PS-1-PARP1 and mtDNA damage.
(A) Immunoblot and densitometric analysis of PSAP and PS-1 following PS-1 immunoprecipitation from retinas of WT and sEH–/– (–/–) mice exposed to hyperoxia (75% O2) for 24 hours. n = 6 mice/group. (B) Cleaved caspase 3 (red), GFAP (green), and DAPI (blue) in cross sections from WT or sEH–/– retinas after exposure to hyperoxia for 24 hours. n = 6 mice/group. Scale bars: 50 μm. The arrows indicate GFAP+ cleaved caspase 3+ cells. (C) Immunoblot and densitometric analysis of PSAP and PS-1 following immunoprecipitation of PS-1 in astrocytes exposed to hyperoxia for 24 hours. n = 6 independent cell isolations. (D) Immunoblot of PARP1 in retinas from WT and sEH–/– mice. n = 6 mice/group. (E) mtDNA damage in retinas from WT and sEH–/– mice. n = 6–7 mice/group. (F) Immunoblot of PARP1 in astrocytes cultured in the presence of 21% O2 or 75% O2 for 24 hours in the presence of solvent (0.1% DMSO), 19,20-EDP (3 μM), or 19,20-DHDP (3 μM). (G) Fold enrichment of the D-Loop and ND-2 domains of mtDNA bound to the cleaved PARP1 in astrocytes exposed to 21% or 75% O2 for 24 hours. Cells were treated with solvent or EDP/DHDP (3 μM). n = 3 independent cell batches, each in duplicate. (H) mtDNA damage in astrocytes exposed to 21% or 75% O2 for 24 hours in the presence of solvent or EDP/DHDP (3 μM). n = 4 independent cell batches. (AC) Student’s t test. (DH) Two-way ANOVA with Tukey’s multiple comparisons test. *P < 0.05, **P < 0.01, and ***P < 0.001.
Figure 10
Figure 10. 19,20-DHDP prevents neovascularization in ROP.
WT and sEH–/– mice were treated with an intravitreal bolus of solvent (1% DMSO), 19,20-EDP (50 pmol), or 19,20-DHDP (50 pmol) on P7 and exposed to hyperoxia for 24 hours. (A) Immunoblot showing PARP1 and caspase cleavage in retinas at P8. n = 4 animals/group (B) mtDNA damage was quantified in retinas isolated on P8. n = 5 animals/group. (C) sEH–/– mice were treated with solvent or 19,20-EDP/DHDP (50 pmol) on P7 before being exposed to hyperoxia. Isolectin B4 staining (green) was performed on retinal whole mounts at P17. n = 7 animals/group. (D) sEH–/– mice were exposed to hyperoxia for 5 days and then treated with solvent or 19,20-EDP/DHDP (50 pmol) on P12. Isolectin B4 staining (green) was performed on retinal whole mounts on P17. n = 7 animals/group. Scale bars: 500 μm. Red lines highlight the border of the avascular regions. Arrows indicate peripheral neovascularization. *P < 0.05, **P < 0.01, and ***P < 0.001 (2-way ANOVA and Tukey’s multiple comparisons test for A and B and 1-way ANOVA with Bonferroni’s multiple comparisons test for C and D).

References

    1. Rivera JC, et al. Retinopathy of prematurity: inflammation, choroidal degeneration, and novel promising therapeutic strategies. J Neuroinflammation. 2017;14(1):165. doi: 10.1186/s12974-017-0943-1. - DOI - PMC - PubMed
    1. Sternberg P, Durrani AK. Evolving concepts in the management of retinopathy of prematurity. Am J Ophthalmol. 2018;186:xxiii–xxxii. doi: 10.1016/j.ajo.2017.10.027. - DOI - PubMed
    1. Chan-Ling T, Gole GA, Quinn GE, Adamson SJ, Darlow BA. Pathophysiology, screening and treatment of ROP: a multi-disciplinary perspective. Prog Retin Eye Res. 2018;62:77–119. doi: 10.1016/j.preteyeres.2017.09.002. - DOI - PubMed
    1. Lapillonne A, Moltu SJ. Long-chain polyunsaturated fatty acids and clinical outcomes of preterm infants. Ann Nutr Metab. 2016;69(suppl 1):35–44. - PubMed
    1. Arterburn LM, Hall EB, Oken H. Distribution, interconversion, and dose response of n-3 fatty acids in humans. Am J Clin Nutr. 2006;83(6 suppl):1467S–1476S. - PubMed

Publication types

MeSH terms