. 2019 Dec 2;129(12):5108-5122.
doi: 10.1172/JCI126350.

Chimeric antigen receptor-induced BCL11B suppression propagates NK-like cell development

Affiliations

Chimeric antigen receptor-induced BCL11B suppression propagates NK-like cell development

Marcel Maluski et al. J Clin Invest. .

Abstract

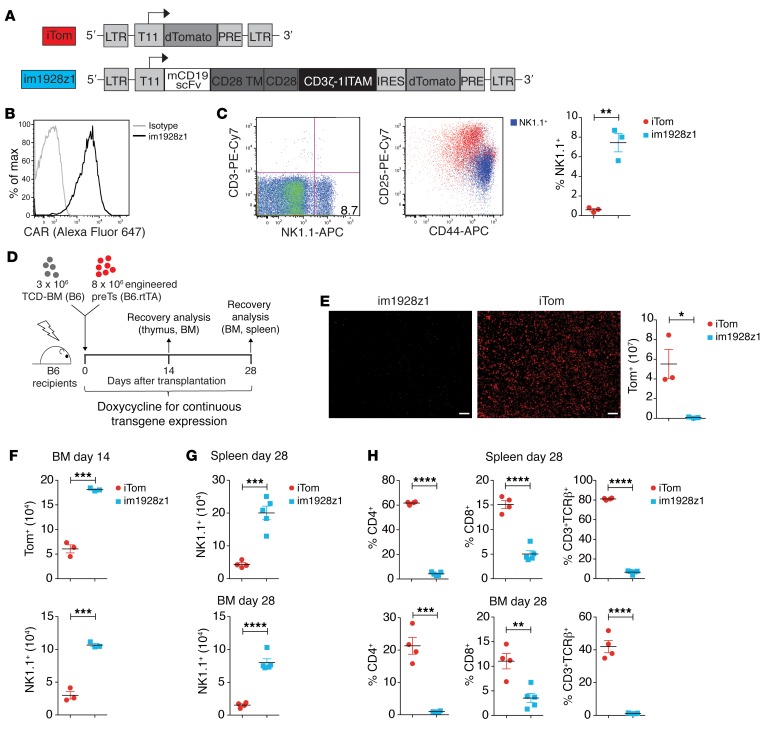
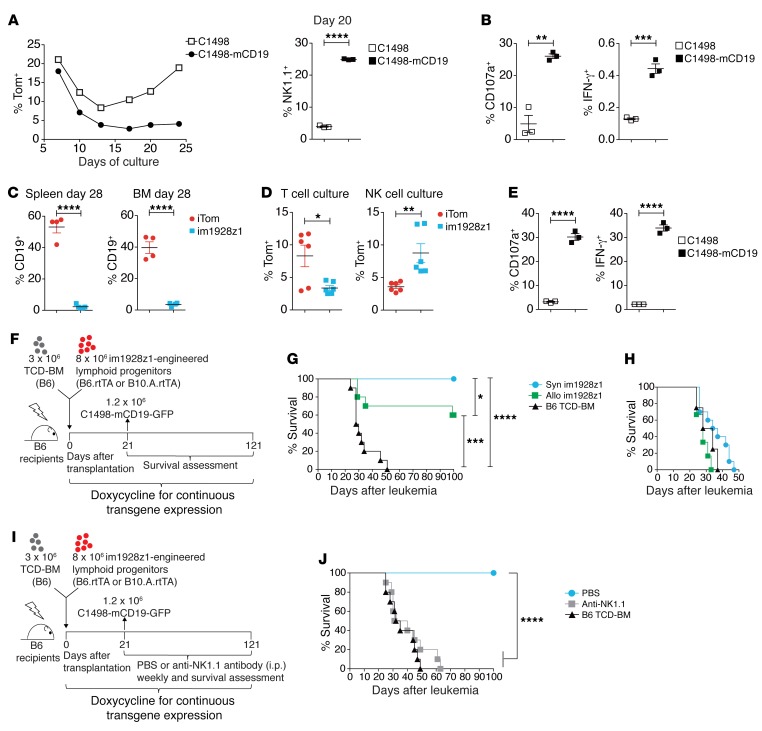
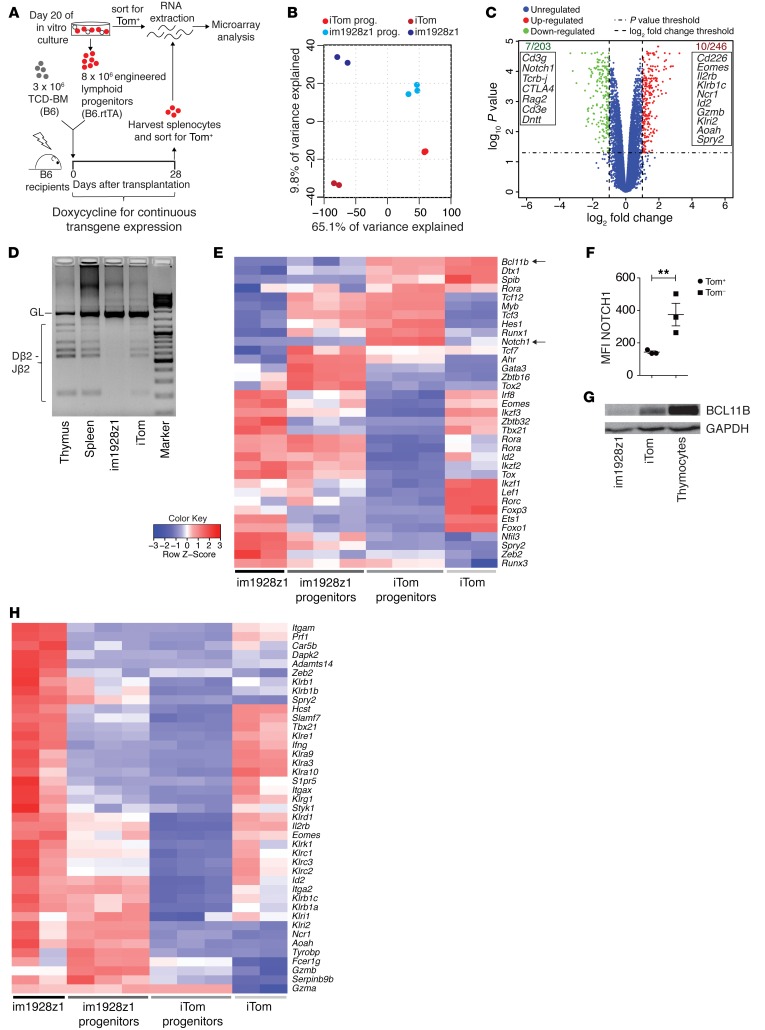
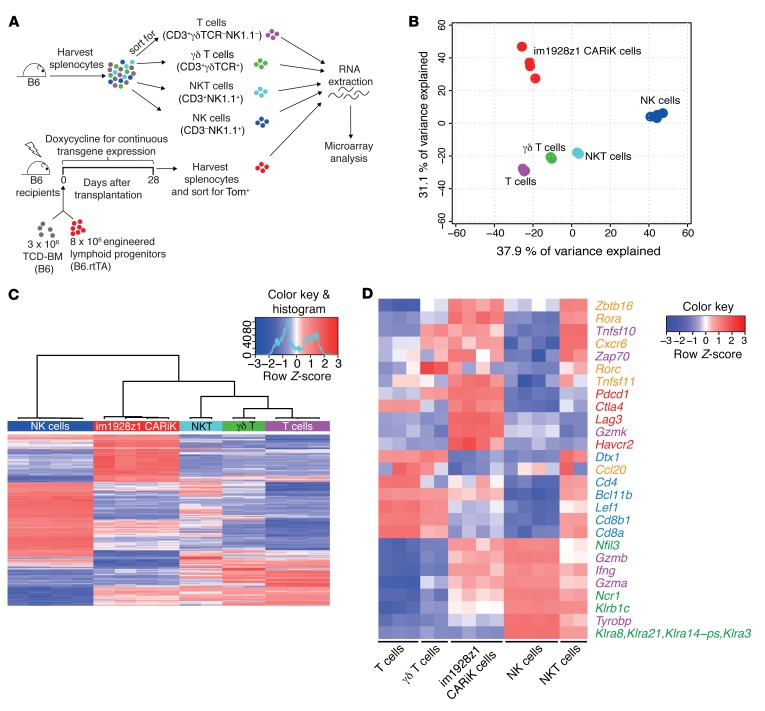
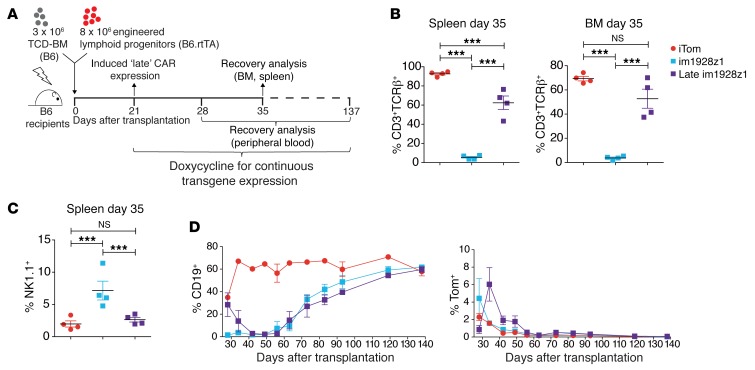
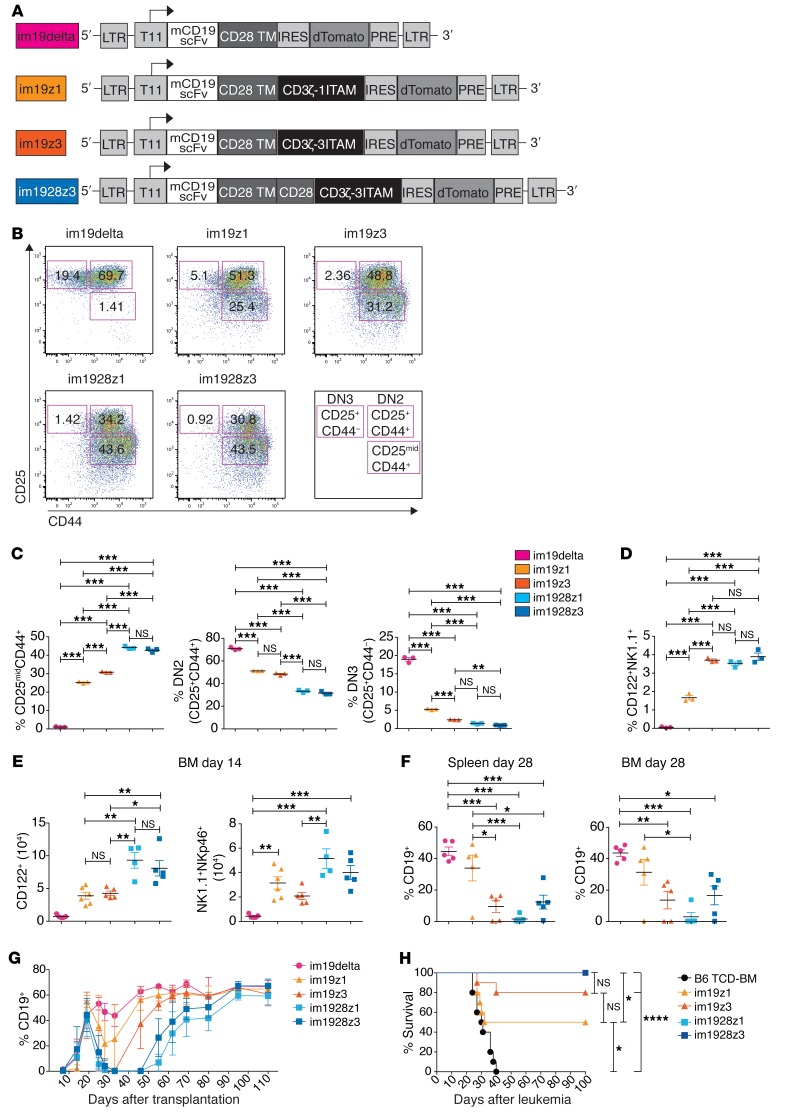
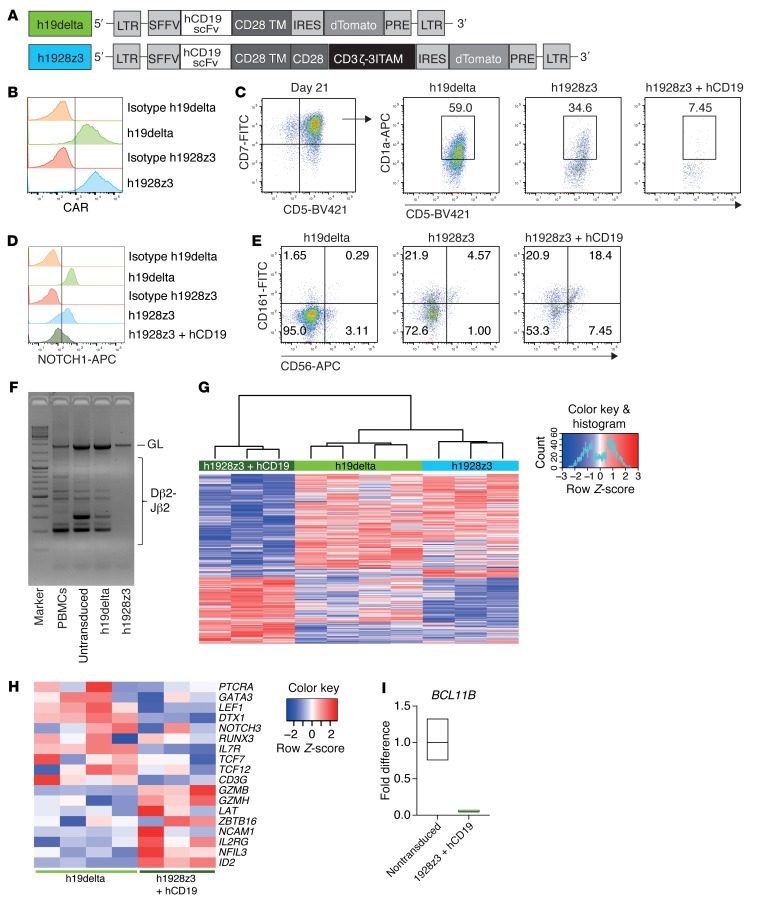
The transcription factor B cell CLL/lymphoma 11B (BCL11B) is indispensable for T lineage development of lymphoid progenitors. Here, we show that chimeric antigen receptor (CAR) expression during early phases of ex vivo generation of lymphoid progenitors suppressed BCL11B, leading to suppression of T cell-associated gene expression and acquisition of NK cell-like properties. Upon adoptive transfer into hematopoietic stem cell transplant recipients, CAR-expressing lymphoid progenitors differentiated into CAR-induced killer (CARiK) cells that mediated potent antigen-directed antileukemic activity even across MHC barriers. CD28 and active immunoreceptor tyrosine-based activation motifs were critical for a functional CARiK phenotype. These results give important insights into differentiation of murine and human lymphoid progenitors driven by synthetic CAR transgene expression and encourage further evaluation of ex vivo-generated CARiK cells for targeted immunotherapy.

Keywords: Immunology; Immunotherapy; Leukemias; T cell development; Transplantation.


Conflict of interest statement

Conflict of interest: MRMVDB has intellectual property licensing with Seres Therapeutics and Juno Therapeutics. MRMVDB has also received honorariums from Flagship Ventures, Novartis, Evelo, Seres Therapeutics, Jazz Pharmaceuticals, Therakos, Amgen, Merck, the Acute Leukemia Forum, and DKMS (board member) and research support from Seres Therapeutics, from which he has stock options. AG has received research support from Aprea Therapeutics and Infinity Pharmaceuticals.

Figures

Figure 1
Figure 1. im1928z1-CAR expression in HSPCs cells prevents T cell, but favors NK-like cell development of lymphoid progenitors in vitro and in vivo.
(A) The lentiviral control and the murine CD19 CAR construct: iTom (inducible dTomato reporter gene only) and im1928z1 (inducible murine CD19 CAR, CD28 costimulation, 1 functional ITAM containing CD3ζ domain) linked to an IRES dTomato cassette. LTR, long terminal repeats; T11, Dox-inducible promotor; scFv, single chain variable fragment; TM, transmembrane domain; IRES, internal ribosome entry site; PRE, woodchuck hepatitis virus posttranscriptional regulatory element. (B) Representative data showing im1928z1 expression on in vitro–generated lymphoid progenitors. (C) Representative FACS plots of NK1.1 and CD3 expression on in vitro–generated im1928z1-engineered lymphoid progenitors (left), NK1.1+ population within CD25+CD44+ lymphoid progenitors (middle), and NK1.1+ expression on iTom and im1928z1-transduced lymphoid progenitors before cotransplantation (right) (n = 3 independent cultures were pooled). (D) Irradiated B6 recipients were reconstituted with 3 × 10⁶ B6 TCD-BM and cotransplanted with either 8 × 10⁶ im1928z1-engineered lymphoid progenitors or iTom‑engineered lymphoid progenitors. (E) Thymic sections were imaged for Tom+ cells. Scale bars: 50 μm; Original magnification, × 20. Single cells from harvested thymi were analyzed by FACS for Tom+ progeny of cotransplanted lymphoid progenitors (n = 3 mice, respectively). (F) Lymphoid progenitor–derived progeny in the BM on day 14 (top). Numbers of NK1.1+ cells within the Tom+ population are depicted (bottom) (n = 3 mice per group). (G) Numbers of NK1.1+ and (H) frequencies of CD4+, CD8+, and CD3+TCRβ+ progeny within the Tom+ gate in BM and spleens on day 28 (im1928z1, n = 5; iTom, n = 4). Results from 1 of 2 independent experiments are shown. Statistics was performed using Student’s t test (2 tailed). Data are shown as mean ± SEM. *P < 0.05; **P < 0.01; ***P < 0.001; ****P < 0.0001.
Figure 2
Figure 2. CARiK cells derived from im1928z1-engineered lymphoid progenitors demonstrate potent antileukemic activity across MHC barriers in vivo.
(A) Generation of either stimulated or nonstimulated im1928z1‑generated lymphoid progenitors. Frequencies of Tom+ progenitors (left) and NK1.1+ im1928z1-CARiK cells on day 20 of culture (right). (B) Responses of im1928z1-generated lymphoid progenitors upon stimulation were quantified via CD107a degranulation (left) or IFN-γ production (right). Data from 1 of 2 experiments are shown. (C) CD19+ B cell recovery of irradiated B6 recipients of B6 TCD-BM and either im1928z1-engineered progenitors or iTom controls (n = 4 mice, respectively). (D) Splenocytes were harvested on day 28 and recultured ex vivo under T cell or NK cell culture conditions (n = 6; left). (E) CD107a+ degranulation (middle) and IFN-γ (right) responses to antigen were assessed (n = 3). (AE) Student’s t test was used for analysis. Data represent mean ± SEM. (F and G) B6 recipients of 3 × 10⁶ B6 TCD-BM (n = 10/group) with or without 8 × 10⁶ syngeneic (syn) or MHC class I and II mismatched (allo) im1928z1-expressing progenitors received 1.2 × 10⁶ C1498-mCD19 cells on day 21 after transplantation and were monitored for survival. Results from 1 of 2 independent experiments are graphed. (H) Survivors were rechallenged with 1.2 × 10⁶ C1498-mCD19 cells on day 100 and reassessed for survival. TCD-BM–only recipients (n = 4) were added for control. (I and J) B6 recipients of 3 × 10⁶ B6 TCD-BM with or without 8 × 10⁶ syngeneic im1928z1-engineered lymphoid progenitors were treated with weekly i.p. injections of an anti-NK1.1 antibody (clone: PK136; 200 μg/dose). PBS was used for control (n = 10 per group). All mice were challenged with 1.2 × 10⁶ C1498-mCD19 cells on day 21 after transplantation (J). Survival curves were compared using Mantel-Cox (log-rank) test. *P < 0.05; **P < 0.01; ***P < 0.001; ****P < 0.0001.
Figure 3
Figure 3. im1928z1 expression on HSPCs leads to BCL11B suppression, allowing for CARiK cell development, and concomitantly decreases T cell–associated gene expression.
(A) For microarray data analysis, RNA from Tom+-sorted im1928z1-generated lymphoid progenitors (n = 3) or iTom‑engineered lymphoid progenitors (n = 3) immediately previous to cotransplantation or from spleen-derived progeny (n = 2, respectively) were isolated on day 28 after transplantation. (B) PCA of total transcriptome profiles from either engineered lymphoid progenitors or their respective progeny is graphed. (C) Volcano plot for comparison of differently regulated transcripts in im1928z1-generated lymphoid progenitors and iTom controls. Gene symbols in the boxes indicate selected transcripts found to be downregulated (green) or upregulated (red) at least 2-fold (P < 0.05) in im1928z1-generated lymphoid progenitors as compared with controls. (D) Recombination of D and J regions of the TCRβ locus in engineered lymphoid progenitors. Genomic DNA of engineered progenitors was isolated on day 20 of culture, and rearrangements were detected by PCR. Splenocytes and thymocytes from WT B6 mice were used as controls. Results from 1 of 2 independent experiments are shown. GL, germ line band. (E) Heatmap showing the relative expression of transcripts for selected TFs. Data are normalized according to expression in each row. (F) NOTCH1 expression on transgene-positive (Tom+) or transgene-negative (Tom) lymphoid progenitors engineered with im1928z1. Student’s t test was used. Data represent mean ± SEM. **P < 0.01. (G) Western blot analysis for BCL11B in lysates from iTom lymphoid progenitors, im1928z1-generated lymphoid progenitors, or B6 WT thymocytes. Representative data from 1 of 2 independent experiments are shown. (H) Relative expression of selected transcripts for NK cell receptors, integrins, adaptors, effector molecules, and TFs in engineered lymphoid progenitors and their progeny. Data are normalized according to expression in each row.
Figure 4
Figure 4. Transcriptional profile analysis locates CARiK cells at the interface of T lymphocytes and NK cells.
(A) Schematic representation of the experimental setup for transcriptional comparison of CARiK cells and different lymphoid cell populations. Splenocytes of 12-week-old WT B6 mice were harvested and sorted for T cells (CD3+γδTCRNK1.1; n = 3), NKT cells (CD3+NK1.1+; n = 2), γδ T cells (CD3+γδTCR+; n = 2), and NK cells (CD3NK1.1+; n = 4). Tom+ CARiK cells (n = 4) were harvested from recipients on day 28 and consecutively sorted. Extracted RNA samples from all lymphoid subsets were compared by microarray analysis. Experiment was performed once. (B) PCA analysis of transcriptional profiles derived from the sorted lymphoid cell populations. (C) Hierarchical clustering of the 500 most differentially expressed (adjusted P < 0.05) transcripts across CARiK cells and respective lymphoid lineages. (D) Selected transcripts expressed by lymphoid subsets were color coded according to function or lymphoid cell type. Orange: γδ T cells, NKT cells, and innate lymphocytes; purple: cytotoxicity mediators; red: inhibitory receptors; blue: T lymphocytes; green: NK cells.
Figure 5
Figure 5. CAR expression early during lymphoid progenitor cell differentiation is required for CARiK cell generation at the expense of T cell development.
(AD) Irradiated B6 recipients received 3 × 10⁶ B6 TCD-BM and either 8 × 10⁶ im1928z1-generated lymphoid progenitors or iTom-generated lymphoid progenitors. CAR expression was either induced early (day 0) or late (day 21) after HSCT. Indicated time points refer to the day after transplantation. (B) Frequencies of CD3+TCRβ+ cells were analyzed within the transgene-positive gate on day 35 in both the BM and spleens. (C) Comparative analysis of NK1.1+ cells in spleens of early versus late im1928z1-generated lymphoid progenitor recipients on day 35 after AT. (B and C) Each analysis was done with n = 4 mice. Gating was done on the Tom+ population. Statistics were performed using 1-way ANOVA with Tukey’s post test. Data represent mean ± SEM. ***P < 0.001. (D) CD19+ B cell recovery (left) and frequencies of Tom+ cells (right) in the PB of transplant recipients after early or late im1928z1 induction (n = 3–4 mice per group and time point). Results from 1 of 2 independent experiments are shown.
Figure 6
Figure 6. CARs containing CD28 costimulatory domain induce killer cells with superior functionality.
(A) Design of the im19delta, im19z1, im19z3, and im1928z3 constructs. All CAR constructs were linked to an IRES dTomato cassette. (B and C) Representative FACS plots (B) and respective CD25midCD44+, DN2 (CD25+CD44+), and DN3 (CD25+CD44) populations (C) of lymphoid progenitors engineered with the indicated CAR construct (color coded as indicated) on day 20 of in vitro culture. (D) Frequencies of CD122+NK1.1+ CARiK cells on day 20 of in vitro culture. Tom+ cells were analyzed. (BD) Data from 1 of 2 independent experiments measured in triplicates are shown. (EG) Irradiated B6 recipients were reconstituted with 3 × 10⁶ B6 TCD-BM and cotransplanted with 8 × 10⁶ lymphoid progenitors that had been engineered with the indicated CAR constructs. (E) BM cells were analyzed for numbers of CD122+ (left) and NK1.1+NKp46+ cells (right) within on day 14. im19delta, im19z3, and im1928z3 (n = 5 mice); im19z1 (n = 6); im1928z1 (n = 4). (F) CD19+ B cells were quantified in BM (left) and spleens (right) on day 28. n = 5 mice for each group. (G) CD19+ B cells in the peripheral blood were determined in 7- to 14-day intervals. Analysis at each time point was done on n = 4–5 mice per group. (CF) Analysis was done using 1-way ANOVA with Tukey’s post test. Data represent mean ± SEM. (H) Irradiated B6 recipients were transplanted with 3 × 10⁶ B6 TCD-BM only (n = 10) or additionally with 8 × 10⁶ CAR-expressing lymphoid progenitors (n = 10). Mice were challenged with 1.2 × 10⁶ C1498-mCD19 cells on day 21 after transplantation and monitored for survival. Survival curves were compared using Mantel-Cox (log-rank) test. *P < 0.05; **P < 0.01; ***P < 0.001; ****P < 0.0001.
Figure 7
Figure 7. CAR-induced developmental shifting from T cell to NK cell–like differentiation translates to humans.
(A) Representation of the lentiviral human CD19 CAR constructs with either CD28 costimulatory and CD3ζ signaling domain (h1928z3) or without signaling domains (h19delta). An IRES dTomato reporter cassette was used. (BF) Human CD34+ CB-derived HSPCs were engineered with respective CAR constructs and consecutively differentiated on OP9-DL1 stromal cells. FACS analyses were performed within the Tom+ gate on day 21 of coculture. For stimulation, h1928z3 lymphoid progenitors were cocultured with irradiated hCD19+ Daudi cells at a 1:10 ratio from day 4 onwards. Results from 1 of 2 experiments are shown. (B) Expression of the CAR constructs on differentiating human HSPCs analyzed by protein L staining. (C) CD7+CD5+ engineered human lymphoid progenitor cells were evaluated for CD5 and CD1a expression. Numbers represent percentages in the respective gates. (D) Histograms represent NOTCH1 expression on engineered early hematopoietic human progenitors. (E) CAR-modified HSPCs were analyzed for CD161 and CD56 expression. (F) Human CAR-engineered lymphoid progenitors were evaluated for TCRB rearrangement by PCR analysis of genomic DNA on day 18 of culture. Human PBMCs and nontransduced and h19delta-modified progenitors were used as controls. (G) Hierarchical clustering of the 500 most differentially expressed (P < 0.05) transcripts across lymphoid progenitors expressing the h1928z3 CAR that had been either stimulated with hCD19 or not; h19delta CAR served as signaling-deficient control. (H) Heatmap showing the relative expression of exemplary transcripts that related to either T cell or NK cell development. Data are normalized according to expression in each row. (G and H) Experiments were performed once. h1928z3, h1928z3 + hCD19 (n = 3); h19delta (n = 4). (I) qPCR analysis of BCL11B expression in nontransduced or h1928z3-expressing progenitors stimulated with hCD19. Data show mean of triplicates and upper and lower limit from 1 experiment performed.

Comment in

References

    1. Morgan RA, et al. Cancer regression in patients after transfer of genetically engineered lymphocytes. Science. 2006;314(5796):126–129. doi: 10.1126/science.1129003. - DOI - PMC - PubMed
    1. Robbins PF, et al. A pilot trial using lymphocytes genetically engineered with an NY-ESO-1-reactive T-cell receptor: long-term follow-up and correlates with response. Clin Cancer Res. 2015;21(5):1019–1027. doi: 10.1158/1078-0432.CCR-14-2708. - DOI - PMC - PubMed
    1. Rapoport AP, et al. NY-ESO-1-specific TCR-engineered T cells mediate sustained antigen-specific antitumor effects in myeloma. Nat Med. 2015;21(8):914–921. doi: 10.1038/nm.3910. - DOI - PMC - PubMed
    1. Maude SL, et al. Chimeric antigen receptor T cells for sustained remissions in leukemia. N Engl J Med. 2014;371(16):1507–1517. doi: 10.1056/NEJMoa1407222. - DOI - PMC - PubMed
    1. Grupp SA, et al. Chimeric antigen receptor-modified T cells for acute lymphoid leukemia. N Engl J Med. 2013;368(16):1509–1518. doi: 10.1056/NEJMoa1215134. - DOI - PMC - PubMed

Publication types

MeSH terms