

Clinical correlation of influenza and respiratory syncytial virus load measured by digital PCR
- PMID: 31479459
- PMCID: PMC6720028
- DOI: 10.1371/journal.pone.0220908
Clinical correlation of influenza and respiratory syncytial virus load measured by digital PCR
Abstract
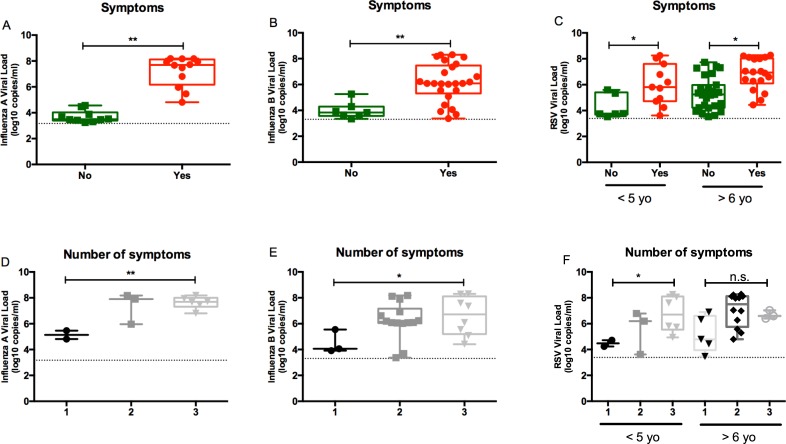
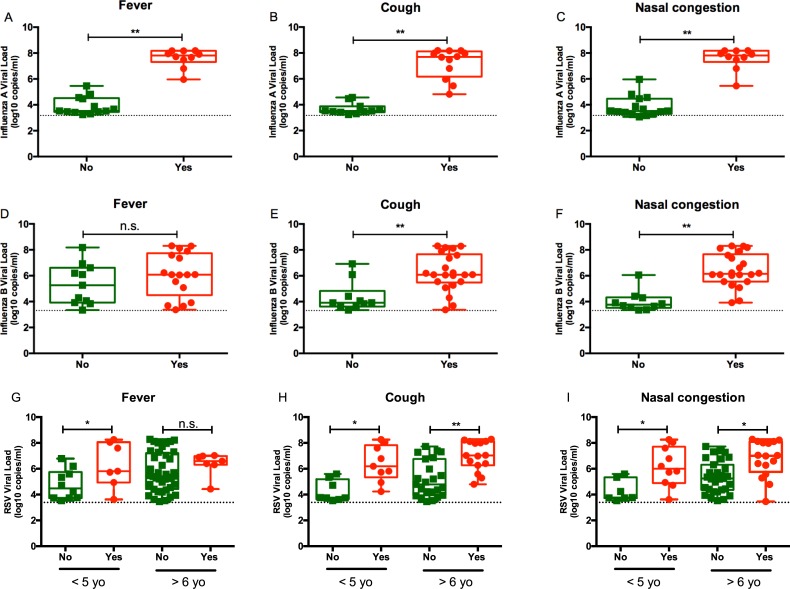
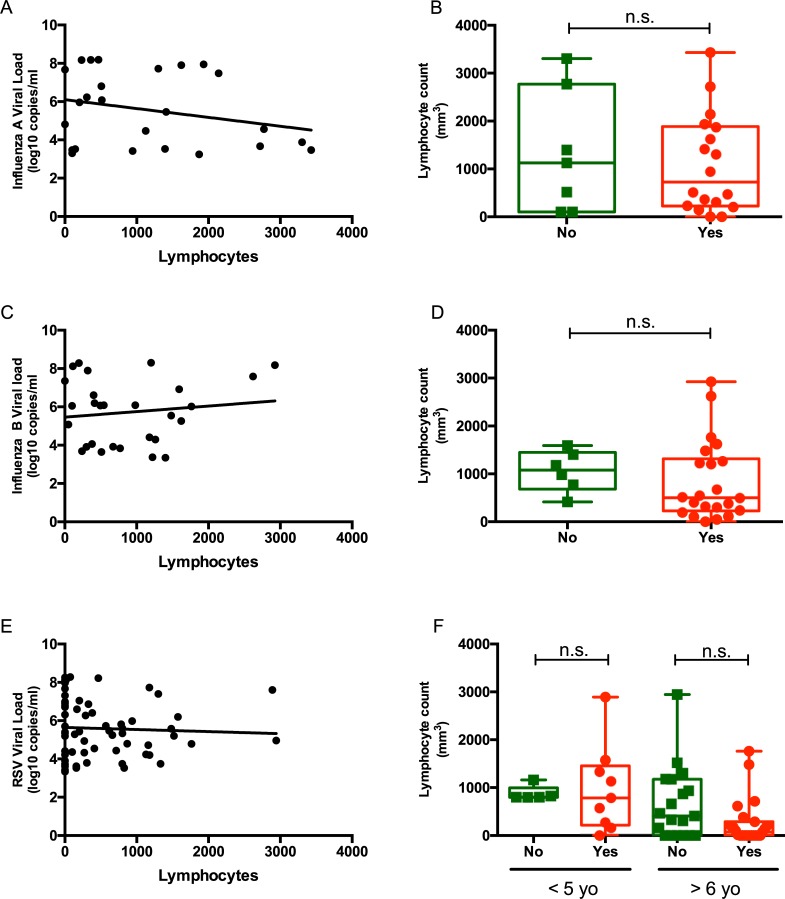
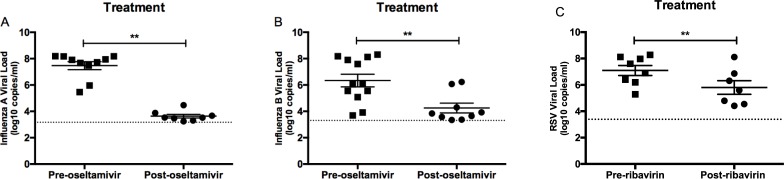
Acute respiratory tract infections are a major cause of respiratory morbidity and mortality in pediatric patients worldwide. However, accurate viral and immunologic markers to predict clinical outcomes of this patient population are still lacking. Droplet digital PCR assays for influenza and respiratory syncytial virus (RSV) were designed and performed in 64 respiratory samples from 23 patients with influenza virus infection and 73 samples from 19 patients with RSV infection. Samples of patients with hematologic malignancies, solid tumors, or sickle cell disease were included. Clinical information from institutional medical records was reviewed to assess disease severity. Samples from patients with fever or respiratory symptoms had a significantly higher viral loads than those from asymptomatic patients. Samples from patients with influenza virus and RSV infection collected at presentation had significantly higher viral loads than those collected from patients after completing a course of oseltamivir or ribavirin, respectively. RSV loads correlated positively with clinical symptoms in patients ≤5 years of age, whereas influenza viral loads were associated with clinical symptoms, irrespective of age. Patients receiving antivirals for influenza and RSV had a significant reduction in viral loads after completing therapy. Digital PCR offers an effective method to monitor the efficacy of antiviral treatment for respiratory tract infections in immunocompromised hosts.
Conflict of interest statement
Randall T. Hayden has served on the advisory boards for Roche Molecular, Abbott Molecular, and Quidel. This does not alter our adherence to PLOS ONE policies on sharing data and materials.
Figures
References
-
- Rudan I, O'Brien KL, Nair H, Liu L, Theodoratou E, Qazi S, et al. Epidemiology and etiology of childhood pneumonia in 2010: estimates of incidence, severe morbidity, mortality, underlying risk factors and causative pathogens for 192 countries. Journal of global health. 2013;3(1):010401 Epub 2013/07/05. 10.7189/jogh.03.010401 - DOI - PMC - PubMed
-
- Guidelines for the use of antiretroviral agents in HIV-1-infected adults and adolescents [accessed 2016 July 2]. Available from: http://aidsinfo.nih.gov/guidelines.
-
- Nair H, Nokes DJ, Gessner BD, Dherani M, Madhi SA, Singleton RJ, et al. Global burden of acute lower respiratory infections due to respiratory syncytial virus in young children: a systematic review and meta-analysis. Lancet (London, England). 2010;375(9725):1545–55. Epub 2010/04/20. 10.1016/s0140-6736(10)60206-1 - DOI - PMC - PubMed
Publication types
MeSH terms
Substances
LinkOut - more resources
Full Text Sources
Medical
