Comment
. 2019 Dec 1;79(23):6010-6023.
doi: 10.1158/0008-5472.CAN-19-0615. Epub 2019 Sep 3.

Integrated Pan-Cancer Map of EBV-Associated Neoplasms Reveals Functional Host-Virus Interactions

Affiliations
Comment

Integrated Pan-Cancer Map of EBV-Associated Neoplasms Reveals Functional Host-Virus Interactions

Srishti Chakravorty et al. Cancer Res. .

Abstract

Epstein-Barr virus (EBV) is a complex oncogenic symbiont. The molecular mechanisms governing EBV carcinogenesis remain elusive and the functional interactions between virus and host cells are incompletely defined. Here we present a comprehensive map of the host cell-pathogen interactome in EBV-associated cancers. We systematically analyzed RNA sequencing from >1,000 patients with 15 different cancer types, comparing virus and host factors of EBV+ to EBV- tissues. EBV preferentially integrated at highly accessible regions of the cancer genome, with significant enrichment in super-enhancer architecture. Twelve EBV transcripts, including LMP1 and LMP2, correlated inversely with EBV reactivation signature. Overexpression of these genes significantly suppressed viral reactivation, consistent with a "virostatic" function. In cancer samples, hundreds of novel frequent missense and nonsense variations in virostatic genes were identified, and variant genes failed to regulate their viral and cellular targets in cancer. For example, one-third of patients with EBV+ NK/T-cell lymphoma carried two novel nonsense variants (Q322X, G342X) of LMP1 and both variant proteins failed to restrict viral reactivation, confirming loss of virostatic function. Host cell transcriptional changes in response to EBV infection classified tumors into two molecular subtypes based on patterns of IFN signature genes and immune checkpoint markers, such as PD-L1 and IDO1. Overall, these findings uncover novel points of interaction between a common oncovirus and the human genome and identify novel regulatory nodes and druggable targets for individualized EBV and cancer-specific therapies. SIGNIFICANCE: This study provides a comprehensive map of the host cell-pathogen interactome in EBV+ malignancies.See related commentary by Mbulaiteye and Prokunina-Olsson, p. 5917.


Figures

Figure 1.
Figure 1.. EBV is integrated at limited loci across multiple tissues and a subset of its genes are preferentially expressed in cancer.
A, schematic showing pipeline for generation and analysis of EBV-host interaction map. B, EBV RNA load (dotplot, top) and the percentage of samples (heatmap, bottom) with P.P.M. ≥20 across multiple cancers (shown are mean and min-to-max range). C, Circos plot showing integration of EBV genes (black bar) into human DNA (human chromosomes shown in gray). Connecting lines are color-coded to differentiate lymphoblastoid cell lines (LCL; blue) and cancer (red) samples; nearest human genes to the site of integration are annotated. D, expression distribution of all expressed human transcripts adjacent to EBV integration sites across all EBV+ samples (median is shown; two-tailed Wilcoxon test). E, enrichment odds ratios and p-values (Fisher exact test) for super-enhancer (SE) regulation of genes that are preferred sites for EBV integration. Shown are data from multiple healthy tissue/cell types assessed or EBV+ cancer cells (data from (31,34,65)). F, expression of EBV genes (columns) across multiple cancers and LCL samples (rows) (below) with bar-chart (above) showing the log fold-change between the mean gene expression in cancer versus LCLs. AITL, angioimmunoblastic T cell lymphoma; eBL, endemic Burkitt’s lymphoma; sBL, sporadic Burkitt’s lymphoma; DLBCL, diffuse large B cell lymphoma; NKTCL, NKT cell lymphoma; NPC, nasopharyngeal carcinoma; STAD, stomach adenocarcinoma. ****p<0.0001
Figure 2.
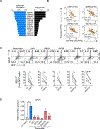
Figure 2.. A subset of EBV genes are negatively correlated with EBV RNA load in 57 LCLs.
A-B, inverse correlation between expression of 12 EBV gene transcripts and EBV RNA load in 57 LCLs. Shown are Spearman’s rank correlation coefficients (A, left) and p-values (A, right) and representative scatter plots for LMP1, LMP2A, LMP2B and BALF5 (B). C, immediate early viral lytic gene expression (BZLF1) in LCL-358 transfected with empty vector or vectors encoding five representative virostatic genes. Shown are representative flow cytometry plots (top) and cumulative data showing % BZLF1+ of transfected (GFP+) LCLs with the indicated over-expression plasmids (bottom). Data are from n ≥ 4 independent experiments; gating strategy is shown in Fig. S2A. D, expression of BRLF1 mRNA, another immediate early viral lytic gene, in LCLs transfected with empty vector (EV) or vectors encoding indicated genes. Bars show mean + sd from n=3 independent experiments; comparisons were against EV treated with doxorubicin. p-values are from two-tailed ratio paired t-test; *p<0.05, **p<0.01, ***p<0.001.
Figure 3.
Figure 3.. Virostatic EBV genes have frequent variations in cancer and affect expression of host genes.
A, bar heatmaps showing EBV genes correlated with increased viral RNA load (first bar; grey coded), samples in which missense or nonsense variation in EBV genes is associated with elevated viral RNA load (second bar; brown coded) and expression of EBV genes in cancer (third bar; orange coded). Table matrix below shows missense (red) or nonsense (blue) variations in all EBV genes (column) across all cancer samples (row) ordered by frequency. B, geneset enrichment analysis (GSEA) plot for EBV genes associated with 12 identified protein-coding virostatic genes, comparing EBV genes with frequent or infrequent variations in cancer. Normalized Enrichment Score (NES) is shown. C, representative example of EBV RNA load in EBV+ cancer samples of any origin with (Var) or without (WT) missense or nonsense variants in LMP1, LMP2A, LMP2B and BALF5. Shown are individual samples (dots) with median values. D and E GSEA plots for host genes up- (left) and down-regulated (right) by LMP2A (GSE46143) comparing LMP2AWT versus LMP2Avariant NKTCL (D) or STAD (E) samples. ****p<0.0001 (two-tailed Wilcoxon test).
Figure 4.
Figure 4.. LMP1 variants affect virostatic function.
A, representative flow cytometry plots (left) and cumulative data (right) from n=5 independent experiments showing LMP1 and GFP expression in LCLs cultured with doxorubicin (dox) or carrier alone (DMSO) after transfection with the indicated plasmids. B, representative flow cytometry plots (left) and cumulative data (right) from n=5 independent experiments showing % BZLF1+ of all live transfected (GFP+) LCL-358 with the indicated over-expression plasmids. C, representative immunoblot from n=2 independent experiments showing BZLF1 expression following transfection of LCL-358 cells with the wild-type or mutant LMP1. D, EBV RNA load in NKTCL samples with or without missense/nonsense variations in the LMP1 gene. EV, empty vector; bars show mean + sem. *p < 0.05 by paired ratio t-test (A, and B) and unpaired two-tailed t-test (D).
Figure 5.
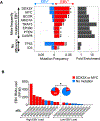
Figure 5.. EBV is associated with pathogenic mutations in cancer driver genes.
A, mutation frequency (left) and fold enrichment (right) of cancer driver genes in EBV+ (red) versus EBV (blue) cancers. B, EBV RNA load across all eBL cancer samples. Samples with DDX3X or MYC mutations are highlighted in red. Pie chart shows frequency of DDX3X or MYC mutations in samples with high and low EBV RNA loads. *p<0.05; **p<0.01 (Fisher Exact test).
Figure 6.
Figure 6.. EBV drives shared and cancer-specific gene networks in host cells to dichotomously classify tumors.
A, biological pathways significantly enriched in shared EBV response genes (see also Fig. S6A). Nodes indicate individual pathways, grouped by ellipses into functional category. Nodes are colored by fold enrichment and band thickness indicates number of shared response genes between nodes. B-C, Ingenuity Pathway Analysis™ showing top 10 upstream regulators (TFs and cytokines) of EBV-driven response genes (B) and heatmap showing expression of immune checkpoint genes in EBV+ compared to EBV tissues (C) in each cancer type. Columns are hierarchically clustered. Indicated are cancer types sub-classified into IFN+ and IFN groups; D, PD-L1 (left) and IDO1 (right) mRNA in EBV+ and EBV STAD and Burkitt lymphoma (BL, including both sporadic and endemic) samples. E, receiver operator curves (ROC) show performance of PD-L1 and IDO1 mRNA expression to predict EBV+ versus EBV status of samples in BL (left) and STAD (right). Area under the curve (AUC) and p-values are indicated; F, representative flow cytometry plots (left) and cumulative data (right) from n=4 independent experiments showing PD-L1 and IDO1 expression by EBV+ (SNU719) and EBV (SNU1) STAD cancer cell lines with or without IFN-γ treatment; G, representative flow cytometry plots (left) and cumulative data (right) from n=4 independent experiments showing PD-L1 expression in EBV+ and EBV STAD cancer cell lines with or without TPA/NaB-induced EBV reactivation (see also Fig. S6M). Bars are mean ± sem; p-values in D, F-G are two-tailed Wilcoxon test; *p<0.05, **p<0.01, ****p<0.0001.

Comment in

Comment on

References

    1. IARC Working Group. IARC monographs on the evaluation of carcinogenic risks to humans Volume 100B: Biological agents. Lyon, France: IARC : Distributed for the International Agency for Research on Cancer by the Secretariat of the World Health Organization; 2012. p volumes.
    1. Kutok JL, Wang F. Spectrum of Epstein-Barr virus-associated diseases. Annu Rev Pathol 2006;1:375–404 - PubMed
    1. Khan G, Hashim MJ. Global burden of deaths from Epstein-Barr virus attributable malignancies 1990–2010. Infect Agent Cancer 2014;9:38. - PMC - PubMed
    1. Peng RJ, Han BW, Cai QQ, Zuo XY, Xia T, Chen JR, et al. Genomic and transcriptomic landscapes of Epstein-Barr virus in extranodal natural killer T-cell lymphoma. Leukemia 2018 - PMC - PubMed
    1. Abate F, Ambrosio MR, Mundo L, Laginestra MA, Fuligni F, Rossi M, et al. Distinct Viral and Mutational Spectrum of Endemic Burkitt Lymphoma. PLoS Pathog 2015;11:e1005158. - PMC - PubMed

Publication types