. 2019 Sep 3;10(1):3967.
doi: 10.1038/s41467-019-11951-x.

Defects in t6A tRNA modification due to GON7 and YRDC mutations lead to Galloway-Mowat syndrome

Affiliations

Defects in t6A tRNA modification due to GON7 and YRDC mutations lead to Galloway-Mowat syndrome

Christelle Arrondel et al. Nat Commun. .

Abstract

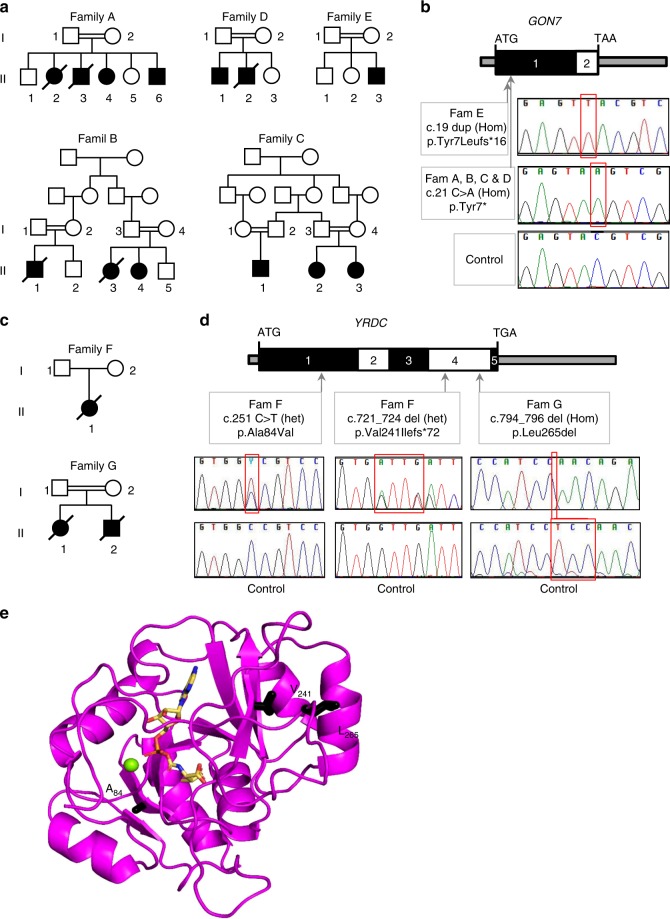
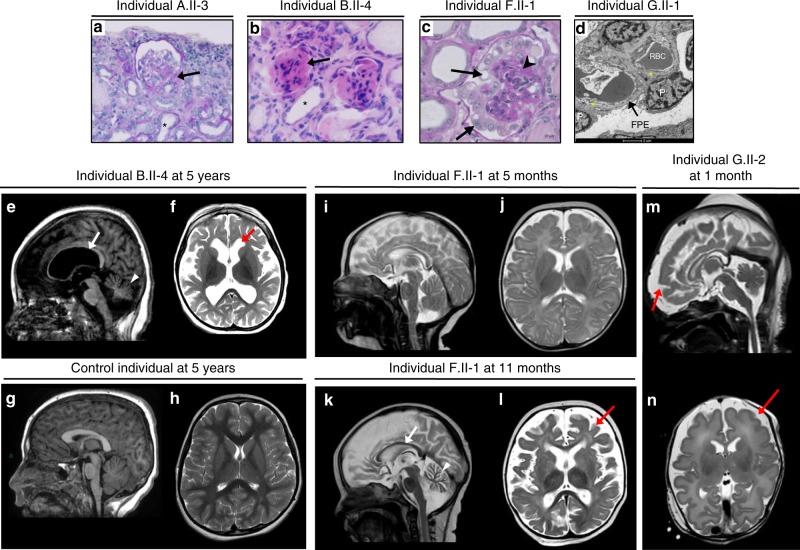
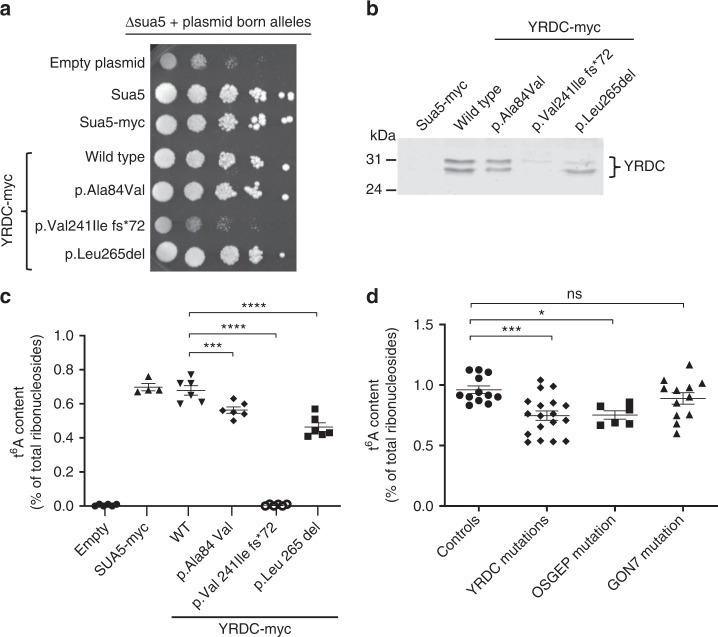
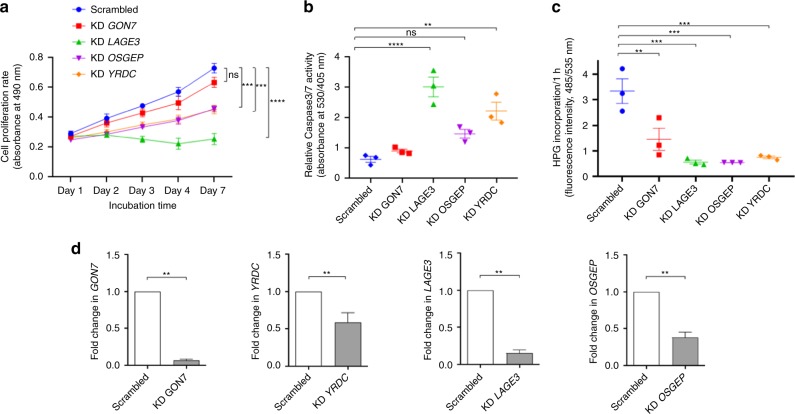
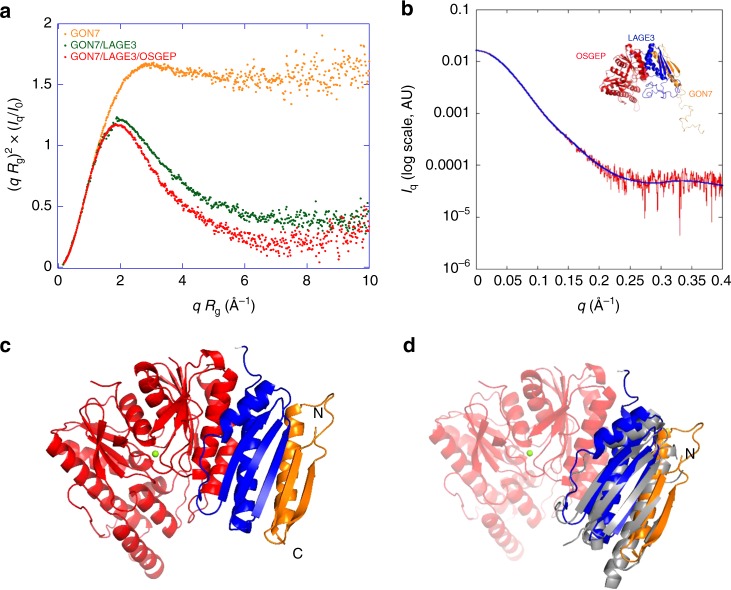
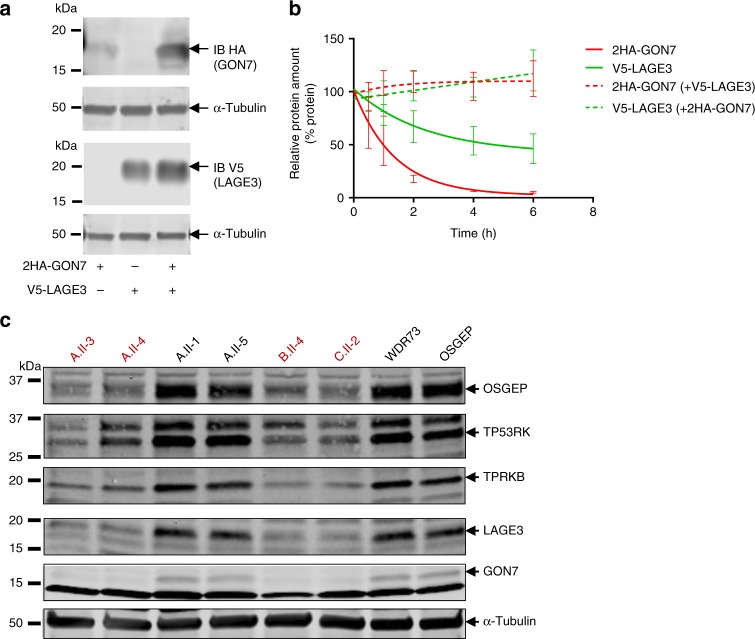
N6-threonyl-carbamoylation of adenosine 37 of ANN-type tRNAs (t6A) is a universal modification essential for translational accuracy and efficiency. The t6A pathway uses two sequentially acting enzymes, YRDC and OSGEP, the latter being a subunit of the multiprotein KEOPS complex. We recently identified mutations in genes encoding four out of the five KEOPS subunits in children with Galloway-Mowat syndrome (GAMOS), a clinically heterogeneous autosomal recessive disease characterized by early-onset steroid-resistant nephrotic syndrome and microcephaly. Here we show that mutations in YRDC cause an extremely severe form of GAMOS whereas mutations in GON7, encoding the fifth KEOPS subunit, lead to a milder form of the disease. The crystal structure of the GON7/LAGE3/OSGEP subcomplex shows that the intrinsically disordered GON7 protein becomes partially structured upon binding to LAGE3. The structure and cellular characterization of GON7 suggest its involvement in the cellular stability and quaternary arrangement of the KEOPS complex.


Conflict of interest statement

F.H. is a cofounder and SAB member of Goldfinch-Bio. The remaining authors declare no competing interests.

Figures

Fig. 1
Fig. 1
Identification of mutations in GON7 and YRDC in patients with Galloway-Mowat syndrome. a, c Pedigrees of families with mutations in GON7 (a) and in YRDC (c). Affected individuals are in black. b, d Organization of exons of human GON7 and YRDC cDNAs. Positions of start and stop codons are indicated. Arrows indicate positions of the identified mutations. Lower panels show the sequencing traces for affected individuals with identified mutated nucleotide indicated with a red square (Hom: homozygous; het, heterozygous). e Representation of a 3D model of human YRDC, bound to the reaction product threonylcarbamoyl-adenylate, in sticks. The model was constructed using the crystal structure of Sulfolobus tokodaii Sua5 (PDB code 4E1B). The side chains of the three mutated residues are in black sticks. The green sphere represents an Mg2+ ion
Fig. 2
Fig. 2
Kidney pathology analysis and neuroimaging. Light and transmission electron microscopy (TEM) of kidney sections of patients with GON7 (a, b) or YRDC mutations (c, d). a Individual A.II-3 displays a retracted glomerulus with a focal segmental glomerulosclerosis lesion at the vascular pole (black arrow) and tubular dilations (black star) (PAS; ×200 magnification). b Individual B.II-4 displays diffuse mesangial sclerosis with tiny, retracted and sclerosed glomeruli (black arrow) with dilated tubes surrounded by flat epithelial cells (black star) and interstitial fibrosis (H&E; ×400 magnification). c Individual F.II-1 displays a marked glomerular tuft collapsing (arrowhead) surrounded by a layer of enlarged and vacuolized podocytes (black arrows) (PAS stain; ×400 magnification, scale bar, 10 µm). d TEM of individual G.II-1 shows diffuse foot process effacement (FPE; black arrow), a classical hallmark of nephrotic syndrome, along a glomerular basement membrane (GBM) with abnormal folded and laminated segments (yellow stars), alternating with others with normal appearance. P podocyte, RBC red blood cell. Scale bar, 2 µm. Brain MRI of patients with GON7 (e, f) and YRDC mutations (in). e, f Brain MRI abnormalities in individual B.II-4 at 5 years. Sagittal T1-weighted image (e) shows important cortical subtentorial atrophy as well as corpus callosal (arrow) and cerebellar atrophy (arrowhead). The axial T2-weighted image (f) shows abnormal myelination and ventricular dilatation (red arrow). g, h Brain MRI of a 5-year old control showing sagittal T1 (g) and axial T2 (h) weighted images. il Brain MRI abnormalities in individual F.II-1 at 5 months (i, j) and 11 months (k, l). Sagittal T2-weighted image shows normal pattern at 5 months (i) evolving to a progressive major cerebellar (arrowhead) and cortical atrophy with a very thin corpus callosum (arrow) at 11 months (k). The axial T2-weighted image is normal at 5 months (j) but shows a very marked abnormality of myelination and cortical atrophy (red arrow) at 11 months (l). m, n Brain MRI abnormalities in individual G.II-2 at 1 month. Sagittal T2 (m) and axial T2 (n) weighted images show gyral anomalies with marked frontal gyral simplification (red arrow) and myelination delay
Fig. 3
Fig. 3
Effects of YRDC and GON7 mutations on t6A biosynthesis. a Evaluation of fitness of Δsua5 yeast strains expressing human YRDC variants (spots are from 10-fold serial dilutions of cell suspensions at OD600nm = 0.5, and three independent clones were evaluated) and b western blot analysis on total protein extracts from Δsua5 yeast cells expressing human YRDC variants using anti-hYRDC antibody. c, d Mass spectrometry (LC-MS/MS) quantification of t6A modification in total tRNAs extracted from Δsua5 yeast cells expressing human YRDC variants (c) (mean ± s.e.m. of two independent LC-MS/MS experiments (technical replicates), each measuring samples from three independent yeast transformants; one-way ANOVA (F (5,28) = 269.4, p < 0.0001), Dunnett’s multiple comparisons test, ***p = 0.0008, ****p < 0.0001) and from cultured primary skin fibroblasts from controls (two unaffected individuals) and affected individuals with either the p.Tyr7* GON7 mutation (two individuals), or the YRDC mutations (three individuals) or with the p.Arg352Gln OSGEP mutation in the homozygous state (individual «CP» described in Braun et al.) (d) (mean ± s.e.m. of two independent LC-MS/MS experiments (technical replicates), each measuring samples from three independent cell culture experiments; one-way ANOVA (F (3,44) = 6.446, p < 0.001), Dunnett’s multiple comparisons test, n.s. = 0.4894, *p = 0.0169, ***p = 0.008). Source data are provided as a Source Data file
Fig. 4
Fig. 4
Proliferation, apoptosis, and protein synthesis defects upon GON7 and YRDC knockdown. Transient knockdown (KD) of GON7, LAGE3, YRDC, and OSGEP was performed by lentiviral transduction of shRNA in immortalized human podocyte cell lines with a scrambled (non-targeting) shRNA as control. a Cell proliferation was assessed using a colorimetric MTT assay over 7 days, measuring absorbance at 490 nm at days 1, 2, 3, 4, and 7 (mean ± s.e.m. of n = 5 experiments, with each experiment performed in triplicate; two-way ANOVA (p < 0.0001), Dunnett’s multiple comparisons test, n.s. = 0.2031, ***p < 0.0007, ****p < 0.0001). b Cell apoptosis was evaluated by quantification of caspase 3/7 activation on the basis of fluorescence intensity (530/405 nm). Absolute values were normalized to DAPI fluorescence intensity as an internal control and compared to non-targeting shRNA-treated control cells (scrambled) (mean ± s.e.m. of n = 3 experiments with each experiment performed in triplicate; one-way ANOVA (F (4,10) = 21.42, p < 0.0001), Dunnett’s multiple comparisons test, n.s. = 0.0556, **p = 0.0012, ****p < 0.0001). c Protein biosynthesis rates were assessed on the basis of incorporation of HPG, an alkyne-containing methionine analog. After 2 h, alkyne-containing proteins were quantified on the basis of fluorescence intensity (485/535 nm). Absolute values were normalized to DAPI fluorescence intensity as an internal control and compared to control cells (mean ± s.e.m. of n = 3 experiments, with each experiment performed in triplicate, one-way ANOVA (F (4,10) = 16.36, p= 0.0002), Dunnett’s multiple comparisons test, **p = 0.0035, ****p < 0.0003). d Relative expression of GON7, YRDC, LAGE3, and OSGEP transcripts were normalized to that of HPRT in KD podocytes compared to non-targeting shRNA control treated cells (mean ± s.e.m. of n = 5 experiments, with each experiment being performed in triplicate; two-tailed Mann–Whitney test, **p < 0.05). Source data are provided as a Source Data file
Fig. 5
Fig. 5
Structure of the GON7/LAGE3/OSGEP complex. a Normalized Kratky plot of intensity scattering of GON7 (orange) and of the GON7/LAGE3 (green) and GON7/LAGE3/OSGEP complexes (red). q: scattering vector, Rg radius of gyration, Iq: scattering intensity, I0: scattering intensity at zero angle. b Experimental x-ray scattering curve of the GON7/LAGE3/OSGEP complex (red). The blue curve represents the calculated scattering curve for the corresponding crystal structure of the complex. This yielded a good fit with the experimental data (χ2 = 0.33). The inset shows the BUNCH model. c Representation of the crystal structure of the GON7/LAGE3/OSGEP complex: GON7 (gold), LAGE3 (blue), OSGEP (red). The N and C-termini of GON7 are labeled. The crystal lacked density for GON7 beyond residue 50. The active site of OSGEP is highlighted by the Mg2+ ion (green). d Superimposition of the yeast Gon7/Pcc1 complex (gray) onto GON7/LAGE3/OSGEP. GON7/LAGE3/OSGEP (same color code as in panel c)
Fig. 6
Fig. 6
Role of GON7 on KEOPS complex stability. a Immunoblot analysis of HEK293T cell lysates expressing either 2HA-tagged GON7 or V5-tagged LAGE3 alone or co-expressing both proteins. Anti-HA and anti-V5 antibodies were used to assess GON7 and LAGE3 expression, respectively, with α-tubulin used as loading control. b Representation of cycloheximide chase experiments by fitting a one-phase exponential decay curve to experimental data (one representative experiment is shown in Supplementary Fig. 9) (mean ± s.e.m. of n = 3 experiments). HEK293T cells were transfected with either 2HA-tagged GON7 or V5-tagged LAGE3 alone or with both proteins before being subjected to treatment with 100 µg/ml cycloheximide for the indicated time points in order to assess rates of protein degradation followed by western blotting of the cell lysates for both proteins with anti-HA and anti-V5 antibodies, respectively. GON7 and LAGE3 protein levels were normalized to those of α-tubulin at each time point. c Western blot analysis of protein expression level of the five KEOPS subunits in lymphoblastoid cell lines from two unaffected relatives (A.II-1 and A.II-5), four individuals with the GON7 mutation p.Tyr*7, one individual with the OSGEP mutations p.Arg325Gln and p.Arg280His (individual «N2705» described in Braun et al.), and one individual with GAMOS linked to WDR73 mutations (individual A.II-4 described in Colin et al.). One representative western blot is shown (three independent experiments were performed). α-Tubulin was used as a loading control. Source data are provided as a Source Data file

References

    1. El Yacoubi B, Bailly M, de Crecy-Lagard V. Biosynthesis and function of posttranscriptional modifications of transfer RNAs. Annu. Rev. Genet. 2012;46:69–95. doi: 10.1146/annurev-genet-110711-155641. - DOI - PubMed
    1. El Yacoubi B, et al. A role for the universal Kae1/Qri7/YgjD (COG0533) family in tRNA modification. EMBO J. 2011;30:882–893. doi: 10.1038/emboj.2010.363. - DOI - PMC - PubMed
    1. Srinivasan M, et al. The highly conserved KEOPS/EKC complex is essential for a universal tRNA modification, t6A. EMBO J. 2011;30:873–881. doi: 10.1038/emboj.2010.343. - DOI - PMC - PubMed
    1. Lauhon CT. Mechanism of N6-threonylcarbamoyladenonsine (t(6)A) biosynthesis: isolation and characterization of the intermediate threonylcarbamoyl-AMP. Biochemistry. 2012;51:8950–8963. doi: 10.1021/bi301233d. - DOI - PubMed
    1. Costessi A, et al. The human EKC/KEOPS complex is recruited to Cullin2 ubiquitin ligases by the human tumour antigen PRAME. PLoS One. 2012;7:e42822. doi: 10.1371/journal.pone.0042822. - DOI - PMC - PubMed

Publication types

MeSH terms

Supplementary concepts