. 2019 Sep 3;10(1):3964.
doi: 10.1038/s41467-019-11843-0.

Non-classical tissue monocytes and two functionally distinct populations of interstitial macrophages populate the mouse lung

Affiliations

Non-classical tissue monocytes and two functionally distinct populations of interstitial macrophages populate the mouse lung

Joey Schyns et al. Nat Commun. .

Abstract

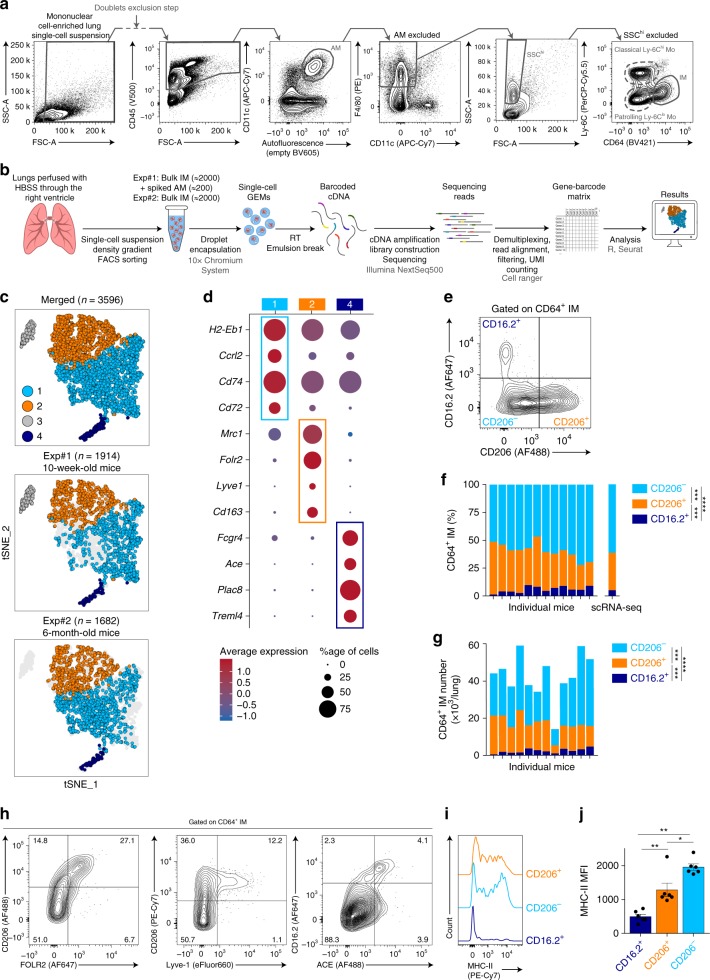
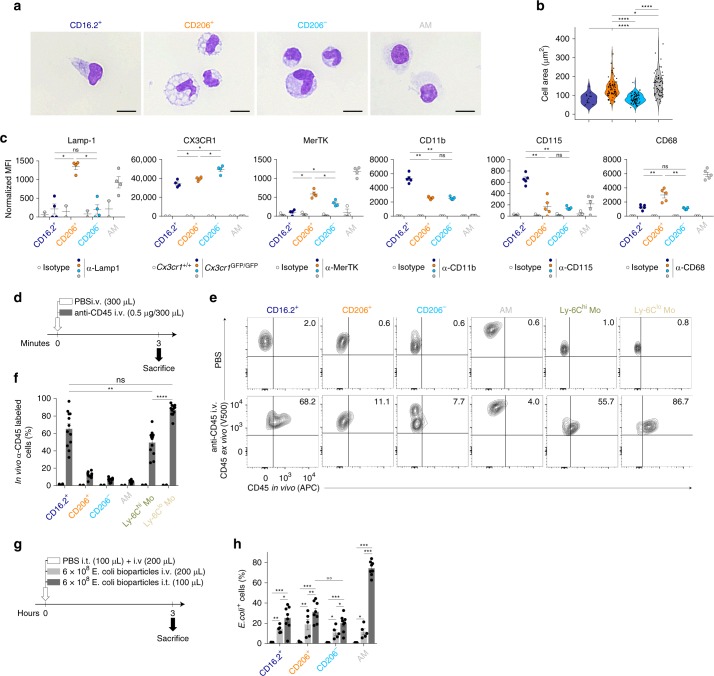
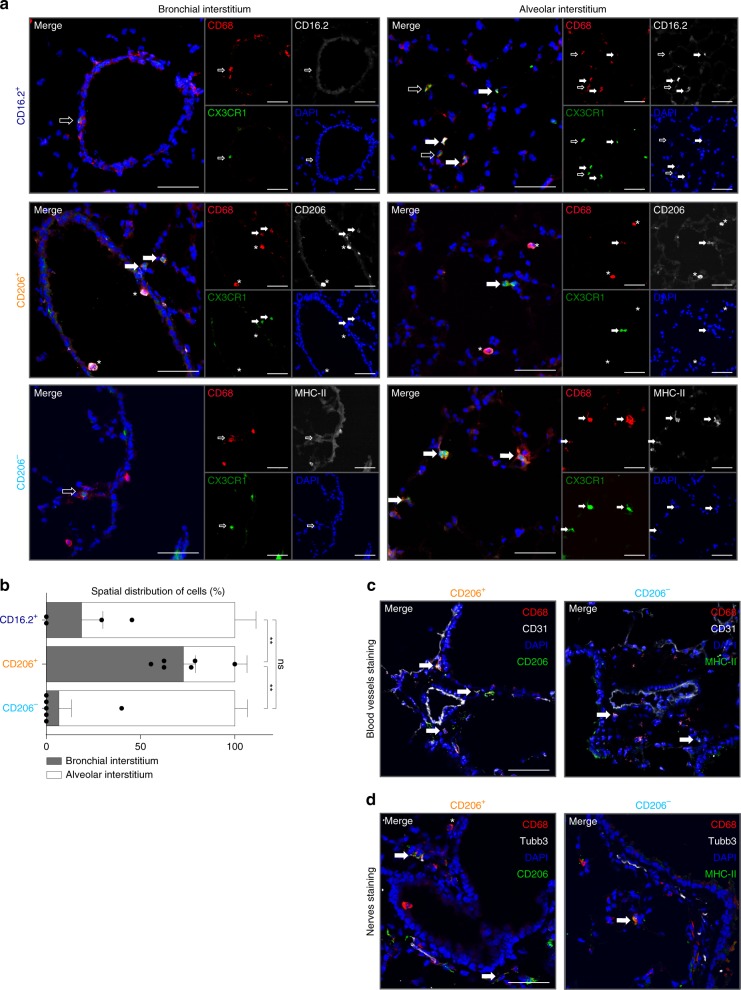
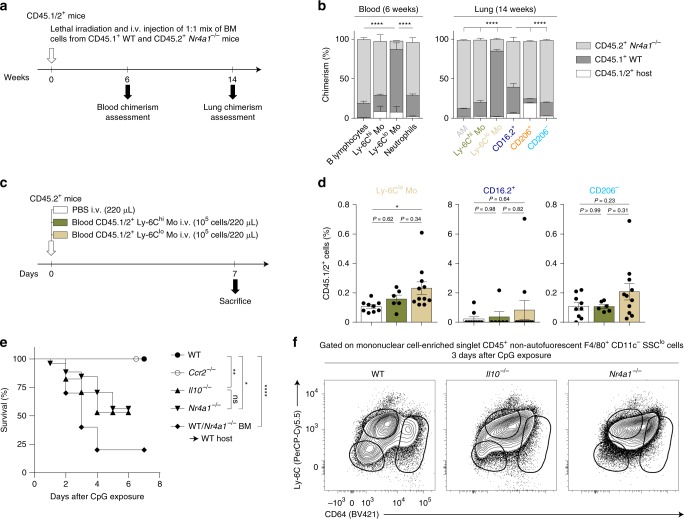
Resident tissue macrophages (RTM) can fulfill various tasks during development, homeostasis, inflammation and repair. In the lung, non-alveolar RTM, called interstitial macrophages (IM), importantly contribute to tissue homeostasis but remain little characterized. Here we show, using single-cell RNA-sequencing (scRNA-seq), two phenotypically distinct subpopulations of long-lived monocyte-derived IM, i.e. CD206+ and CD206-IM, as well as a discrete population of extravasating CD64+CD16.2+ monocytes. CD206+ IM are peribronchial self-maintaining RTM that constitutively produce high levels of chemokines and immunosuppressive cytokines. Conversely, CD206-IM preferentially populate the alveolar interstitium and exhibit features of antigen-presenting cells. In addition, our data support that CD64+CD16.2+ monocytes arise from intravascular Ly-6Clo patrolling monocytes that enter the tissue at steady-state to become putative precursors of CD206-IM. This study expands our knowledge about the complexity of lung IM and reveals an ontogenic pathway for one IM subset, an important step for elaborating future macrophage-targeted therapies.


Conflict of interest statement

The authors declare no competing interests.

Figures

Fig. 1
Fig. 1
ScRNA-seq analysis of CD64+ mononuclear cells in lungs of naive C57BL/6 WT mice. a Gating strategy used for FACS sorting prior to scRNA-seq experiments. b Experimental pipeline of scRNA-seq experiments. c t-SNE plots depicting the CD64-expressing cells analyzed by scRNA-seq. n indicates the number of cells analyzed after quality control and filtering. d Dot plots showing average expression of the indicated genes and percentages of cells expressing the genes within each cluster. Examples of transcripts significantly differentially regulated (Padj < 10−2) between Cluster 4, 2 or 1 vs. the 2 other clusters are depicted. e Representative contour plot of CD16.2 and CD206 expression within CD64+ IM, whose quantification is shown in (f). f Percentage of each mononuclear phagocyte subset among CD64+ bulk IM, assessed by flow cytometry. Stacked bars represent individual mice, and the % of cells per cluster as identified by scRNA-seq (right bar). g Numbers of each mononuclear phagocyte subset within the steady-state lung. Stacked bars represent individual mice. h Representative contour plot of the indicated markers within CD64+ IM. Numbers indicate the percentage of cells within the respective gates. The plots are representative of one of 6 individual mice analyzed, each of them giving similar results. i Representative histograms of surface MHC-II expression within each mononuclear phagocyte subset, whose quantification is shown in (j). j Quantification of MHC-II MFI. f, g Data show individual mice and are pooled from 3 independent experiments (n = 12). j Data show mean ± s.e.m. and are pooled from 2 independent experiments, each symbol representing individual mice (n = 6). P values were calculated using non-parametric f, g Friedman or j Mann–Whitney tests for pairwise comparisons. *P < 0.05; **P < 10−2; ***P < 10−3; ****P < 10−4. Source data are provided as a Source Data file. AM, alveolar macrophage; Exp, experiment; GEM, gel bead in emulsion; IM, interstitial macrophage (sorted in bulk, as shown in a); MFI, Mean Fluorescence Intensity; Mo, monocyte; RT, reverse transcription
Fig. 2
Fig. 2
Morphology, phenotype, tissue association and phagocytic abilities of lung CD64+ subpopulations. a Representative photograph of the indicated FACS-sorted populations. b Quantification of the size of cells presented as violin plots (height: cell area; width abundance of cells) and individual dots representing single cells. c Quantification of expression of the indicated markers as compared to control cells. d Experimental outline for panels (e, f). e Representative contour plots showing binding of anti-CD45 in vivo vs. anti-CD45 ex vivo antibodies on the indicated cell populations. Numbers indicate the percentage of double-positive cells. f Percentage of cells positive for anti-CD45 in vivo and ex vivo stainings within the indicated populations. g Experimental outline for panel (h). h Percentage of E. coli bioparticle-positive cells 3 h after i.v. or i.t. administration. Data show (b) individual cells pooled from 3 independent sorting experiments (CD16.2+, CD206+, CD206, AM: n = 16,77,75,72, respectively), or (c, f, h) mean ± s.e.m., as well as individual mice (c, n = 4-5; f, n = 12; h, n = 5–8/group), and are pooled from 2 independent experiments. P-values were calculated using (c, f) non-parametric Mann–Whitney tests for pairwise comparisons or (h) a linear mixed model on log(y+1)-transformed values with Tukey’s post hoc test. *P < 0.05; **/°°P < 10−2; ***P < 10−3; ****P < 10−4; ns, not significant. Empty circles compare % of E. coli+ cells after i.t. injection in CD206+ vs. CD206 IM subsets. Source data are provided as a Source Data file. i.t., intratracheal; i.v., intravenous; MFI, Mean Fluorescence Intensity. Scale bar = 10 µm
Fig. 3
Fig. 3
Maintenance of lung tissue CD64+ mononuclear phagocytes in adult C57BL/6 mice. a Experimental outline for panels (b, c). Briefly, at 4 weeks of age, Cx3cr1CreERT2.Rosa26-LSL-YFP mice were treated with TAM s.c. 3 times, 48h apart. Mice were analyzed for YFP expression 2, 9, 28, and 52 weeks later. b Representative histograms of YFP expression within the indicated populations. Numbers indicate the percentage of YFP+ cells, as quantified in (c). c Percentage of YFP+ cells within the indicated populations, assessed by flow cytometry. d Percentages of Ki-67+ cells in the indicated populations. e, f Absolute numbers of the indicated cell populations in the lungs of e Ccr2−/− or f Nr4a1−/− and control WT mice. c–f Data show mean ± s.e.m., as well as individual mice in (d–f) (c, n = 10; d, n = 4; e, f, n = 9–12) and are pooled from 2 to 3 independent experiments. P-values were calculated using (c) a two-way ANOVA with Tukey’s post hoc test, d non-parametric Mann–Whitney test for pairwise comparisons or e, f a two-tailed unpaired Student’s t-test. °/*P < 0.05; **P < 10−2; ***P < 10−3; ****P < 10−4; ns, not significant. In c the empty circle compares CD206+ and CD206IM at week 52. Source data are provided as a Source Data file. s.c., subcutaneous; TAM, tamoxifen
Fig. 4
Fig. 4
Localization of lung CD64+CD16.2+ monocytes, CD206+ IM and CD206 IM a Confocal microscopy pictures of lung sections from Cx3cr1GFP/GFP mice (CX3CR1 [green]; CD68 [red]; DAPI [blue]; CD16.2, MHC-II or CD206 [white]). CD64+CD16.2+ monocytes, CD206+ IM and CD206 IM were identified as CX3CR1+CD68+CD16.2+, CX3CR1+CD68+CD206+ and CX3CR1+CD68+MHC-II+cells, respectively. Asterisks indicate CX3CR1CD68+ AM; plain or empty arrows indicate CX3CR1+CD68+ cells expressing or not the marker of interest (i.e., CD16.2, CD206 or MHC-II), respectively. b Preferential distribution of the indicated populations in the peribronchial/perivascular area vs. the alveolar parenchyma. c, d Lung sections of C57BL/6 WT mice were analyzed: CD68 [red]; c CD31 or d Tubb3 [white]; DAPI [blue]; MHC-II, CD206 or CD16.2 [green]). CD206+ IM, CD206− IM and CD64+CD16.2+ monocytes were identified as CD68+CD206+, CD68+MHC-II+ and CD68+CD16.2+ cells, respectively. b Data show mean ± s.e.m. and are pooled from 2 independent batches of mice (n = 4–6). P-values were calculated using a Kruskal–Wallis test, and pairwise comparisons were estimated using Mann–Whitney tests. **P < 10−2; ns, not significant. Source data are provided as a Source Data file. Scale bars = (a) 100 µm; (c,d) 50 µm
Fig. 5
Fig. 5
Functional properties of IM subpopulations at steady-state and dynamic regulation after airway exposure to microbial products. a Experimental outline for (b). FACS-sorted IM subpopulations were cultured ex vivo overnight with or without LPS, and supernatants were subjected to proteome profiling. b Heatmap depicting the relative abundance of the indicated molecules in the supernatants of non-stimulated (NS) or LPS-stimulated (LPS) lung IM subpopulations. Data represent the mean and are representative of one of 2 independent sorting experiments. c Representative contour plots showing steady-state IL-10 expression as assessed by detection of 450 nm fluorescence (blue fluorescent product of the cleaved CCF4 substrate) in CCF4-loaded cells isolated from IL-10-β-lactamase reporter ITIB or WT control mice. Numbers indicate % of IL-10+ cells within the cell populations, as quantified in (d). d Percentages of IL-10+ cells in the indicated populations. e Experimental outline for panels (f–i). f Kinetic analysis of numbers of each mononuclear phagocyte subset after i.t. instillation of Pam3CSK4, LPS, and CpG. g Representative contour plot of CD16.2 and CD206 expression within CD64+ IM from control (Day 0), and Pam3CSK4-, LPS- and CpG-injected mice 7 days after treatment. h Kinetic analysis of MHC-II expression within the indicated populations after Pam3CSK4, LPS or CpG treatment. i Numbers of IL-10+ cells within the indicated subpopulations 7 days after treatment. d, f, h, i Data show mean ± s.e.m., as well as individual mice in (d, i), and are pooled from 2 independent experiments (d, n = 9; f, h, n = 5–6/time point; i, n = 3–5). P-values were calculated using d, i non-parametric Mann–Whitney tests for pairwise comparisons or f, h two-way ANOVA with Tukey’s post hoc tests. *P < 0.05; **P < 10−2; ***P < 10−3; ****/°°°°P < 10−4; ns, not significant. In f the empty circles compare numbers of CD206+ IM 3 days after LPS vs. day 0. Source data are provided as a Source Data file. i.t., intratracheal
Fig. 6
Fig. 6
RNA velocity and trajectory analyses of lung monocyte and IM subpopulations in steady-state C57BL/6 mice. a t-SNE plot depicting the merged scRNA-seq data of lung CD64-expressing cells (see Fig. 1c), Ly-6Clo patrolling monocytes (see Supplementary Fig. 9) and Ly-6Chi classical monocytes (see Supplementary Fig. 12). b Prevalent patterns of RNA velocities substantiated by arrows and visualized on the same t-SNE plot as shown in (a). Right panel shows a higher magnification of the area depicted by a black dashed line in the left panel. (see single cell velocities in Supplementary Fig. 13). c Violin plot showing quantification of single cell relative 2D velocities in the indicated cell (sub)populations, as presented in Supplementary Fig. 13. d Visualization of single-step transition probabilities from Ly-6Clo patrolling monocytes (left), Ly-6Chi classical monocytes (middle) or CD64+CD16.2+ monocytes (right) to neighboring cells. Ellipses represent 95% confidence. e, f Slingshot analysis of Ly-6Clo patrolling monocytes, CD64+CD16.2+ monocytes, and neighboring CD206 IM. e Suggested pseudo-time trajectory from Ly-6Clo patrolling monocytes to CD206 IM. Ellipses represent 80% confidence. f Heatmap depicting gene expression profiles of Ly-6Clo patrolling monocytes, CD64+CD16.2+ monocytes, and neighboring CD206 IM ordered according to Slingshot pseudo-time trajectory. Left color bars indicate annotation by cell type
Fig. 7
Fig. 7
Patrolling monocyte-derived NR4A1-dependent CD16.2+ monocytes are local precursors of CD206 IM. a Experimental outline for experiments using mixed BM competitive chimeras shown in (b). b Percentage of BM chimerism and radio-resistance of the indicated populations. c Experimental outline for (d). d Percentages of CD45.1/2+ cells within the indicated cell populations. e Survival (% of live animals) were monitored at the indicated mice after CpG treatment. P-values are versus CpG-injected WT mice. f Representative contour plot of Ly-6C and CD64, gated on singlet mononuclear cell-enriched CD45+ non-autofluorescent SSCloF4/80+CD11c cells (see Fig. 1a). Data are representative of 1 of 4 mice analyzed, each giving similar patterns. Data in b, d shown mean ± s.e.m., as well as individual mice in (d), and are pooled from (b) 2 or (d) 3 independent experiments (b, n = 3 [blood] or 7 [lung]; d, n = 6–11/group). e Data were pooled from 2–4 independent experiments (n = 10–26/group). P-values were calculated using b a one-way ANOVA followed by Tukey’s post hoc tests, d non-parametric Mann–Whitney tests for pairwise comparisons or e Mantel–Cox tests. *P < 0.05; **P < 10−2; ****P < 10−4; ns, not significant. i.v., intravenous

References

    1. Epelman S, Lavine KJ, Randolph GJ. Origin and functions of tissue macrophages. Immunity. 2014;41:21–35. doi: 10.1016/j.immuni.2014.06.013. - DOI - PMC - PubMed
    1. Ginhoux F, Guilliams M. Tissue-resident macrophage ontogeny and homeostasis. Immunity. 2016;44:439–449. doi: 10.1016/j.immuni.2016.02.024. - DOI - PubMed
    1. Okabe Y, Medzhitov R. Tissue biology perspective on macrophages. Nat. Immunol. 2016;17:9–17. doi: 10.1038/ni.3320. - DOI - PubMed
    1. Lavin Y, et al. Tissue-resident macrophage enhancer landscapes are shaped by the local microenvironment. Cell. 2014;159:1312–1326. doi: 10.1016/j.cell.2014.11.018. - DOI - PMC - PubMed
    1. Guilliams M, Scott CL. Does niche competition determine the origin of tissue-resident macrophages? Nat. Rev. Immunol. 2017;17:451–460. doi: 10.1038/nri.2017.42. - DOI - PubMed

Publication types