. 2019 Oct;121(7):600-610.
doi: 10.1038/s41416-019-0565-8. Epub 2019 Sep 4.

Combined poly-ADP ribose polymerase and ataxia-telangiectasia mutated/Rad3-related inhibition targets ataxia-telangiectasia mutated-deficient lung cancer cells

Affiliations

Combined poly-ADP ribose polymerase and ataxia-telangiectasia mutated/Rad3-related inhibition targets ataxia-telangiectasia mutated-deficient lung cancer cells

Nicholas R Jette et al. Br J Cancer. 2019 Oct.

Erratum in

Abstract

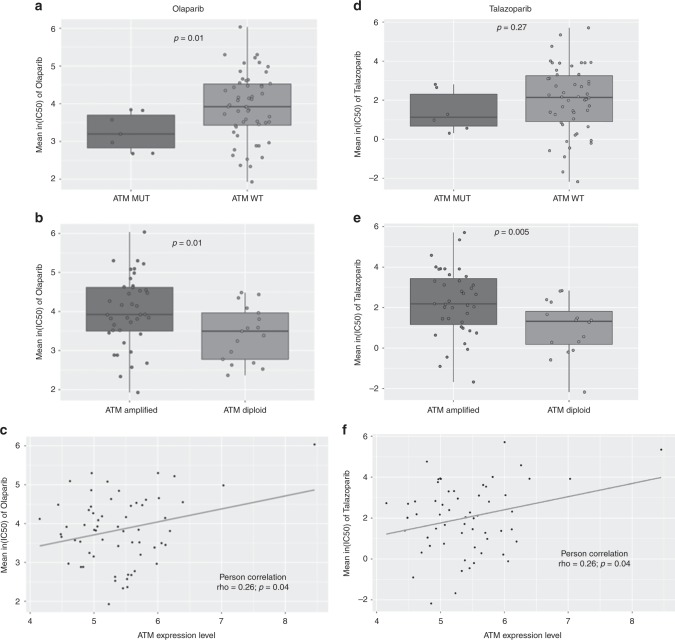
Background: Up to 40% of lung adenocarcinoma have been reported to lack ataxia-telangiectasia mutated (ATM) protein expression. We asked whether ATM-deficient lung cancer cell lines are sensitive to poly-ADP ribose polymerase (PARP) inhibitors and determined the mechanism of action of olaparib in ATM-deficient A549 cells.

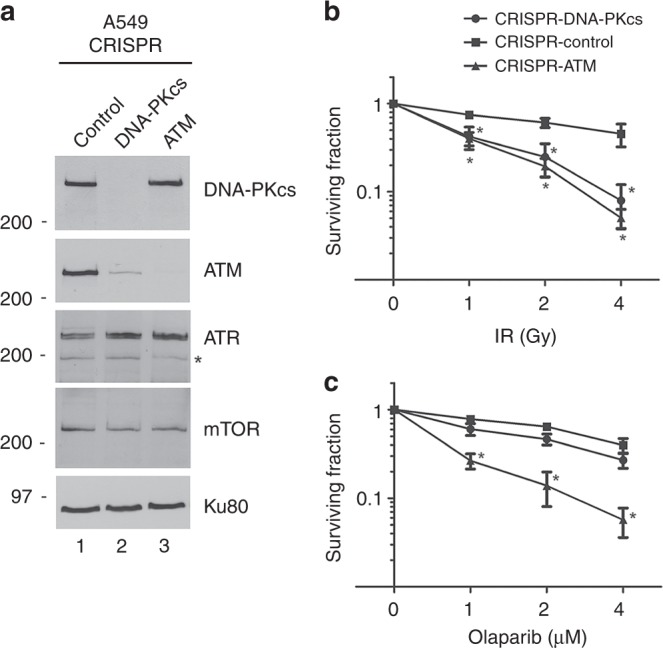
Methods: We analysed drug sensitivity data for olaparib and talazoparib in lung adenocarcinoma cell lines from the Genomics of Drug Sensitivity in Cancer (GDSC) project. We deleted ATM from A549 lung adenocarcinoma cells using CRISPR/Cas9 and determined the effects of olaparib and the ATM/Rad3-related (ATR) inhibitor VE-821 on cell viability.

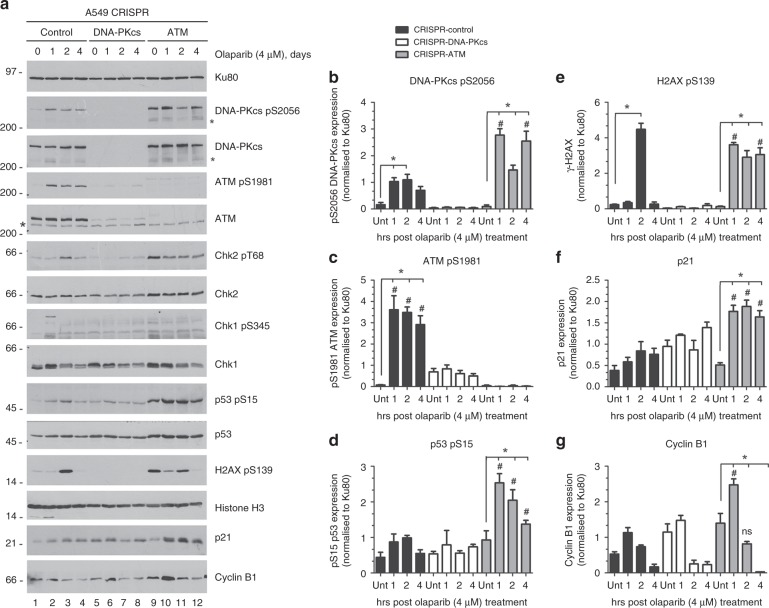
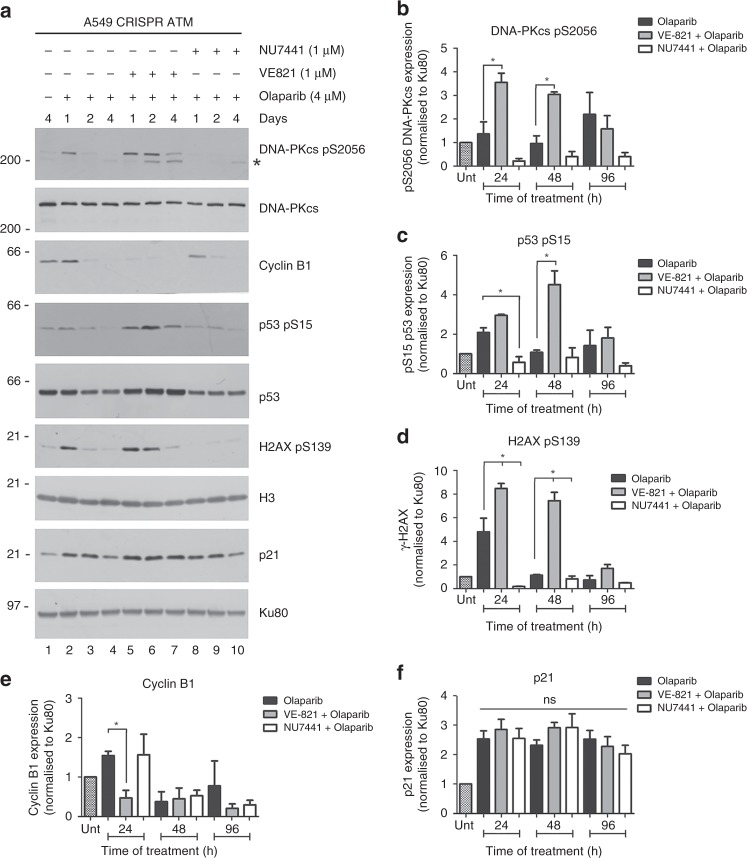
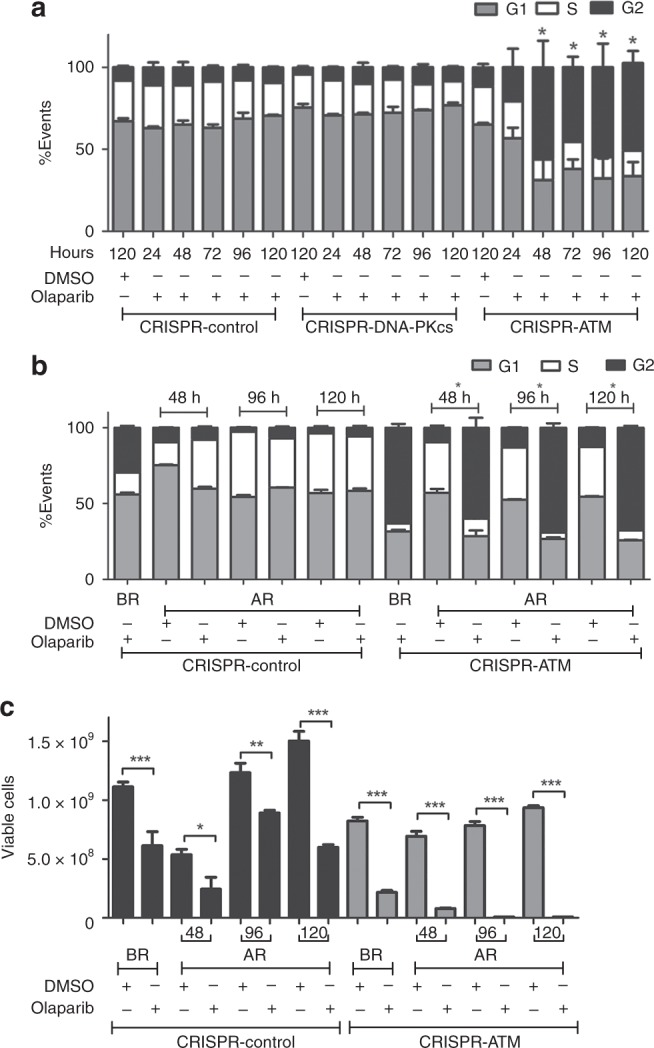
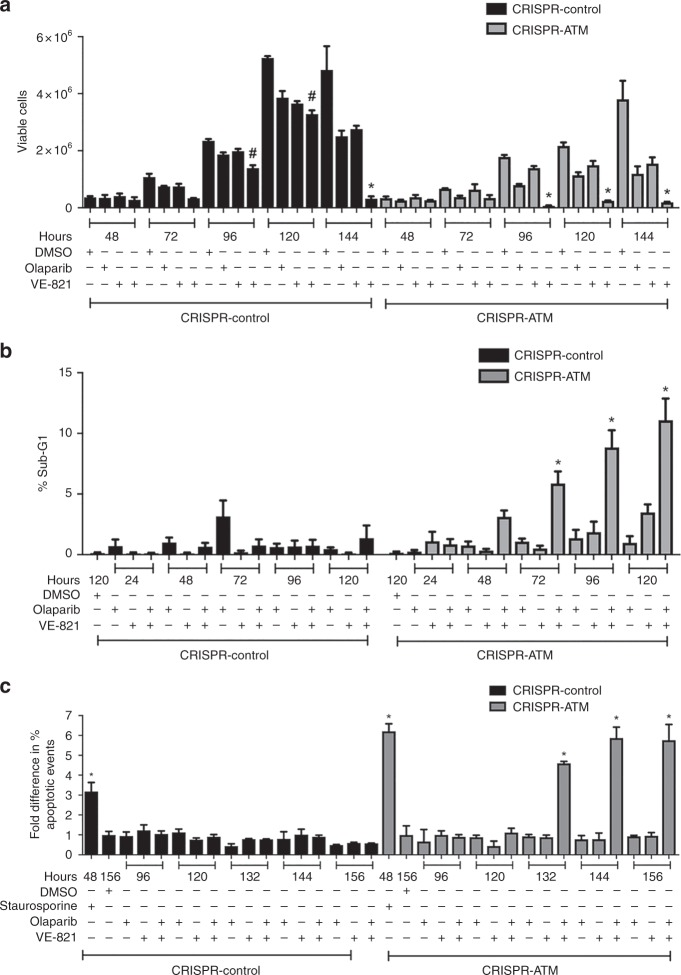
Results: IC50 values for both olaparib and talazoparib positively correlated with ATM mRNA levels and gene amplification status in lung adenocarcinoma cell lines. ATM mutation was associated with a significant decrease in the IC50 for olaparib while a similar trend was observed for talazoparib. A549 cells with deletion of ATM were sensitive to ionising radiation and olaparib. Olaparib induced phosphorylation of DNA damage markers and reversible G2 arrest in ATM-deficient cells, while the combination of olaparib and VE-821 induced cell death.

Conclusions: Patients with tumours characterised by ATM-deficiency may benefit from treatment with a PARP inhibitor in combination with an ATR inhibitor.


Conflict of interest statement

The authors declare no competing interests.

Figures

Fig. 1
Fig. 1
ATM deficiency is associated with PARP inhibitor sensitivity in lung adenocarcinoma cell lines described in the GDSC project. a, b Boxplots comparing olaparib IC50 values between (a) ATM mutant and ATM wild-type cells and (b) ATM amplified and ATM diploid cells. Cell lines containing >3 copies of the ATM gene were classified as “ATM amplified”. c Scatterplot showing the correlation between ATM gene expression (mRNA) and olaparib IC50 values. df ATM deficiency is associated with talazoparib sensitivity in 59 lung adenocarcinoma cell lines in the GDSC project. Boxplots comparing talazoparib IC50 values between (d) ATM mutant and ATM wild-type cells; e ATM amplified and ATM diploid cells. f Scatterplot showing the correlation between ATM gene expression and talazoparib IC50 values
Fig. 2
Fig. 2
Characterisation of A549 cells with CRISPR/Cas9 depletion of ATM or DNA-PKcs. a Total cell extracts were prepared from A549-CRISPR-control, A549-CRISPR-DNA-PKcs cells and A549-CRISPR-ATM cells by NETN lysis. Fifty µg total protein was run on SDS-PAGE and membranes were immunoblotted for DNA-PKcs, ATM, ATR, mTOR and Ku80 (loading control) as shown on the right-hand side. The asterisk indicates a non-specific band. Positions of molecular weight markers in kDa are shown on the left-hand side. A list of antibodies used in the study are provided in Supplementary Table 2. Bands were quantitated and normalised to Ku80 as described in Supplementary Methods. The level of ATM expression in A549-CRISPR-DNA-PKcs cells was 17% of that in A549-CRISPR-control cells while the level of DNA-PKcs in A549-CRISPR-ATM cells was 93% that in control cells. Results are from 2 separate experiments. b, c A549-CRISPR-control, CRISPR-ATM and CRISPR-DNA-PKcs cell lines were treated with increasing doses of IR (b), or increasing concentrations of olaparib (c), and analysed by clonogenic survival assays as described in Methods. Results show the average of three separate experiments with each treatment carried out in triplicate. Statistical significance was determined using one-way ANOVA. Error bars represent SEM, and * indicates a p-value < 0.05 when compared to the control A549 cell line at the indicated time points
Fig. 3
Fig. 3
Olaparib induces a DNA damage response in ATM-deficient cells. a A549-CRISPR-control, A549-CRISPR-DNA-PKcs and A549-CRISPR-ATM cells were treated with olaparib (4 µM) for 1, 2 or 4 days, following which NETN extracts were generated and samples were run on SDS-PAGE as in Fig. 2a. Blots were probed for Ku80 as a loading control. Samples in lanes marked 0, were treated with DMSO for 4 days. Positions of molecular weight markers in kDa are shown on the left-hand side. The asterisks indicate non-specific bands. Panels bg show quantitation of results from three separate experiments. Black bars represent control cells, white bars indicate A549-CRISPR-DNA-PKcs cells and grey bars represent A549-CRISPR-ATM cells. Western blots from two additional experiments, as well as quantitation of Chk2 T68 phosphorylation, is shown in Supplementary Fig. 6. Error bars represent mean with SEM of three independent experiments. One-way ANOVA was used to determine the statistical significance of three separate experiments. * Indicates p-value < 0.05 when compared to its own control group. # Indicates statistical significance when compared to the corresponding treatment groups of CRISPR-control cells
Fig. 4
Fig. 4
H2AX and p53 phosphorylation in olaparib-treated A549-CRISPR-ATM cells is DNA-PK-dependent. a A549-CRISPR-ATM cells were incubated with DMSO alone (lane 1) or olaparib (4 µM, lanes 2–10) in the absence or presence of the ATR inhibitor (VE-821, 1 µM, lanes 5–7) or the DNA-PK inhibitor (NU7441, 1 µM, lanes 8–10) as shown in lanes 5–7 and 8–10, respectively. Cells were harvested after 1, 2 or 4 days as indicated, and aliquots were run on SDS-PAGE with immunoblot as in Fig. 3. Quantitation of three separate repeats is shown in (bf). See also Supplementary Fig. 8 for additional experimental repeats. Untreated cells are shown by the hatched bar in the first lane on the left (see Supplementary Fig. 8 for additional details). All panels show the mean with SEM from three independent experiments. One-way ANOVA was used to determine the statistical significance of three separate experiments. * indicates p-value < 0.05 for VE-821 + olaparib or NU7441 + olaparib treatment groups when compared with olaparib alone
Fig. 5
Fig. 5
Olaparib induces reversible G2 arrest in ATM-depleted A549 cells. a A549-CRISPR-control, A549-CRISPR-DNA-PKcs and A549-CRISPR-ATM cells were treated with DMSO (120 h) or 4 µM olaparib and harvested after 24, 48, 72, 96 or 120 h as indicated then analysed by flow cytometry with propidium iodide staining. G1 cells are represented by grey bars, S phase cells by white bars and G2 cells by black bars. The figure shows the mean with SEM from three separate experiments. Statistical significance was determined using one-way ANOVA. * Represents, p < 0.05 for olaparib-treated cells relative to DMSO-treated cells. In no experiment did the sub-G1 fraction exceed 1% of total cells, indicating lack of apoptosis (data not shown). b A549-control and A549-CRISPR-ATM cells were treated with 4 µM olaparib for 120 h then released into fresh media containing either DMSO or 4 µM olaparib and harvested after an additional 48, 96 or 120 h, as indicated. Cells were analysed by flow cytometry with propidium iodide staining as above. The percentage of cells in G1, S and G2 are indicated in the grey, white and dark bars, respectively, as in panel (a). BR indicates before release and AR, after release. The figure represents the mean with SEM of three separate experiments. Statistical significance was determined using one-way ANOVA. * Represents, p < 0.05 for olaparib-treated cells relative to DMSO-treated cells. c Cells were treated with olaparib for 120 h then released either into fresh media containing either DMSO or olaparib as indicated then analysed by trypan blue exclusion assay to determine the number of viable cells. Black bars represent A549-CRISPR-control cells and grey bars A549-CRISPR-ATM cells. The figure represents the mean with SEM of three separate experiments. Statistical significance was determined using one-way ANOVA. The * represents, p < 0.05 for olaparib-treated cells relative to DMSO-treated cells as above
Fig. 6
Fig. 6
The ATR inhibitor VE-821 sensitises ATM-deficient cells to olaparib and induces apoptosis. a A549-CRISPR-control cells (black bars) and A549-CRISPR-ATM A549 cells (grey bars) were treated with DMSO, 1 µM olaparib, 2 µM VE-821 or olaparib and VE-821 for 48-144 h as indicated, then samples were analysed using the trypan blue exclusion assay. The figure shows the mean with SEM of three independent experiments. Statistical significance was determined by one-way ANOVA. * Indicates p-value < 0.05 when compared to other treatment groups and DMSO control. # indicates p-value < 0.05 when compared to DMSO control only. b Percentages of A549-CRISPR-control (black bars) and A549-CRISPR-ATM cells (grey bars) undergoing apoptosis, as represented by the sub-G1 population. Shading and statistics are as in panel (a). c Percentages of cells undergoing apoptosis by annexin staining. Samples are as in panel (b). Shading and statistics are as in panel (a, b)

References

    1. Farmer H, McCabe N, Lord CJ, Tutt AN, Johnson DA, Richardson TB, et al. Targeting the DNA repair defect in BRCA mutant cells as a therapeutic strategy. Nature. 2005;434:917–921. doi: 10.1038/nature03445. - DOI - PubMed
    1. Bryant HE, Schultz N, Thomas HD, Parker KM, Flower D, Lopez E, et al. Specific killing of BRCA2-deficient tumours with inhibitors of poly(ADP-ribose) polymerase. Nature. 2005;434:913–917. doi: 10.1038/nature03443. - DOI - PubMed
    1. Lord CJ, McDonald S, Swift S, Turner NC, Ashworth A. A high-throughput RNA interference screen for DNA repair determinants of PARP inhibitor sensitivity. DNA Repair. 2008;7:2010–2019. doi: 10.1016/j.dnarep.2008.08.014. - DOI - PubMed
    1. Ashworth A, Lord CJ. Synthetic lethal therapies for cancer: what’s next after PARP inhibitors? Nat. Rev. Clin. Oncol. 2018;15:564–576. doi: 10.1038/s41571-018-0055-6. - DOI - PubMed
    1. Thomas A, Murai J, Pommier Y. The evolving landscape of predictive biomarkers of response to PARP inhibitors. J. Clin. Investig. 2018;128:1727–1730. doi: 10.1172/JCI120388. - DOI - PMC - PubMed

Publication types

MeSH terms