. 2019 Sep;21(9):1078-1085.
doi: 10.1038/s41556-019-0375-5. Epub 2019 Sep 2.

Microtubules gate tau condensation to spatially regulate microtubule functions

Affiliations

Microtubules gate tau condensation to spatially regulate microtubule functions

Ruensern Tan et al. Nat Cell Biol. 2019 Sep.

Abstract

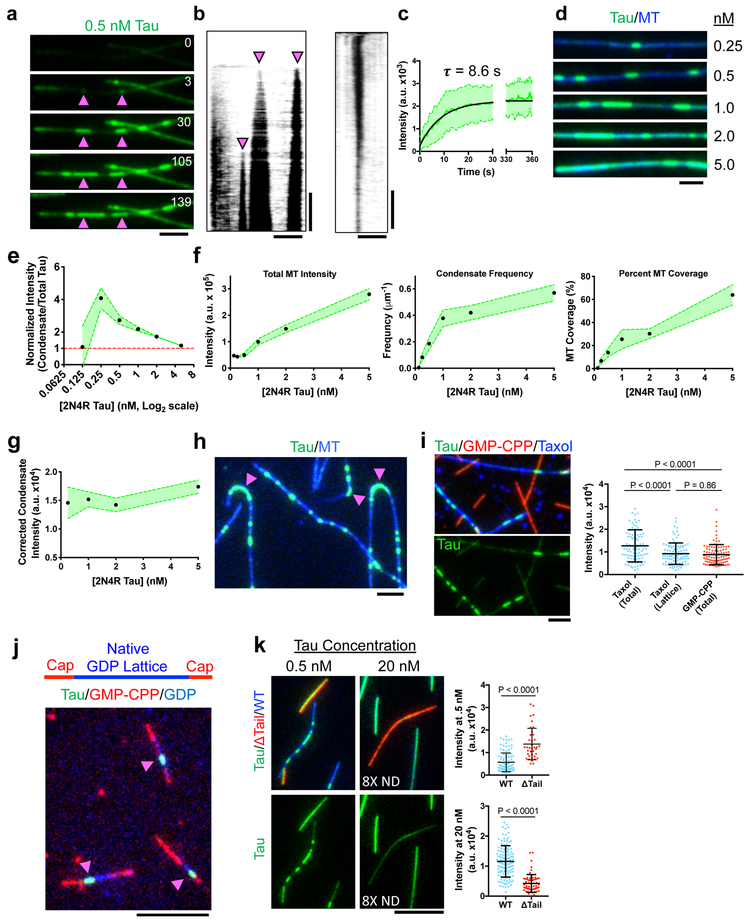
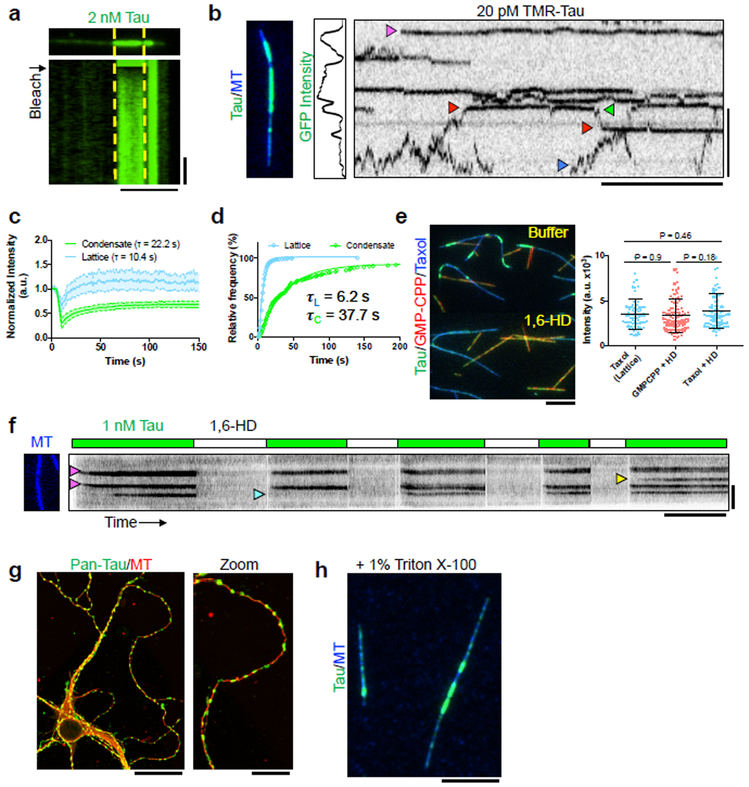
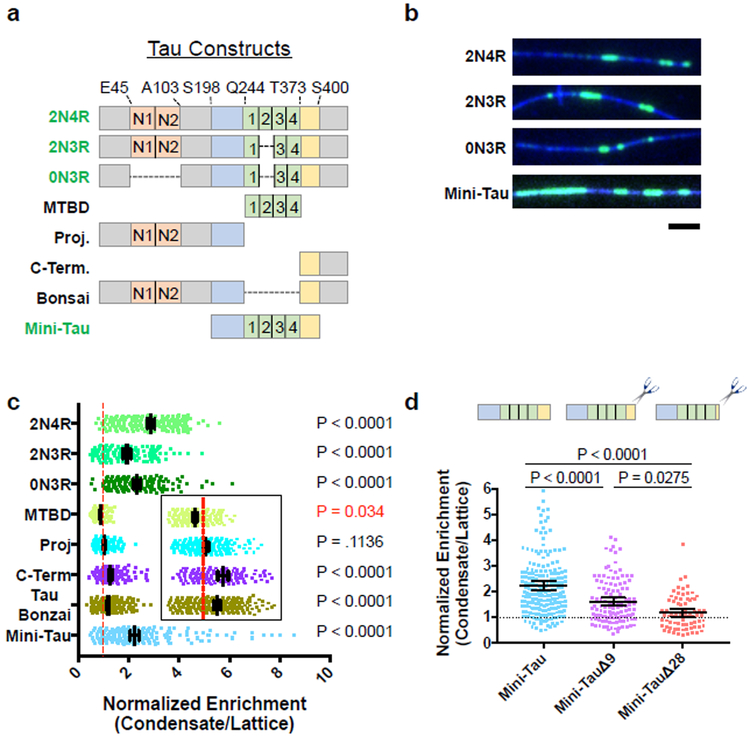
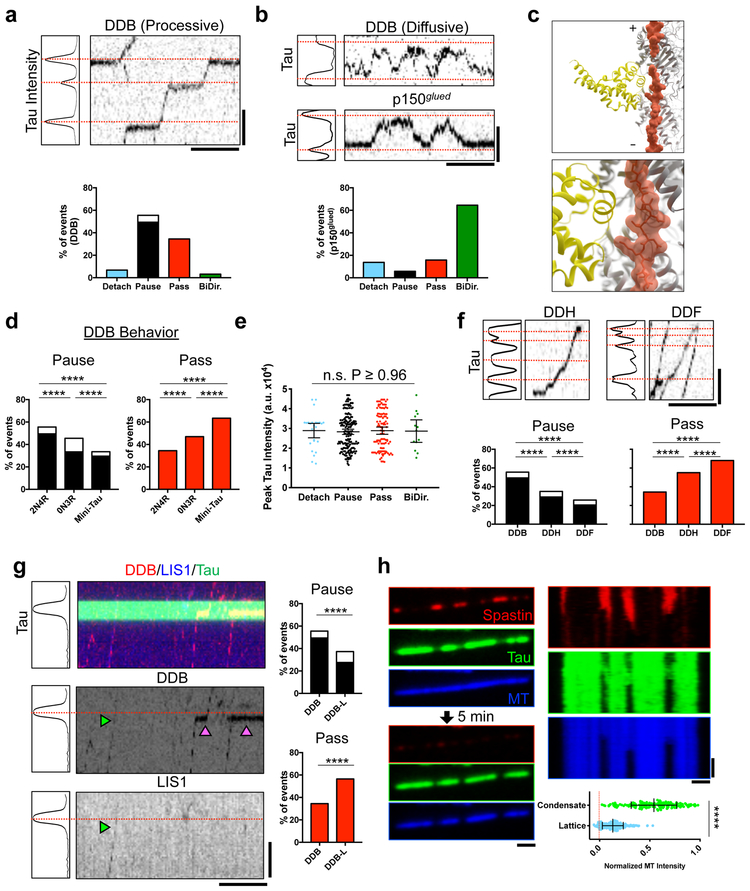
Tau is an abundant microtubule-associated protein in neurons. Tau aggregation into insoluble fibrils is a hallmark of Alzheimer's disease and other types of dementia1, yet the physiological state of tau molecules within cells remains unclear. Using single-molecule imaging, we directly observe that the microtubule lattice regulates reversible tau self-association, leading to localized, dynamic condensation of tau molecules on the microtubule surface. Tau condensates form selectively permissible barriers, spatially regulating the activity of microtubule-severing enzymes and the movement of molecular motors through their boundaries. We propose that reversible self-association of tau molecules, gated by the microtubule lattice, is an important mechanism of the biological functions of tau, and that oligomerization of tau is a common property shared between the physiological and disease-associated forms of the molecule.


Conflict of interest statement

Declaration of Interests

Authors declare no financial and non-financial competing interests.

Figures

Fig. 1.
Fig. 1.. Microtubules Gate the Spatial Condensation of Tau on the Lattice
a, Time-lapse of tau condensate nucleation and expansion. Arrows denote nucleation sites. Time in sec. N = 4 chambers. b, Left: Kymograph of (A). Right: Kymograph of condensate dissolution. N = 2 chambers. c, Quantification of tau intensity within condensates over time. Mean ± SD. N = 36 Condensates (3 chambers). d, Images of increasing tau concentrations (equal brightness and contrast). N = 3 chambers. e, Concentration curve of condensate intensity normalized by total tau intensity. Mean ± 95% CI. N = 4, 52, 144, 233, 275, and 329 condensates (3 chambers each). f, Quantification of different parementers of tau concentration titrations. Mean ± 95% CI. N = 77, 100, 104, 111, 100, and 90 MTs. (3 chambers each). g, Concentration curve of condensate intensity normalized for increases in tau intensity surrounding condensates. Mean ± 95% CI. N = 52, 233, 275, 329 condensates. (3 chambers each). h, Tau accumulation on highly curved regions of microtubules (magenta arrows). N = 3 chambers. i, Top: Tau binding to taxol- and GMP-CPP-stabilized MTs. Below: tau channel. Right: Quantification of tau intensity on taxol- versus GMP-CPP-stabilized MTs. Note total intensity (total) versus intensity outside of condensates (lattice). Mean ± SD. N = 90 (4 chambers), 98 (3 chambers), and 97 (4 chambers) continuous MT segments, respectively. j, Tau condensates (green, magenta arrows) on native GDP MT lattice (blue), stabilized at both ends with GMP-CPP caps (red). N = 3 preparations of MTs. k, Left: Tau (green) binding to subtilisin-treated (red) and untreated MTs (blue). Below: tau channel. Right: Quantification of tau intensity. Note use of 8X neutral-density (ND) filter for 20 nM tau. Mean ± SD. N = 107 (3 chambers) and 38 (3 chambers) continuous MT segments for 0.5 nM Tau. N = 116 (4 chambers) and 62 (4 chambers) continuous MT segments for 20 nM Tau. For (I) and (K), Student’s T-test (two-sided). Scale bars in a, b, d, h, i: 2 μm, j, k: 5 μm, b: 2 min., 10 min. See Supplementary Figure 1, Supplementary Video 1, and Supplementary Table 1 for source data.
Fig. 2.
Fig. 2.. Tau Condensation Reduces Molecular Dynamics of Tau Molecules on the MT Lattice.
a, Image and kymograph of FRAP of a tau condensate. Yellow lines represent photobleached region. N = 4 chambers. Scale bars: 5 μm, 20 sec. b, Quantification of FRAP recovery from both inside and outside (lattice) condensate boundaries. Mean ± SD. N = 24 regions for both condensates and lattice N = 24 segments (4 chambers). Scale bars: 2 μm, 10 sec. c, Image, GFP intensity plot, and kymograph of a MT containing GFP-tau condensates and single molecules of SNAP-TMR-labeled tau. Magenta arrow indicates static tau molecule within a condensate. Blue arrow indicates a diffusive molecule outside of a condensate. Red arrow denotes a tau molecule entering, and leaving (green arrow) a condensate. N = 4 chambers. d, Cumulative frequency plot of SNAP-TMR-tau dwell times inside and outside (lattice) GFP-tau condensates. N= 451 molecules (3 chambers) and 167 molecules (4 chambers) for lattice and condensates, respectively. e, Left: Images of tau (green) bound to taxol- (blue) or GMP-CPP-stabilized (red) MTs before and after addition of 1,6-HD. Tau concentration was kept constant during buffer exchange. Right: Plot of tau intensity outside of condensates (lattice) or total GFP intensity in the presence of 1,6-HD. Mean ± SD. N = 71 (3 chambers), 80 (3 chambers), and 103 (3 chambers) continuous MT segments. Student’s t-test (two-sided). Scale bar: 5 μm. f, Kymograph of alternating washes of 1 nM tau with or without 1,6-HD. Alternating buffer exchange scheme diagrammed above, tau concentration was kept constant during buffer exchange. Magenta arrows denote condensate nucleation, blue indicate failure to reform after 1,6-HD washout, yellow indicate new nucleation. N = 2 chambers. Scale bars: 5 μm, 5 min. g, Images of immunostained DIV7 mouse hippocampal neurons using the GTX49353 (Genetex) pan-tau antibody. N = 4 preparations of neurons. Scale bars: 25 μm, 10 μm. h, Image of in vitro tau condensates in the presence of 1% Triton X-100. N = 2 chambers. Scale bar: 5 μm. See Supplementary Figure 2, Supplementary Videos 2-3, and Supplementary Table 1 for source data.
Fig. 3.
Fig. 3.. The C-terminal Pseudo-Repeat Region of Tau Licenses the Rest of the Molecule into Tau Condensates
a, Schematic of natural tau isoforms and constructs used. Orange boxes: alternatively spliced N-term. inserts. Blue: proline-rich domain. Green: MT binding repeats. Yellow: pseudo-repeat domain. Constructs labeled in green text form condensates on their own, those in black text do not. Right, table summarizing ability of the different tau constructs to form condensates. b, Images of tau condensates formed from different alternatively spliced or artificially truncated tau constructs. N = 3 chambers each. Scale bar: 2 μm. c, Quantification of the fold enrichment of various tau constructs into 2N4R tau condensates versus the MT lattice surrounding the condensate. Inset shows zoom for clarity of MTBD, Proj, C-Term and Tau Bonzai constructs. Right: Statistical significances for enrichment (black) or exclusion (red) of a given GFP-construct within mScarlet-2N4R tau condensates (see Fig.S3). Mean ± 95% CI. N = 211,143, 158, 189, 208, 149, 296, and 239 GFP-2N4R condensates respectively (3-6 chambers for each construct). d, Quantification of the fold enrichment of Mini-Tau and C-terminal deletion constructs into 2N4R tau condensates. Data for Mini-Tau reproduced from c, for comparison. Mean ± 95% CI. N = 239, 122, and 75 GFP-2N4R condensates respectively (3-4 chambers). For c, and d, Student’s T-test (two-sided). See Supplementary Figure 3 and Supplementary Table 1 for source data.
Fig. 4.
Fig. 4.. Tau Condensates Form Selectively Permeable Barriers that Regulate Distinct MT Functions.
a, Top: Plot of tau intensity. Red lines: maximum intensity position (condensates). Right: Kymograph of processive DDB. Bottom: Event distribution for DDB. White indicates proportion that detach during pause. N = 336 events (7 chambers). b, Top: Plot of tau intensity with kymograph of diffusive DDB or p150glued molecules. Bottom: Event distribution for p150glued. N = 240 (3 chambers). c, Model of tau (R2×4, pdb: 6CVN; orange) and the dynein MTBD (DYNC1H1, pdb: 3J1T; yellow) highlighting no steric clash between the two. d, Distribution of DDB behaviors at 0N3R or mini-tau condensates. DDB behavior at 2N4R condensates reproduced from a. N = 336 events (7 chambers), 226 events (3 chambers), and 399 events (5 chambers) for 2N4R, 0N3R, and mini-tau, respectively. e, Peak tau intensity within condensates for each DDB behavior. Mean ± SD. N = 26, 178, 108, and 13 events for each respective behavior (7 chambers). f, Top: Plot of tau intensity and kymographs of DDH or DDF behavior. Bottom: Distribution for DDH and DDF behaviors at condensates. DDB behavior reproduced from a. N = 336 events (7 chambers), 268 events (8 chambers), and 697 events (4 chambers) for DDB, DDH, and DDF, respectively. g, Left: Plot of tau intensity and kymograph of DDB-L behavior. Right: Passing and pausing distribution for DDB-L. Distribution of DDB behavior reproduced from a. Green arrow: DDB-L complex, magenta arrows: DDB complexes. N = 336 events (7 chambers) and 237 events (10 chambers) for DDB and DDB-L, respectively. For a, f, and g see also Supplementary Figure. 4B. h, Left: Images of mScarlet-tau condensates with GFP-spastin before, and after 5 min. incubation. Right: Kymographs from each channel. Magenta arrows: regions of spastin-mediated MT destruction. Bottom: Normalized MT intensity after spastin severing inside/outside condensates. Mean ± SD. N = 228, and 181 continuous MT segments inside and outside condensates (4 chambers), respectively. Student’s T-test (two-sided). ****P-value < 0.0001. Scale bars in a, b, f, g: 2 μm, 15 sec. h: 1 μm, 2 min. See Supplementary Figure 4, Supplementary Videos 4-5, and Supplementary Table 1 for source data.

References

    1. Goedert M, Eisenberg DS & Crowther RA Propagation of Tau Aggregates and Neurodegeneration. Annu Rev Neurosci 40, 189–210, doi:10.1146/annurev-neuro-072116-031153 (2017). - DOI - PubMed
    1. Kapitein LC & Hoogenraad CC Building the Neuronal Microtubule Cytoskeleton. Neuron 87, 492–506, doi:10.1016/j.neuron.2015.05.046 (2015). - DOI - PubMed
    1. Li XH & Rhoades E Heterogeneous Tau-Tubulin Complexes Accelerate Microtubule Polymerization. Biophys J 112, 2567–2574, doi:10.1016/j.bpj.2017.05.006 (2017). - DOI - PMC - PubMed
    1. Makrides V et al. Microtubule-dependent oligomerization of tau. Implications for physiological tau function and tauopathies. J Biol Chem 278, 33298–33304, doi:10.1074/jbc.M305207200 (2003). - DOI - PubMed
    1. Wegmann S, Bennett RE, Amaral AS & Hyman BT Studying tau protein propagation and pathology in the mouse brain using adeno-associated viruses. Methods Cell Biol 141, 307–322, doi:10.1016/bs.mcb.2017.06.014 (2017). - DOI - PubMed

Publication types