

Gamma-Aminobutyric Acid Levels in the Anterior Cingulate Cortex of Perimenopausal Women With Depression: A Magnetic Resonance Spectroscopy Study
- PMID: 31481863
- PMCID: PMC6710535
- DOI: 10.3389/fnins.2019.00785
Gamma-Aminobutyric Acid Levels in the Anterior Cingulate Cortex of Perimenopausal Women With Depression: A Magnetic Resonance Spectroscopy Study
Abstract
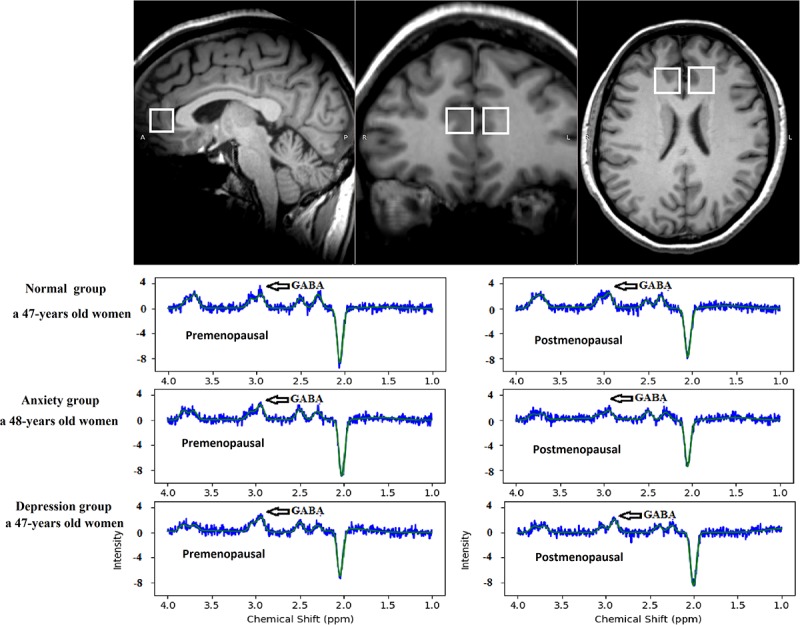
Objective: The anterior cingulate cortex (ACC) is associated with the processing of negative emotions. Gamma-aminobutyric acid (GABA) metabolism plays an important role in the pathogenesis of mental disorders. We aimed to determine the changes in GABA levels in the ACC of perimenopausal women with depression.
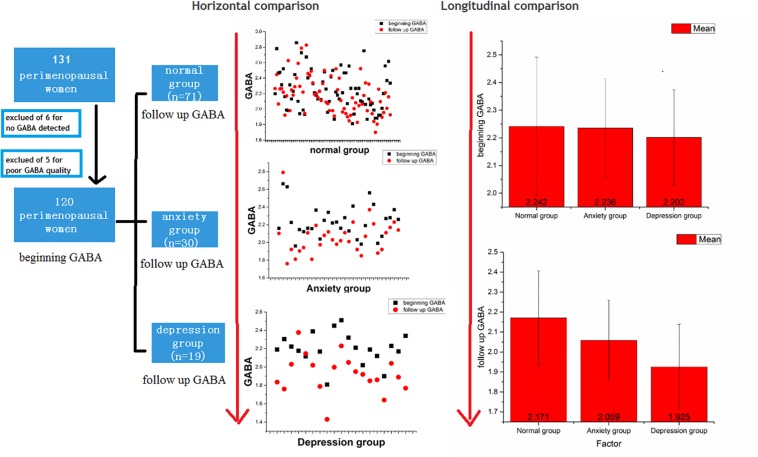
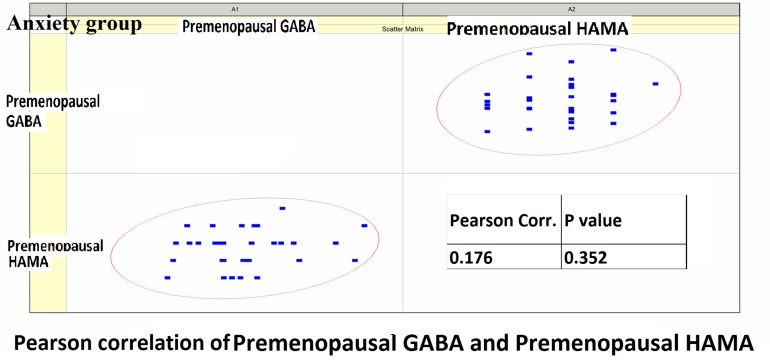
Methods: We recruited 120 perimenopausal women, who were followed up for 18-24 months. After reaching menopause, the participants were divided into a control group (n = 71), an anxiety group (n = 30), and a depression group (n = 19). The participants were examined using proton magnetic resonance spectroscopy (MRS). TARQUIN software was used to calculate the GABA concentrations in the ACC before and after menopause. The relationship of the GABA levels with the patients' scores on the 14-item Hamilton Anxiety Scale and 17-item Hamilton Depression Scale was determined.
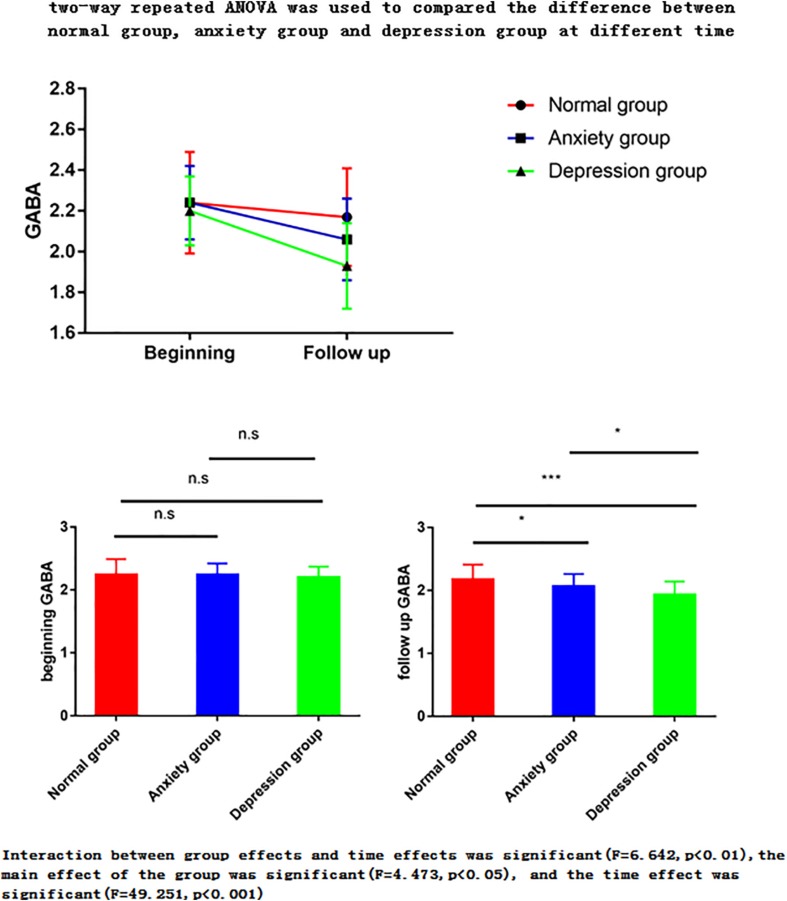
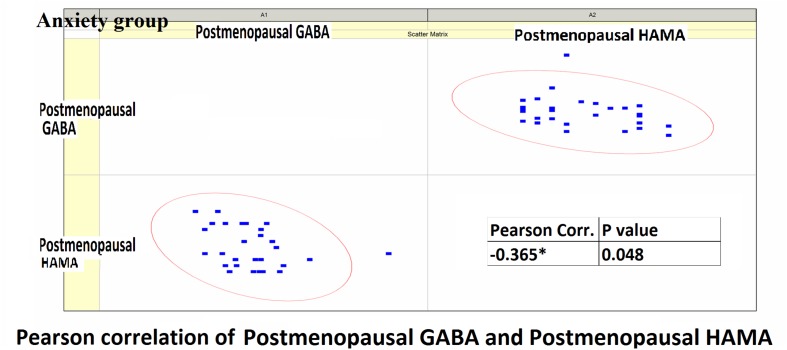
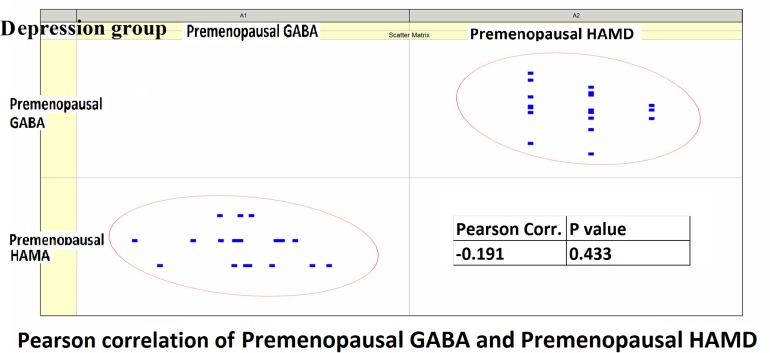
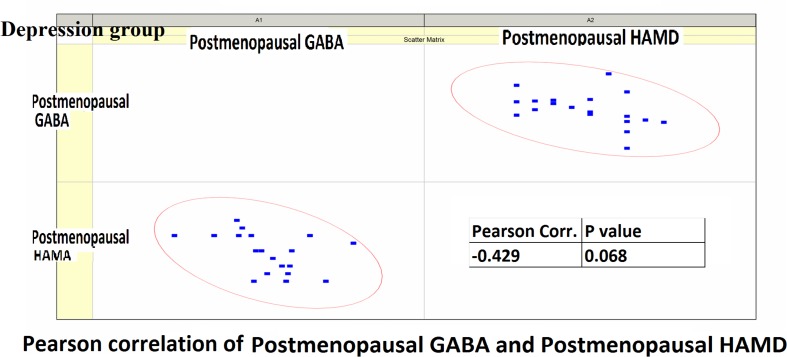
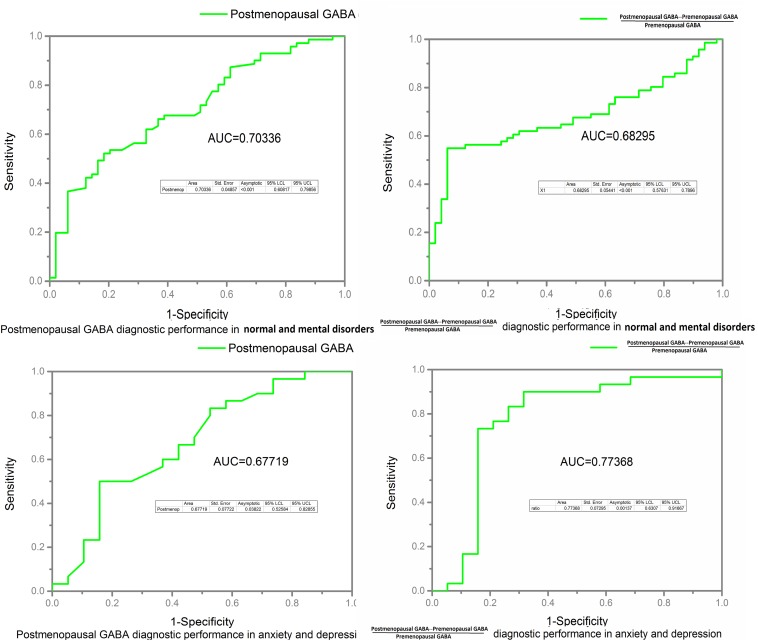
Results: GABA decreased with time. The postmenopausal GABA levels were significantly lower in the depression group than in the anxiety group and were significantly lower in both these groups than in the normal group. The postmenopausal GABA levels were significantly lower than the premenopausal levels in the normal, anxiety, and depression groups (P = 0.014, <0.001, and <0.001, respectively). The premenopausal GABA levels did not significantly differ between the normal vs. anxiety group (P = 0.907), normal vs. depression group (P = 0.495), and anxiety vs. depression group. The postmenopausal GABA levels were significantly lower in the depression group than in the anxiety group and were significantly lower in both these groups than in the normal group, normal vs. anxiety group (P = 0.022), normal vs. depression group (P < 0.001), and anxiety vs. depression group (P = 0.047).
Conclusion: Changes in GABA concentrations in the anterior cingulate cortex are related with the pathophysiological mechanism and symptoms of perimenopausal depression.
Keywords: anterior cingulate cortex; anxiety; depression; gamma-aminobutyric acid; magnetic resonance spectroscopy; postmenopausal.
Figures
References
-
- Bhagwagar Z., Wylezinska M., Jezzard P., Evans J., Boorman E., Matthews M. P., et al. (2008). Low GABA concentrations in occipital cortex and anterior cingulate cortex in medication-free, recovered depressed patients. Int. J. Neuropsychopharmacol. 11 255–260. 10.1017/s1461145707007924 - DOI - PubMed
-
- Ferolla P., Faggiano A., Grimaldi F., Ferone D., Scarpelli G., Ramundo V., et al. (2011). Shortened interval of octreotide LAR administration is effective in patients with well differentiated neuroendocrine carcinomas in progression on standard doses. J. Endocrinol. Invest. 35 326–331. 10.3275/7869 - DOI - PubMed
LinkOut - more resources
Full Text Sources