. 2019 Aug 20:13:358.
doi: 10.3389/fncel.2019.00358. eCollection 2019.

A Kinetic Map of the Homomeric Voltage-Gated Potassium Channel (Kv) Family

Affiliations

A Kinetic Map of the Homomeric Voltage-Gated Potassium Channel (Kv) Family

Rajnish Ranjan et al. Front Cell Neurosci. .

Abstract

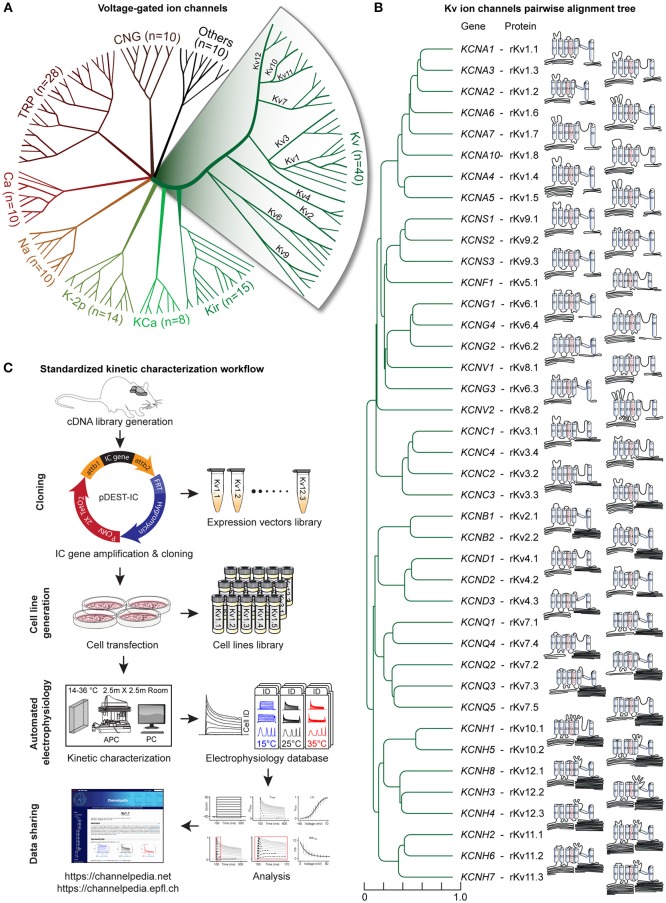
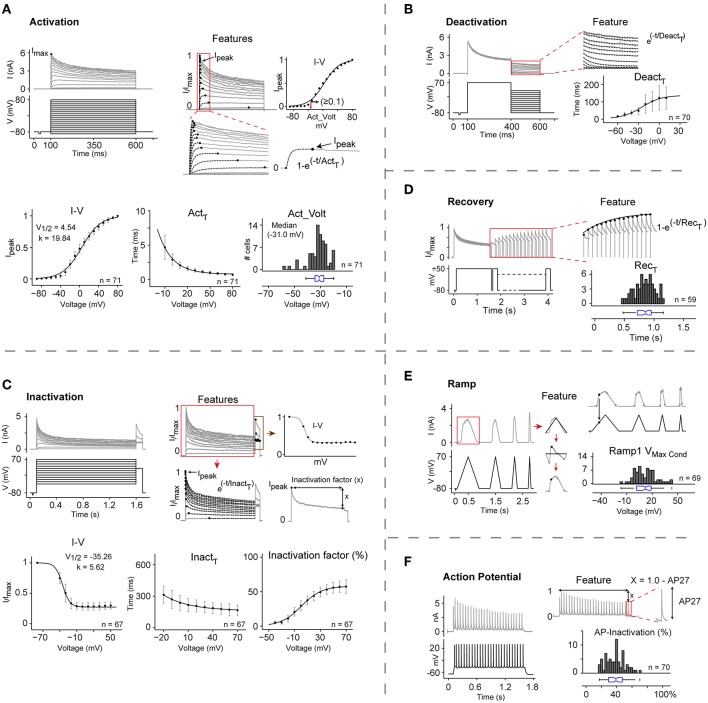
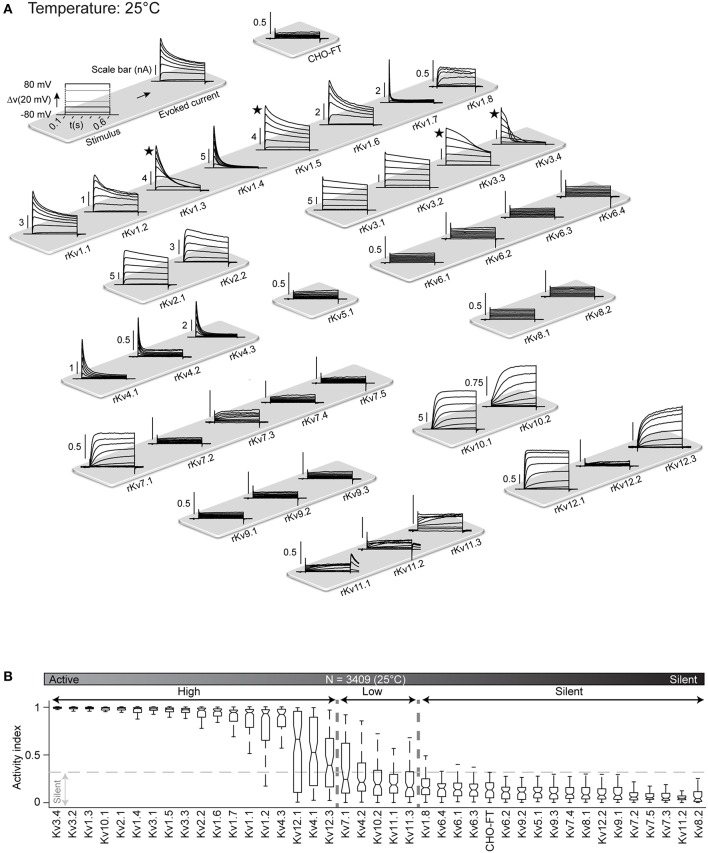
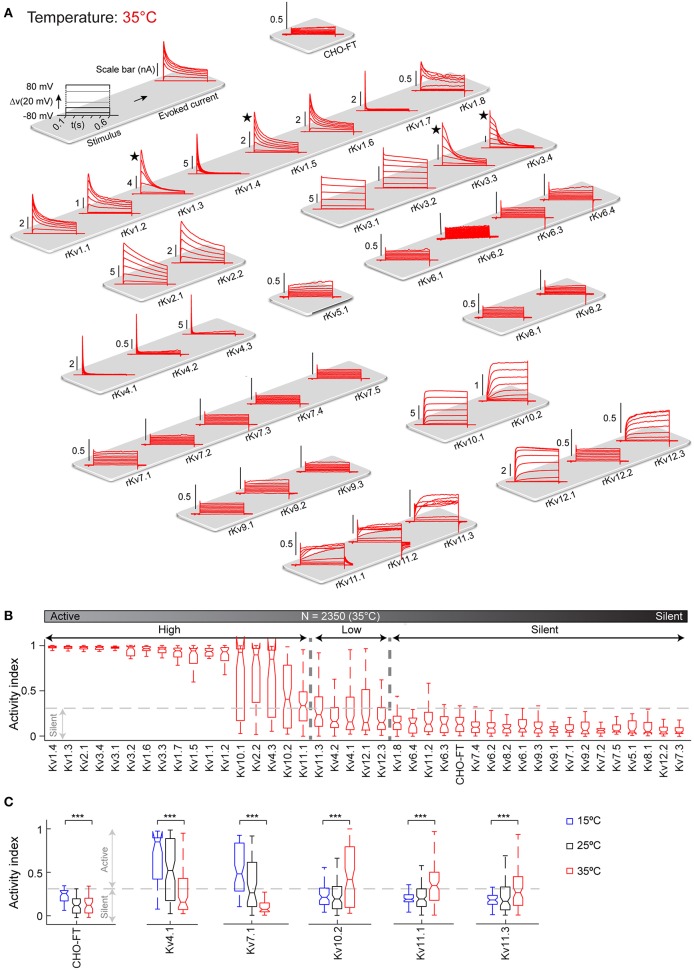
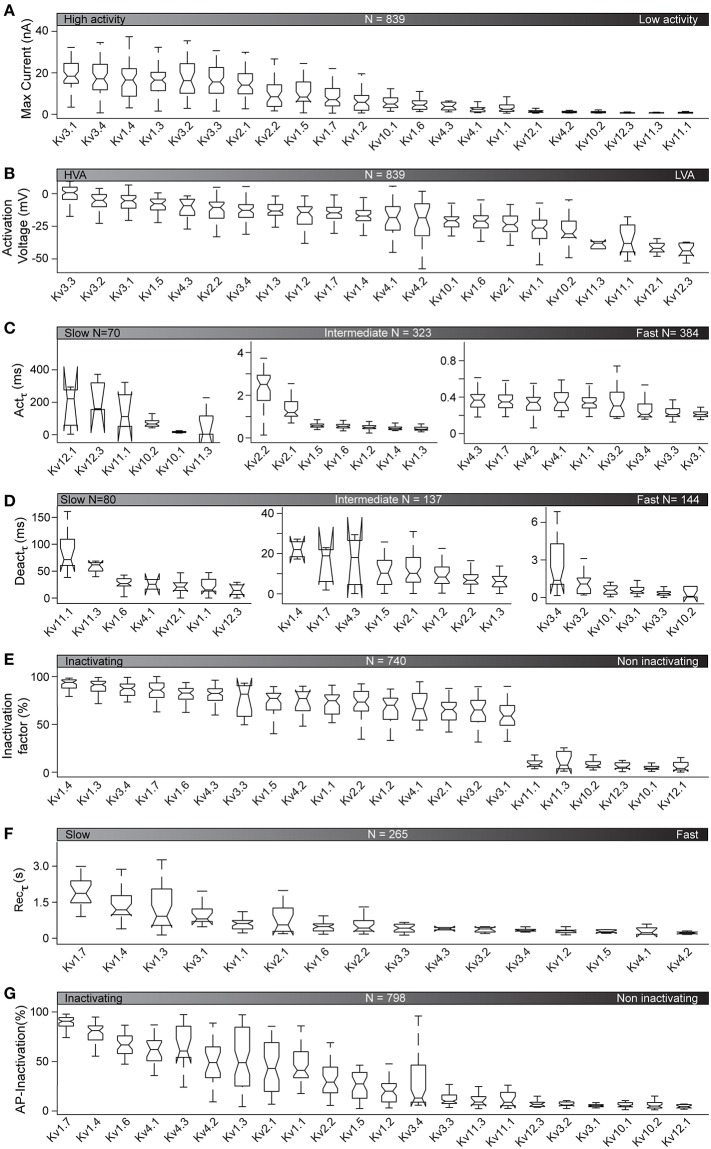
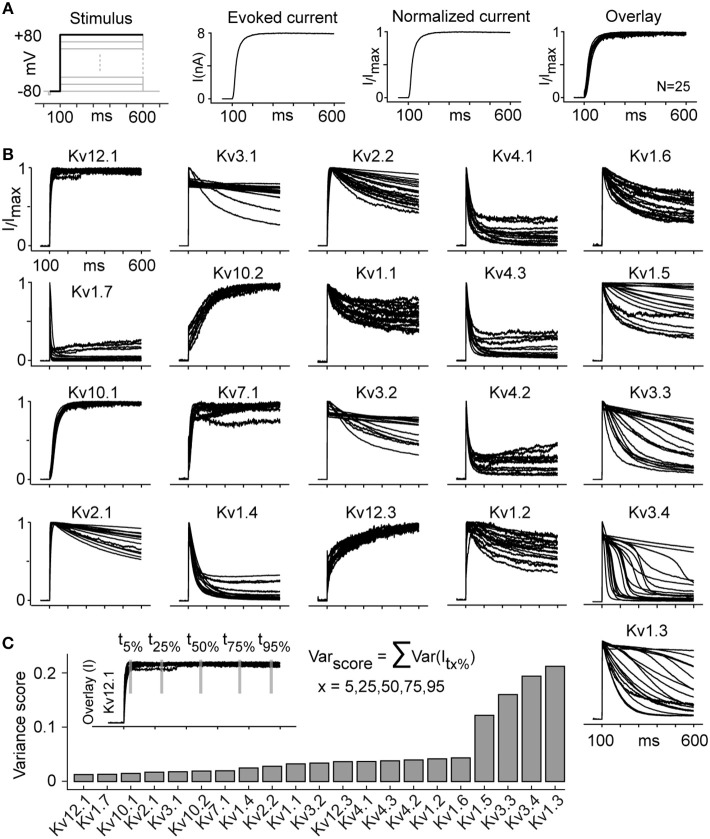
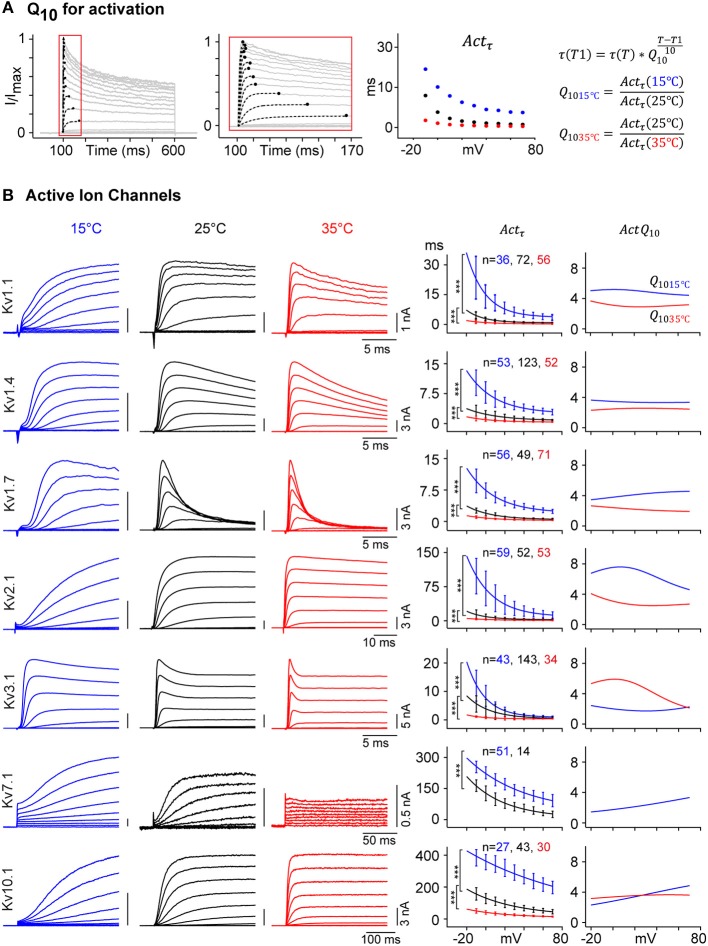
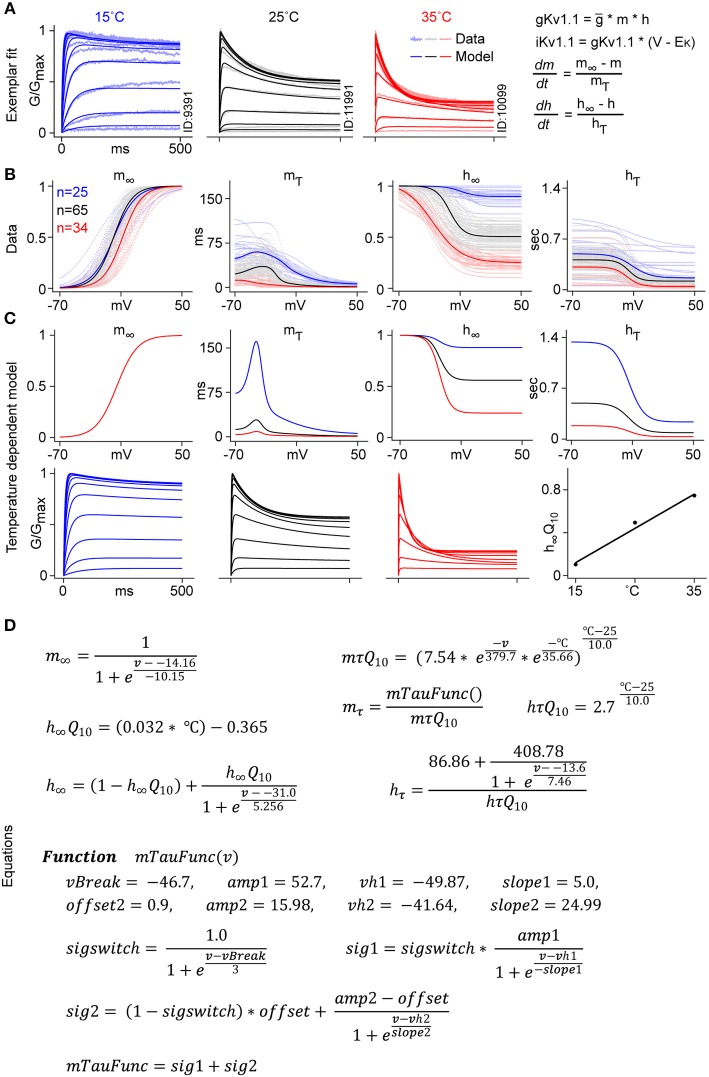
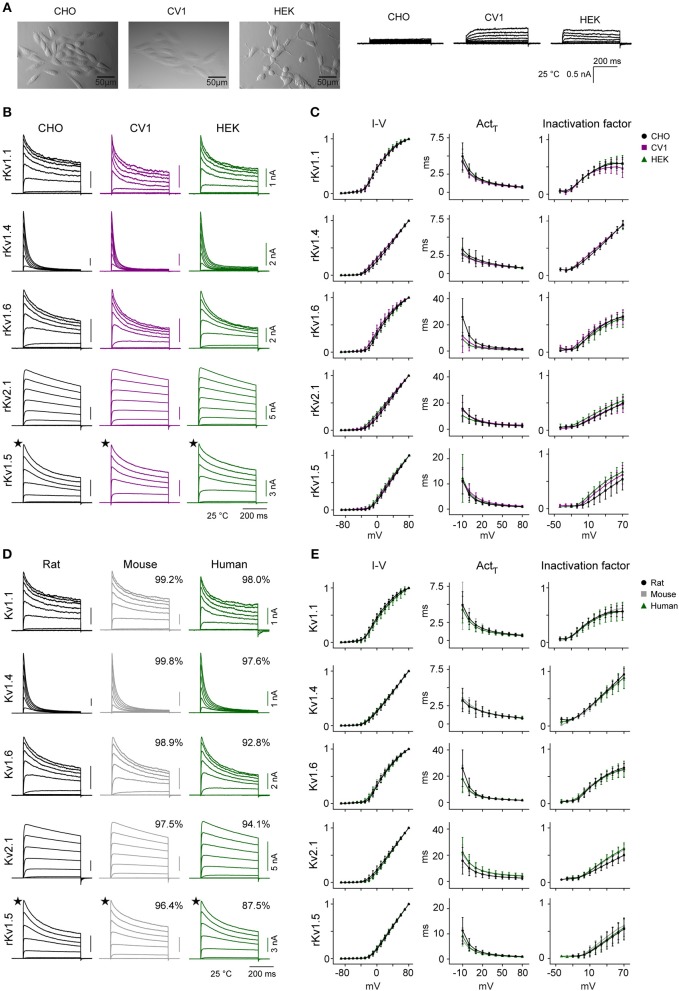
The voltage-gated potassium (Kv) channels, encoded by 40 genes, repolarize all electrically excitable cells, including plant, cardiac, and neuronal cells. Although these genes were fully sequenced decades ago, a comprehensive kinetic characterization of all Kv channels is still missing, especially near physiological temperature. Here, we present a standardized kinetic map of the 40 homomeric Kv channels systematically characterized at 15, 25, and 35°C. Importantly, the Kv kinetics at 35°C differ significantly from commonly reported kinetics, usually performed at room temperature. We observed voltage-dependent Q10 for all active Kv channels and inherent heterogeneity in kinetics for some of them. Kinetic properties are consistent across different host cell lines and conserved across mouse, rat, and human. All electrophysiology data from all Kv channels are made available through a public website (Channelpedia). This dataset provides a solid foundation for exploring kinetics of heteromeric channels, roles of auxiliary subunits, kinetic modulation, and for building accurate Kv models.

Keywords: Kv channel; Q10; automated patch clamp; database; electrophysiology; kinetics; modeling; temperature.


Figures

Figure 1
Figure 1
Voltage-gated potassium channels, kinetic characterization workflow. (A) Radial phylogenetic tree of the 145 known voltage-gated ion channel genes, where half are potassium channels (in green). Our study focuses on the 40 voltage-gated potassium (Kv) channels, divided into 12 subfamilies (expanded area). (B) Phylogenetic tree obtained from pairwise alignment of the coding sequences of isoform1 of all rat Kv channel genes; scale represents normalized phylogenetic distance; the corresponding Kv protein names are indicated (prefix r stands for rat). The schematic and scaled depiction of the protein structure of each Kv channel is based on the amino acid length of each domain. (C) Standardized workflow for Kv channels kinetic characterization. Each Kv gene is amplified from a rat brain cDNA library and cloned in a mammalian-expression vector (Table S6), building a library of expression vectors. A library of stable cell lines is generated after transfection of each expression vector in host cell lines (CHO, HEK, or CV1; See also Figures S1, S2 and Table S7). The kinetics of each cell line is characterized using an automated patch clamp setup (APC) in a dedicated temperature-controlled room (14–36°C; Table S8). Each recorded cell is assigned a unique ID (Cell ID). Electrophysiology data are analyzed, stored and shared through the “Channelpedia” website.
Figure 2
Figure 2
Automated kinetic characterization of CHO rKv1.1 at 25°C. (A–F) The kinetic properties of rat Kv1.1 channel in CHO cells are extracted from the current response of six different voltage protocols: Activation, Deactivation, Inactivation, Inactivation recovery, and two in vivo-like stimuli, Ramp, and Action potential. Each panel shows the applied voltage stimulus (black traces), representative traces of the current responses (gray traces), region of interest for analysis (red box), and extracted features. For all analysis, current traces are first normalized to overall maximum current (Imax). All data are presented as means ± S.D. (A) I-V curve, activation voltage (Act_Volt), and activation time constant (Actτ) are extracted for all cells (n = 71). Peak current (Ipeak) for each trace is identified and plotted against command voltage to get I-V curve (top right panel). For each cell the voltage where normalized current (Ipeak) exceeds 0.1 in I-V curve is considered as the activation voltage (red arrow). Actτ is calculated by fitting single exponential curve from 0 to Ipeak for each current trace. Ipeak and Actτ from each cell are plotted and fitted with Boltzmann and single exponential function, respectively to get mean I-V curve and mean Actτ. (B) Deactivation time constant (Deactτ) for each trace is calculated by fitting a single exponential to current response during the second stimulus pulse (400–600 ms) and then plotted against command voltage (n = 70). (C) Inactivation curve, time constant (Inactτ), and inactivation factor are features extracted for all cells (n = 67). Ipeak from the second stimulus pulse (red box) are plotted against command voltage to get Inactivation curve. Inactτ is calculated by fitting a single exponential to each current trace from Ipeak to the end of the first stimulus pulse. Inactivation factor (x) is the difference from Ipeak to the end of the first stimulus pulse. Inactivation I-V, Inactτ, and Inactivation factors from all cells are averaged and plotted against command voltage and fitted with Boltzmann, single exponential, and Boltzmann function, respectively. (D) Inactivation recovery time constant (Recτ) is obtained by fitting a single exponential function to the peak current values of the responses to recovery pulses (red box) (n = 59). (E) Maximum conductance (Vmax_Cond) is calculated on the rising phase of the first Ramp (n = 69). (F) AP-Inactivation is measured by subtracting last AP (AP27) amplitude from normalized maximum value (1) (n = 70). Act_Volt, Recτ, Vmax_Cond, and AP-inactivation values for cell population are reported with histograms and box plots.
Figure 3
Figure 3
Kv channels kinetic map at 25°C. (A) Illustration of activation stimulus with 20 mV steps and evoked current response are shown (top left panel). The amplitude is indicated in nA with scale bar. The non-transfected CHO-FT cell line is shown as control for the background current (top right panel). Representative traces of the typical response to activation stimulus for each Kv channel, recorded at 25°C, is shown. Current traces are sorted by Kv subfamily. ★ indicates a channel with inherent kinetic heterogeneity (see also Figure 6); for these channels, only one from a range of recorded responses is shown. (B) Box plots of AI values for each Kv channel at 25°C; ion channels are ordered by their median AI values and categorized as active or silent based on the 0.3 cut-off value for the 3rd quartile of the box plot (N = 3,409 cells). Active channels are further divided into highly active or low active based on 0.3 cut-off value for the median value of the box plot.
Figure 4
Figure 4
Kv channels kinetic map at 35°C. (A) Illustration of activation stimulus with 20 mV steps and evoked current response are shown (top left panel). The amplitude is indicated in nA with scale bar. The non-transfected CHO-FT cell line is shown as control for the background current (top right panel). Representative traces of the typical response to activation stimulus for each Kv channel, recorded at 35°C is shown. Current traces are sorted by Kv subfamily. ★Indicates a channel with inherent kinetic heterogeneity (see also Figure 6); for these channels only one response from the range of recorded responses is shown. (B) Box plots of AI values for each ion channel at 35°C; ion channels are ordered by their median AI values and categorized as active or silent based on the 0.3 cut-off value for the 3rd quartile of the box plot (N = 2,350 cells). Active channels are further divided into highly active or low active based on 0.3 cut-off value for the median value of the box plot. (C) AI values at 15°C (blue), 25°C (black), and 35°C (red) are plotted for Kv channels that show significant change in activity over temperature. AI values for the non-transfected CHO-FT cell line is plotted as a control (see also Figure S9). ***p < 0.001, Student's t-test.
Figure 5
Figure 5
Kinetic properties of active Kv channels at 35°C. Kinetic features, analyzed as illustrated in Figure 2, are plotted for the 22 active Kv channels at 35°C (see Figure 4B). Features are represented as box plots for each ion channel and sorted by their median values. N is the total number of cells used for the analysis of each feature (see also Table S5 for detailed cell counts of each group). (A–G) Kv responses to the activation stimulus are analyzed to get maximum current response (A), activation voltage (HVA = high voltage activation, LVA = low voltage activation) (B), and activation time constant for V = +50 mV (C) (see also Figure S10). Kv responses to the deactivation protocol are analyzed for deactivation time constant for V = −30 mV (D). Responses to the inactivation protocol are analyzed to calculate inactivation factor values at V = +70 mV (E). The 16 inactivating Kv channels (Kv1.4 to Kv3.1) from (E) are further analyzed to compare time constants for recovery after inactivation (F). Responses to AP-like stimuli are analyzed for AP-inactivation (G).
Figure 6
Figure 6
Kv channels kinetic heterogeneity (see also Figure S11). (A) The evoked current trace corresponding to the activation stimulus at +80 mV is normalized to maximum current for each cell. The overlay plot presents the normalized currents from 25 cells that statistically represent the whole group (same variance). (B) Overlay plots as described in panel A are shown for all active channels at 25°C (Kv11.1 and Kv11.3 are not included due to low current and high noise). The overlay plots visually represent the kinetic heterogeneity. (C) Kinetic heterogeneity is quantified by calculating Varscore, obtained by summing five variances of normalized currents evaluated at five time points for all cells of a given cell line, as shown for Kv12.1 as an example. The channels that show the highest heterogeneity (highest Varscore) are Kv1.3, Kv1.5, Kv3.3, and Kv3.4. The number of cells (N) for each group is listed in Table S5.
Figure 7
Figure 7
Temperature dependence of Kv channel kinetics. (A) Voltage-dependent Actτ is measured as shown in Figure 2. Q10 of Actτ is calculated for 15 and 35°C, with 25°C as a reference. (B) Representative current traces for selected Kv channels in response to activation protocol at 15°C (blue), 25°C (black), and 35°C (red) are shown (left panels), the amplitude in nA and time in ms are indicated with scale bars. Single exponential curve is fitted to the median value of Actτ for each of the three temperatures (middle panel, solid line; ***p-value < 1e-5, Student's t-test). For each selected Kv channel, Q10 values for 15°C (blue) and 35°C (red) are plotted against command voltage (right panel). For a given Kv channel, Q10 value is different for different temperature range and vary between 2 and 8 across different voltages. For Kv7.1, which becomes electrically silent at 35°C, Actτ and Q10 values for 35°C are not plotted. Error bars are ± S.D.
Figure 8
Figure 8
Kv1.1 temperature-dependent H-H modeling. (A) Kv1.1 CHO cells recorded from three different temperatures are used for H-H model fitting. An example of the fit to normalized conductance for cells recorded at three different temperatures, 15°C (blue), 25°C (black), and 35°C (red) is shown (see Methods “H-H model fitting”). (B) Voltage-dependent m, h, mτ, hτ parameters are plotted (in dots) for all fitted cells. Median values, fitted with a smooth function, are represented with solid lines. (C) Voltage dependence of the m parameter is approximated with a single Boltzmann function for all three temperatures. mτ is fitted with voltage and temperature-dependent Q10. The steady state value of h is computed using the temperature-dependent linear function hQ10. hτ is fitted to a Boltzmann curve with a constant Q10 value of 2.7. (D) Equations used to fit the temperature-dependent Kv1.1 model.
Figure 9
Figure 9
Kv channel kinetics across host cell lines and species at 25°C. (A–C) Comparison of Kv kinetics across three mammalian host cell lines. (A) Pictures showing the morphology of the three adherent host cell lines (CHO, HEK, and CV1) used in the study, with their corresponding endogenous outward currents in response to the activation protocol at 25°C. (B) Representative current traces from rat Kv1.1, Kv1.4, Kv1.6, Kv2.1, and Kv1.5 expressed in the three different cell lines, in response to activation protocol at 25°C. (C) Median values for three kinetic features (I-V curve, activation time constant, and inactivation factor calculated as explained in Figure 2) obtained from CHO, CV1, and HEK host cell lines for each Kv channel, overlaid for comparison. (D,E) Comparison of Kv kinetics across three species. (D) Representative current traces for rat, mouse, and human Kv1.1, Kv1.4, Kv1.6, Kv2.1, and Kv1.5 expressed in CHO cells, in response to activation protocol at 25°C. The percentage of homology compared to rat are shown in box above current traces (see also Table 4). (E) Median values for three kinetic features (I-V curve, activation time constant, and inactivation factor calculated as explained in Figure 2) obtained from rat, mouse, and human genes of each Kv channel, overlaid for comparison. Error bars are ± S.D. The amplitude in nA and time in ms are indicated with scale bars. ★: For Kv1.5, only one representative trace from a range of responses is shown. The number of cells (N) for each group is listed in Table S5.

References

    1. Adams D. J., Oxford G. S. (1983). Interaction of internal anions with potassium channels of the squid giant axon. J. Gen. Physiol. 82, 429–448. 10.1085/jgp.82.4.429 - DOI - PMC - PubMed
    1. Alberts B., Wilson J. H., Hunt T. (eds.). (2008). Molecular Biology of the Cell, 5th Edn. New York, NY: Garland Science.
    1. Aromolaran A. S., Subramanyam P., Chang D. D., Kobertz W. R., Colecraft H. M. (2014). LQT1 mutations in KCNQ1 C-terminus assembly domain suppress IKs using different mechanisms. Cardiovasc. Res. 104, 501–511. 10.1093/cvr/cvu231 - DOI - PMC - PubMed
    1. Bähring R., Vardanyan V., Pongs O. (2004). Differential modulation of Kv1 channel-mediated currents by co-expression of Kvbeta3 subunit in a mammalian cell-line. Mol. Membr. Biol. 21, 19–25. 10.1080/09687680310001597749 - DOI - PubMed
    1. Barhanin J., Lesage F., Guillemare E., Fink M., Lazdunski M., Romey G. (1996). K(V)LQT1 and lsK (minK) proteins associate to form the I(Ks) cardiac potassium current. Nature 384, 78–80. 10.1038/384078a0 - DOI - PubMed

LinkOut - more resources