. 2019 Aug 20:13:44.
doi: 10.3389/fnint.2019.00044. eCollection 2019.

The Sound of Scotoma: Audio Space Representation Reorganization in Individuals With Macular Degeneration

Affiliations

The Sound of Scotoma: Audio Space Representation Reorganization in Individuals With Macular Degeneration

Hafsah Ahmad et al. Front Integr Neurosci. .

Abstract

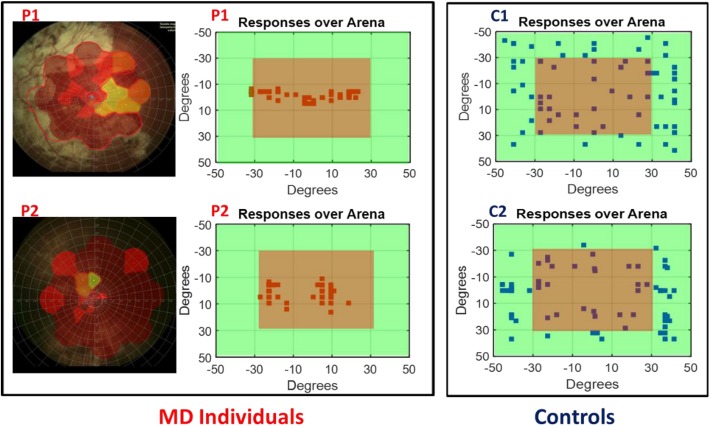
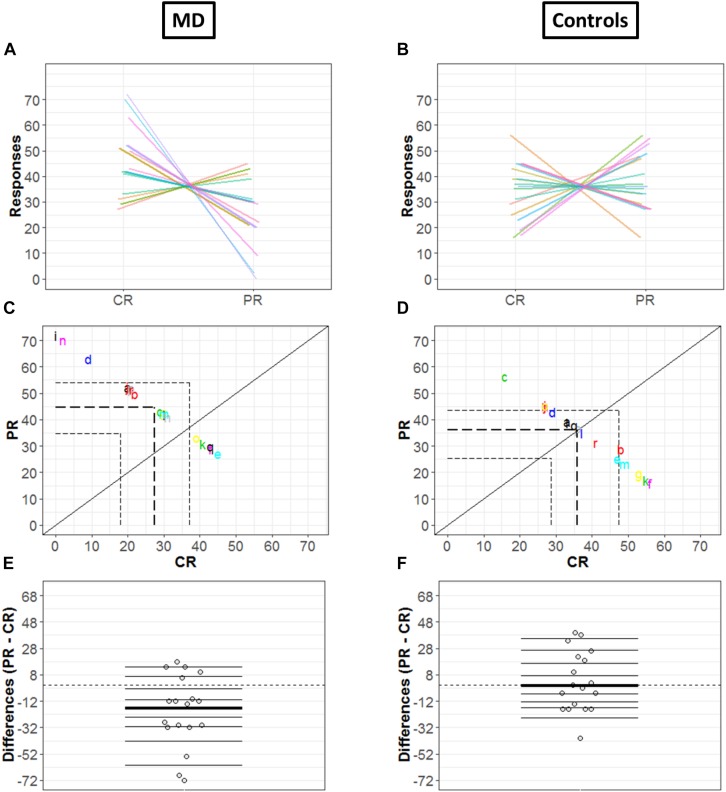
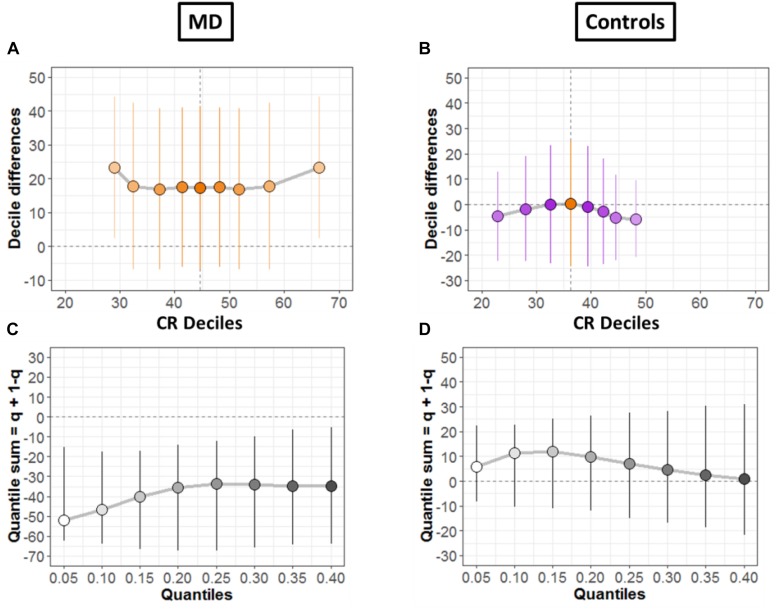
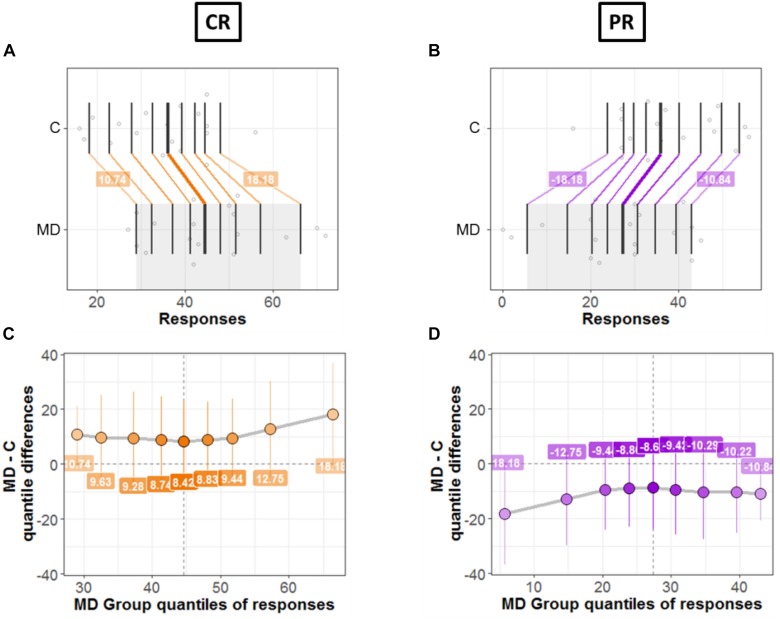
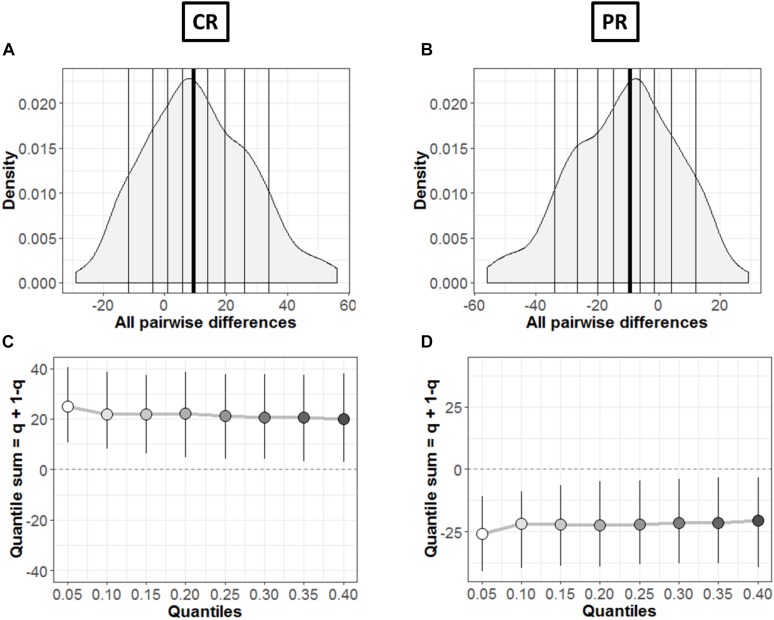
Blindness is an ideal condition to study the role of visual input on the development of spatial representation, as studies have shown how audio space representation reorganizes in blindness. However, how spatial reorganization works is still unclear. A limitation of the study on blindness is that it is a "stable" system and it does not allow for studying the mechanisms that subtend the progress of this reorganization. To overcome this problem here we study, for the first time, audio spatial reorganization in 18 adults with macular degeneration (MD) for which the loss of vision due to scotoma is an ongoing progressive process. Our results show that the loss of vision produces immediate changes in the processing of spatial audio signals. In individuals with MD, the lateral sounds are "attracted" toward the central scotoma position resulting in a strong bias in the spatial auditory percept. This result suggests that the reorganization of audio space representation is a fast and plastic process occurring also later in life, after vision loss.

Keywords: PRL; audio-space representation; macular degeneration; multi-sensory integration; scotoma.


Figures

FIGURE 1
FIGURE 1
The device and simulation of device.
FIGURE 2
FIGURE 2
Subject responses. Left, example of retinal maps for two MD individuals (P1 and P2). The central red area indicates the damaged retina, yellow for partially damaged retina, and green for the leftover healthy part of the retina. Center, example of the responses of the same two MD individuals (P1 and P2) for sound localization. Sounds were equally distributed on the surface of the device, but their responses were mainly localized in the central region (in red) indicating the position of their scotoma. Right, example of the responses of two age sighted participants (C1 and C2) for sound localization. Responses are equally distributed on the surface.
FIGURE 3
FIGURE 3
Comparison between controls and MD considering CR and PR. Results show that the MD participants (right side) are more attracted toward the central speakers (red bars). This attraction is higher compared to the one showed by the sighted (left side) which provided responses equally distributed for central and peripheral regions. Significance between groups; ∗∗Significance with-in group.
FIGURE 4
FIGURE 4
Differences in CR and PR for MD (A) and controls (B) groups. (A,B) Strip chart of two distributions. Each circle represents one participant, horizontal lines shows the deciles and thicker line show the median. The dotted line corresponds to zero.
FIGURE 5
FIGURE 5
Differences in CR and PR for MD (left panel) and controls (right panel) groups. (A,B) Pairwise observations. Paired observations of each subject are joined by a single line of a different color. (C,D) Scatter plot. The diagonal black line shows reference with no effect; CR = PR (slope = 1, intercept = 0). Colored letters show the scattered data points and dashed line show quartiles for each condition. (E,F) Strip chart of difference responses. Each circle represents the difference between conditions for one participant. Deciles are shown by horizontal lines; the thicker line shows the median.
FIGURE 6
FIGURE 6
Differences between conditions. (A,B) Shift function with 95% confidence intervals. (C,D) Difference asymmetry function with 95% confidence intervals computed via bootstraps technique.
FIGURE 7
FIGURE 7
Differences between groups; MD and Controls for CR (left panel) and PR (right panel). (A,B) Strip charts for marginal distributions. Vertical lines mark the deciles for each group with a thicker line marking the median. Among distributions, the colored lines join the matching deciles (orange for positive decile differences and purple for negative values). (C,D) Shift function. Decile differences are shown with MD group deciles on x-axis and decile difference (MD-C) on y-axis. The vertical lines show the 95% bootstrap confidence interval. The first and the last deciles in both figures do not cross zero, hence they are considered significant.
FIGURE 8
FIGURE 8
Comparison between groups. (A,B) Kernel density depiction of the distribution of all pairwise differences amongst the two groups. Deciles are marked by vertical lines with a thicker line for median. (C,D) Difference asymmetry function using 95% confidence intervals. The pair-wise error is controlled by altering the critical p-values with Hochberg’s method; the confidence intervals are not adjusted.
FIGURE 9
FIGURE 9
Hits and misses chart. CS, central stimuli; PS, peripheral stimuli; CR, central stimuli; PR, peripheral stimuli. The values are represented as percentage; For CS, total number of responses corresponding to CS/Total number of trials for CS; For PS, total number of responses corresponding to PS/Total number of trials for PS. (A) MD group. (B) Control group.
FIGURE 10
FIGURE 10
Pearson’s Correlations. The black dots represent data points; the black solid line represents regression line, the black dashed line shows 50% and the gray area show 95% confidence interval. (A) Correlation between onset age (age – duration) and percentage of CR (CR/72 100). (B) Correlation between scotoma duration and percentage of CR. (C) Correlation between age of MD group and percentage of CR. (D) Correlation between age of controls group and percentage of CR.

References

    1. Abboud S., Cohen L. (2018). Distinctive interaction between cognitive networks and the visual cortex in early blind individuals. bioRxiv 437988. 10.1093/cercor/bhz006 - DOI - PubMed
    1. Alais D., Burr D. (2004). The ventriloquist effect results from near-optimal bimodal integration. Curr. Biol. 14 257–262. 10.1016/s0960-9822(04)00043-0 - DOI - PubMed
    1. Amedi A., Stern W. M., Camprodon J. A., Bermpohl F., Merabet L., Rotman S., et al. (2007). Shape conveyed by visual-to-auditory sensory substitution activates the lateral occipital complex. Nat. Neurosci. 10 687–689. 10.1038/nn1912 - DOI - PubMed
    1. Chebat D.-R., Harrar V., Kupers R., Maidenbaum S., Amedi A., Ptito M. (2018). “Sensory substitution and the neural correlates of navigation in blindness,” in Mobility of Visually Impaired People, eds Pissaloux E., Velazquez R. (Cham: Springer; ), 167–200. 10.1007/978-3-319-54446-5_6 - DOI
    1. Chen F. K., Patel P. J., Xing W., Bunce C., Egan C., Tufail A. T., et al. (2009). Test–retest variability of microperimetry using the Nidek MP1 in patients with macular disease. Invest. Ophthalmol. Vis. Sci. 50 3464–3472. - PubMed

LinkOut - more resources