. 2019 Aug 20:6:56.
doi: 10.3389/fmolb.2019.00056. eCollection 2019.

Visualizing Proteasome Activity and Intracellular Localization Using Fluorescent Proteins and Activity-Based Probes

Affiliations

Visualizing Proteasome Activity and Intracellular Localization Using Fluorescent Proteins and Activity-Based Probes

Sabine Schipper-Krom et al. Front Mol Biosci. .

Abstract

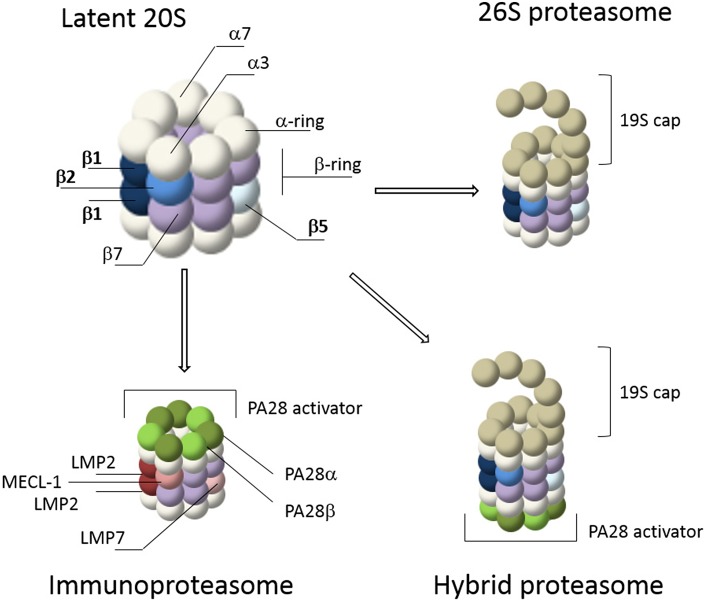
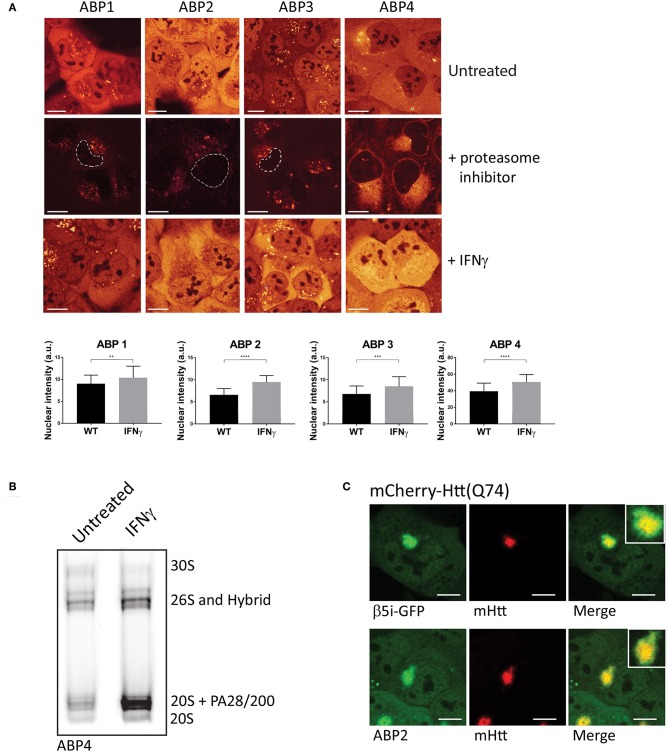
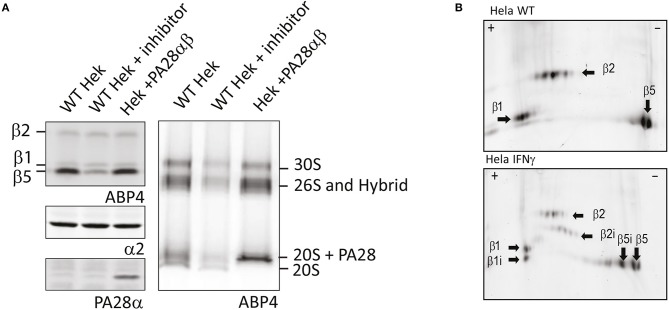
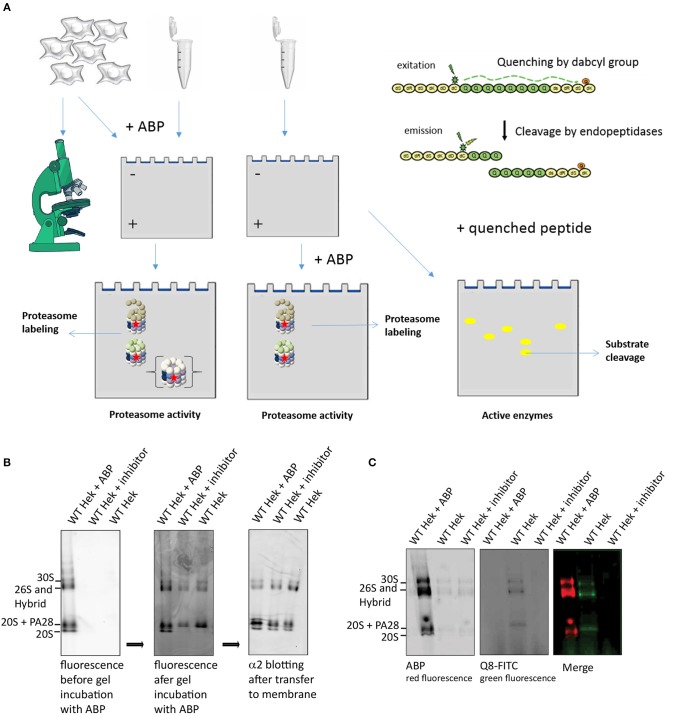
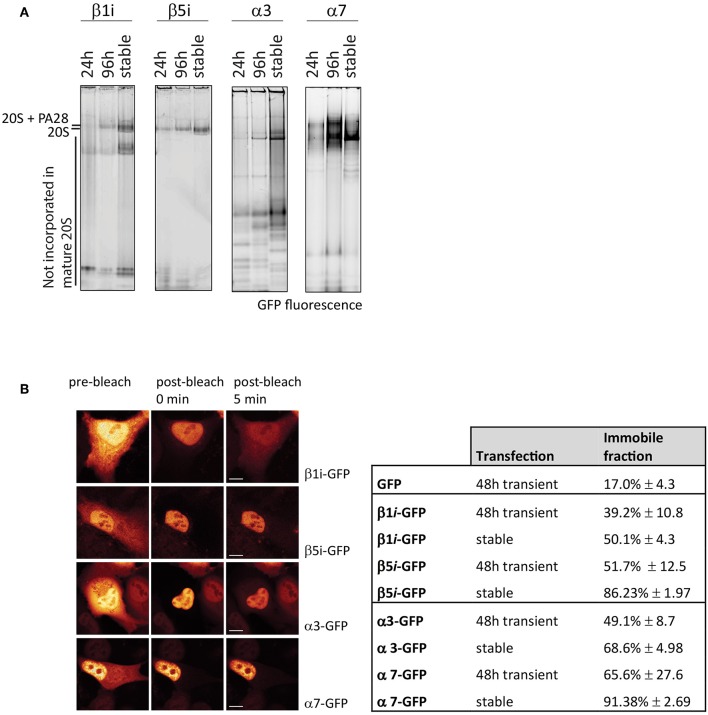
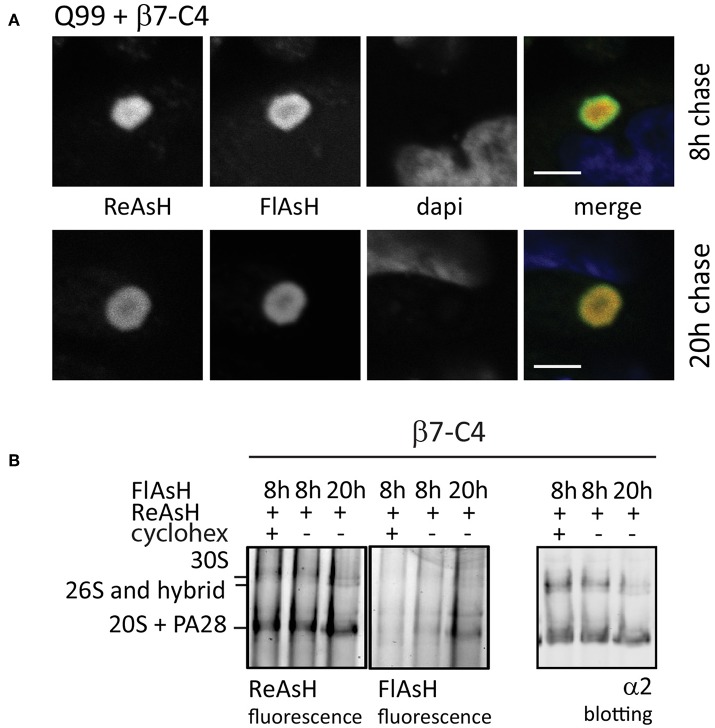
The proteasome is a multi-catalytic molecular machine that plays a key role in the degradation of many cytoplasmic and nuclear proteins. The proteasome is essential and proteasome malfunction is associated with various disease pathologies. Proteasome activity depends on its catalytic subunits which are interchangeable and also on the interaction with the associated regulatory cap complexes. Here, we describe and compare various methods that allow the study of proteasome function in living cells. Methods include the use of fluorescently tagged proteasome subunits and the use of activity-based proteasome probes. These probes can be used in both biochemical assays and in microscopy-based experiments. Together with tagged proteasomes, they can be used to study proteasome localization, dynamics, and activity.

Keywords: activity probes; dynamics; fluorescence; living cells; proteasome.


Figures

Figure 1
Figure 1
Proteasome composition. The 20S core of the proteasome consists of 4 stacked rings. The outer rings contain seven α-subunits (white) while the inner rings contain seven β-subunits (purple). The catalytic subunits, β1, β2, and β5, are depicted in shades of blue. Gate opening of the 20S core occurs via capping by proteasome activators such as the 19S cap or PA28. The 19S cap is the most abundant activator and it forms the 26S proteasome together with the 20S core. This is a simplified illustration of the 26S cap, a more detailed representation is reviewed elsewhere (Lander et al., ; Collins and Goldberg, 2017). IFN-γ stimulation induces de novo formation of immunoproteasomes, including 26S immunoproteasomes, containing the immune subunits β1i (LMP2), β5i (LMP7), and β2i (MECL-1) (shades of red), as well as proteasome activation by PA28αβ (shades of green). Together these caps form hybrid proteasomes. In addition, proteasomes can also form complexes with the nuclear activation caps PA200 and PA28γ (not shown).
Figure 2
Figure 2
Schematic representation of ABP reaction mechanism. (A) Schematic representation of a proteasome activity-based probe (ABP). Labeling of active proteasomes occurs via a nucleophilic attack of the proteasome active threonine residue at the electrophilic trap of the ABP, which in turn captures the catalytic threonine via a covalent bond. A fluorophore can be connected to the probe via a linker for visualization. (B) Reaction mechanisms of epoxyketone (upper) (Borissenko and Groll, ; Schrader et al., 2016) and vinyl-sulphone (lower) (Borissenko and Groll, 2007). Electrophilic traps react with the N-terminal Threonine residue of the proteolytically active β-subunits. The sphere represents the remainder of the β-subunit. A seven membered ring has been observed by crystallographic methods for the epoxyketone. The vinyl sulphone creates a single covalent ether bond with the N-terminal threonine nucleophile.
Figure 3
Figure 3
Visualizing proteasome activity in living cells. (A) Proteasome activity labeling in living cells by different probes. U2OS cells were incubated with vinyl sulphone (ABP1, green and ABP3, red) and epoxomicin (ABP2, green and ABP4, yellow) based probes (upper panel). Pre-incubation with epoxomycin to block proteasome activity was used to determine nonspecific binding (middle panel). Epoxomycin-based probes give more intense labeling pattern, while the Cy3 fluorophore gives more background staining. When U2OS cells were stimulated for 72 h with IFN-γ, subsequent activity labeling showed a significant increase in labeling (lower panel, graphs). (B) U2OS cells were stimulated with IFN-γ, labeled with ABP4 and analyzed by native PAGE, confirming increased ABP labeling as shown by microscopy. (C) Recruitment of active proteasomes into aggregates. U2OS cells were transfected with polyglutamine-expanded huntingtin fragments to initiate aggregation, and co-transfected with β5i-GFP to show proteasome distribution around aggregates. Incubation with ABP2 showed a similar distribution pattern as β5i-GFP, indicating the recruitment of catalytically active proteasomes into aggregates. Scale bar = 5 μm.
Figure 4
Figure 4
Proteasome activity labeling in cell lysates. (A) Activity labeling of individual subunits vs. proteasome complexes. Control cell lysates, lysates pre-incubated with MG132 and lysates of cells overexpressing PA28αβ were incubated with ABP4 and loaded on SDS-PAGE (left) or 3–12% native gels (right). Wet gels slabs were scanned for activity labeling and intensities were determined using AlphaEase software. After transfer to membranes, anti-α2 antibodies were used to identify proteasome complexes and PA28α antibodies were used to show PA28 over-expression. Expression of PA28αβ induced a shift in proteasome activity toward PA28-capped proteasomes. (B) Visualizing activity of constitutive and immunosubunits on 2D gels. Cell lysates of control Hela cells and IFN-γ stimulated HeLa cells were incubated with ABP4, subjected to pH 3–10 strips to separate proteins in the first dimension. Subsequently, proteins were separated by size in the second dimension on a 12% SDS-PAGE gel. Fluorescence scanning revealed the labeled subunits. Unlike visualization on a one dimention SDS gel, the activity of all six catalytic subunits could be visualized individually.
Figure 5
Figure 5
Proteasome activity labeling in gel. (A) A schematic representation of methods to visualize proteasome activity, either by microscopy or by in gel visualization. The left panel represents methods to detect ABP labeling and the right panel explains the use of quenched substrates to determine proteasome specificity. (B) Proteasome labeling in gel. HEK293 cell lysate was divided in three fractions, one fraction was pre-incubated with ABP4 for identification of proteasome complexes, one fraction was pre-incubated with proteasome inhibitor to determine specificity and one sample was left untreated. Upon complex separation by a 3–12% native gradient gel, the wet gel slabs were scanned for fluorescence (left panel). Subsequently, the gel was incubated with buffer containing ABP4 and again scanned for fluorescence (middle panel). After protein transfer to a PVDF membrane, α2-antibodies confirmed the presence of all proteasome complexes in each lysate. Differences in proteasome labeling were observed between the lysates, since in gel labeling only revealed proteasomes capped with a proteasome activator. (C) Quenched peptide substrates to determine proteasome specificity in gel. HEK293 cell lysates were divided in three fractions, one fraction was pre-incubated with ABP4 for identification of proteasome complexes, one sample was left untreated and one fraction was pre-incubated with proteasome inhibitor to determine specificity of the fluorescent degradation signal. After complex separation in the gel, the gel was incubated in buffer containing quenched polyglutamine peptides (Q8-FITC) that become fluorescent after cleavage. Merging the two images shows a proteasome cleavage pattern of the Q8-peptide.
Figure 6
Figure 6
Incorporation of GFP-tagged proteasome subunits. (A) Incorporation of transient and stably expressed proteasome subunits. The α-subunits α3-GFP and α7-GFP were expressed in U2OS cells and β1i and β5i were expressed in HeLa cells, either stable or transient for 24 h or 96 h. GFP-tagged subunits were identified by scanning for fluorescence. Stable expression of subunits α3, α7, and β1i did not further improve incorporation when compared to 96 h transient expression. (B) Fluorescence loss in photobleaching (FLIP) to distinguish non-incorporated from incorporated GFP-tagged subunits. By photobleaching the entire cytoplasm, the small GFP-tagged subunits that freely diffuse between nucleus and cytoplasm also become photobleached, while GFP-tagged proteasomes in the nucleus remain fluorescent. Cells, either transiently transfected for 48 h or stably expressing the proteasome subunits, were analyzed for free diffusion of non-incorporated subunits by photobleaching the entire cytoplasm and quantifying the decrease in fluorescence in the nucleus. The immobile fraction is the remaining percentage of fluorescence in the nucleus, representing large GFP-tagged proteasome complexes. Nuclear fluorescence of β1i-GFP and to a lesser extent α3-GFP decreases in time, indicating a substantial non-incorporated pool of GFP-tagged subunits (mean ± SD, N = 5). Scale bar = 5 μm.
Figure 7
Figure 7
Fluorescence pulse-chase experiments to visualize proteasome dynamics. (A) Reversible recruitment of proteasomes into aggregates. HeLa cells were transfected with untagged Q99 peptides to initiate aggregation and co-transfected with proteasome subunit β7-C4 to visualize proteasomes. After 48 h expression, β7-C4 was stained with ReAsH followed by FlAsH labeling 8 or 20 h to specifically label the newly synthesized pool of proteasomes. Merging of the fluorescent proteasome labeling showed a partial overlap at 8 h (upper panel) and a complete overlap at 20 h afterwards (lower panel). These findings indicate that proteasomes have slow but reversible dynamics in aggregates. (B) Specific proteasome labeling by biarsenical dyes. Cells expressing β7-C4 were stained according to the same procedure a mentioned above. Additionally, cycloheximide was added after ReAsh staining to prevent synthesis of new C4-tagged proteasome subunits. After FlAsH staining, cells were harvested and subjected to a 3–12% native gel for complexes separation and subsequently scanned for fluorescence. Specific proteasome labeling by both ReAsH and FlAsH was confirmed since these complexes run similar to proteasome complexes that were probed with an α2-antibody. FlAsH staining intensified when labeling was performed after a longer chase period due to longer expression. When cycloheximide was added, FlAsH labeling was absent. Scale bar = 2 μm.

References

    1. Adams S. R., Campbell R. E., Gross L. A., Martin B. R., Walkup G. K., Yao Y., et al. . (2002). New biarsenical ligands and tetracysteine motifs for protein labeling in vitro and in vivo: synthesis and biological applications. J. Am. Chem. Soc. 124, 6063–6076. 10.1021/ja017687n - DOI - PubMed
    1. Aki M., Shimbara N., Takashina M., Akiyama K., Kagawa S., Tamura T., et al. . (1994). Interferon-gamma induces different subunit organizations and functional diversity of proteasomes. J. Biochem. 115, 257–269. 10.1093/oxfordjournals.jbchem.a124327 - DOI - PubMed
    1. Baldin V., Militello M., Thomas Y., Doucet C., Fic W., Boireau S., et al. . (2008). A novel role for PA28gamma-proteasome in nuclear speckle organization and SR protein trafficking. Mol. Biol. Cell. 19, 1706–1716. 10.1091/mbc.e07-07-0637 - DOI - PMC - PubMed
    1. Bence N. F., Bennett E. J., Kopito R. R. (2005). Application and analysis of the GFPu family of ubiquitin-proteasome system reporters. Methods Enzymol. 399, 481–490. 10.1016/S0076-6879(05)99033-2 - DOI - PubMed
    1. Bennett E. J., Bence N. F., Jayakumar R., Kopito R. R. (2005). Global impairment of the ubiquitin-proteasome system by nuclear or cytoplasmic protein aggregates precedes inclusion body formation. Mol. Cell. 17, 351–365. 10.1016/j.molcel.2004.12.021 - DOI - PubMed