

Real-world menstrual cycle characteristics of more than 600,000 menstrual cycles
- PMID: 31482137
- PMCID: PMC6710244
- DOI: 10.1038/s41746-019-0152-7
Real-world menstrual cycle characteristics of more than 600,000 menstrual cycles
Abstract
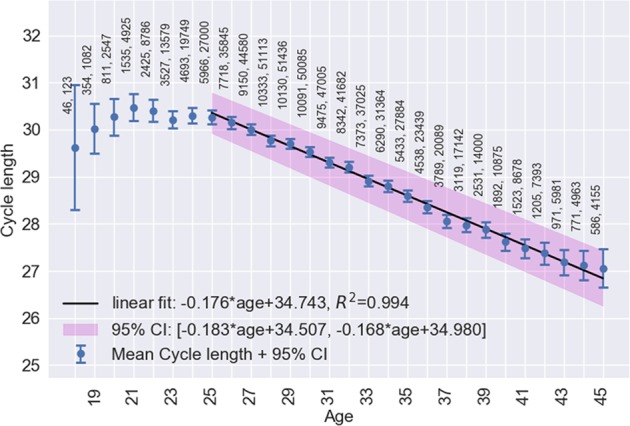
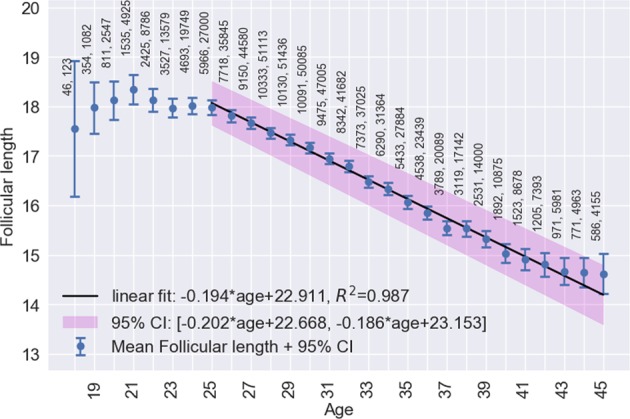
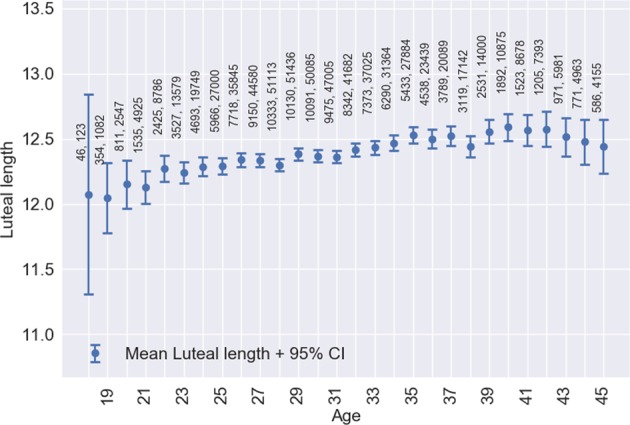
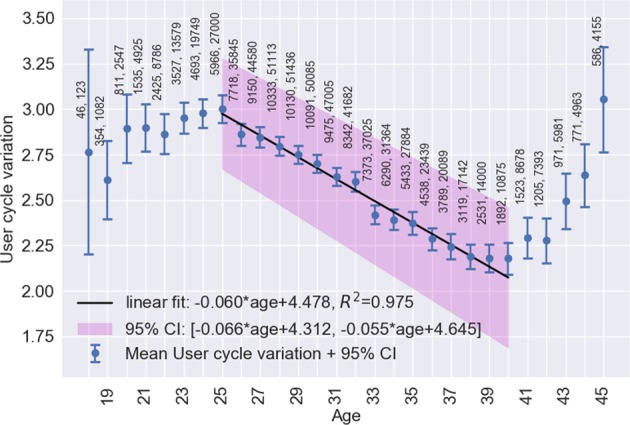
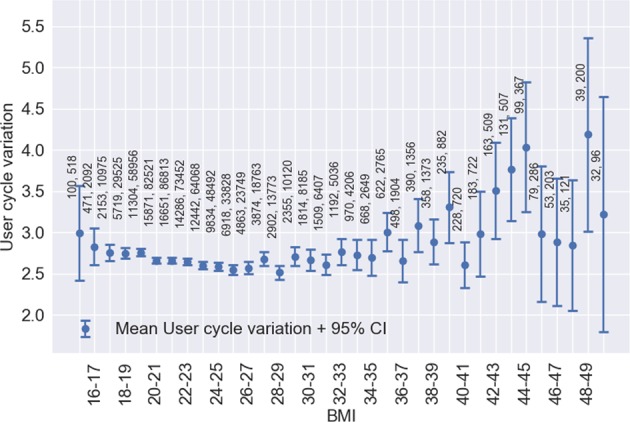
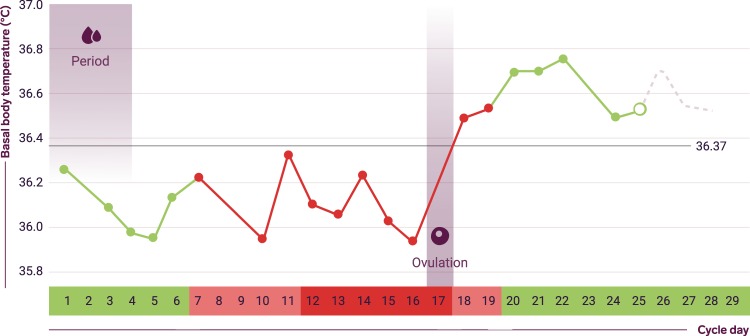
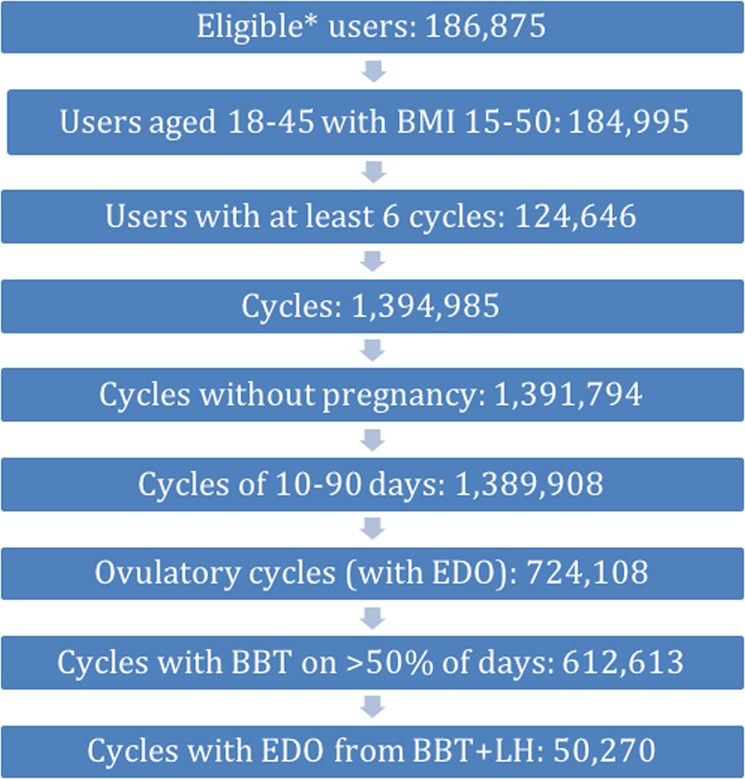
The use of apps that record detailed menstrual cycle data presents a new opportunity to study the menstrual cycle. The aim of this study is to describe menstrual cycle characteristics observed from a large database of cycles collected through an app and investigate associations of menstrual cycle characteristics with cycle length, age and body mass index (BMI). Menstrual cycle parameters, including menstruation, basal body temperature (BBT) and luteinising hormone (LH) tests as well as age and BMI were collected anonymously from real-world users of the Natural Cycles app. We analysed 612,613 ovulatory cycles with a mean length of 29.3 days from 124,648 users. The mean follicular phase length was 16.9 days (95% CI: 10-30) and mean luteal phase length was 12.4 days (95% CI: 7-17). Mean cycle length decreased by 0.18 days (95% CI: 0.17-0.18, R 2 = 0.99) and mean follicular phase length decreased by 0.19 days (95% CI: 0.19-0.20, R 2 = 0.99) per year of age from 25 to 45 years. Mean variation of cycle length per woman was 0.4 days or 14% higher in women with a BMI of over 35 relative to women with a BMI of 18.5-25. This analysis details variations in menstrual cycle characteristics that are not widely known yet have significant implications for health and well-being. Clinically, women who wish to plan a pregnancy need to have intercourse on their fertile days. In order to identify the fertile period it is important to track physiological parameters such as basal body temperature and not just cycle length.
Keywords: Preclinical research; Reproductive biology.
Conflict of interest statement
Competing interestsThe study was funded by Natural Cycles Nordic AB. J.R. Bull and S.P. Rowland are full time employees of Natural Cycles Nordic AB. E. Berglund Scherwitzl and R. Scherwitzl are the founders of Natural Cycles Nordic AB. J. Harper has received consultancy fees from Natural Cycles to compensate for her expert input on this paper.
Figures
References
-
- Reed, B. G. & Carr, B. R. The normal menstrual cycle and the control of ovulation. in Endotext (eds. De Groot, L. J., Chrousos, G. & Dungan, K., 2015).
-
- Vollman RF. The menstrual cycle. Major Probl. Obstet. Gynecol. 1977;7:193. - PubMed
LinkOut - more resources
Full Text Sources
Other Literature Sources
Medical
