

Breakdown of multiple sclerosis genetics to identify an integrated disease network and potential variant mechanisms
- PMID: 31482761
- PMCID: PMC6879814
- DOI: 10.1152/physiolgenomics.00120.2018
Breakdown of multiple sclerosis genetics to identify an integrated disease network and potential variant mechanisms
Abstract
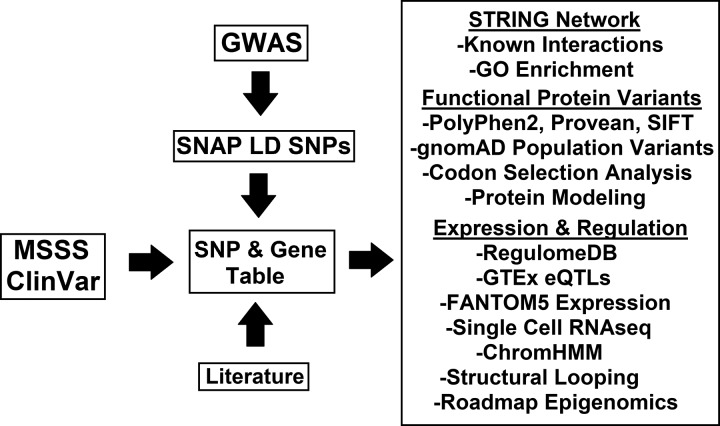
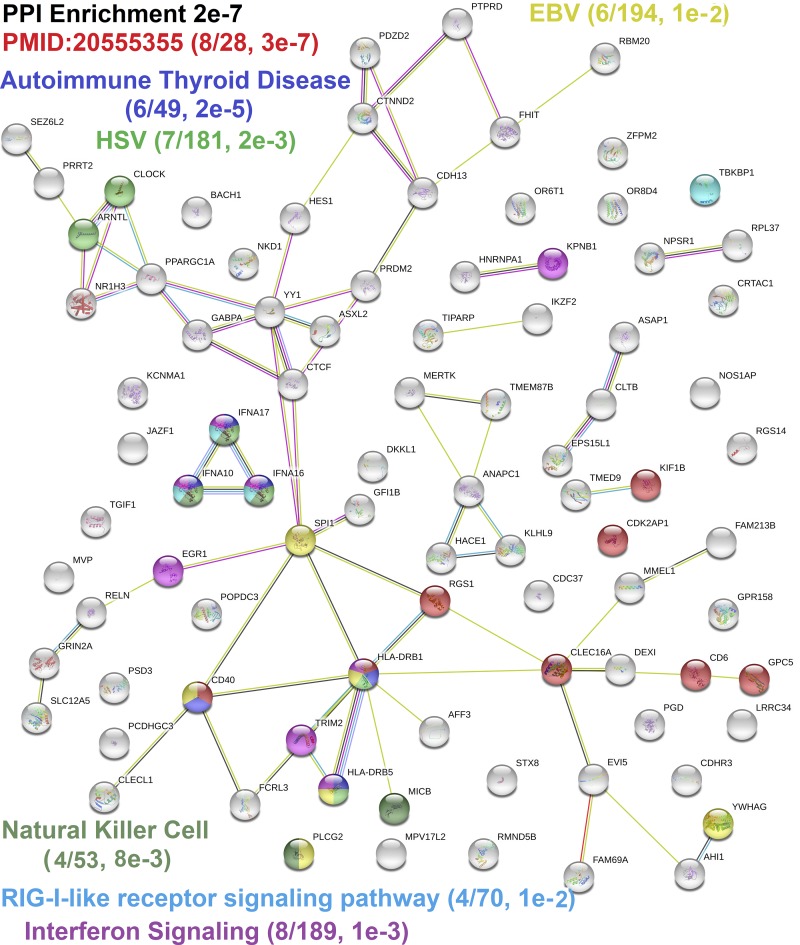
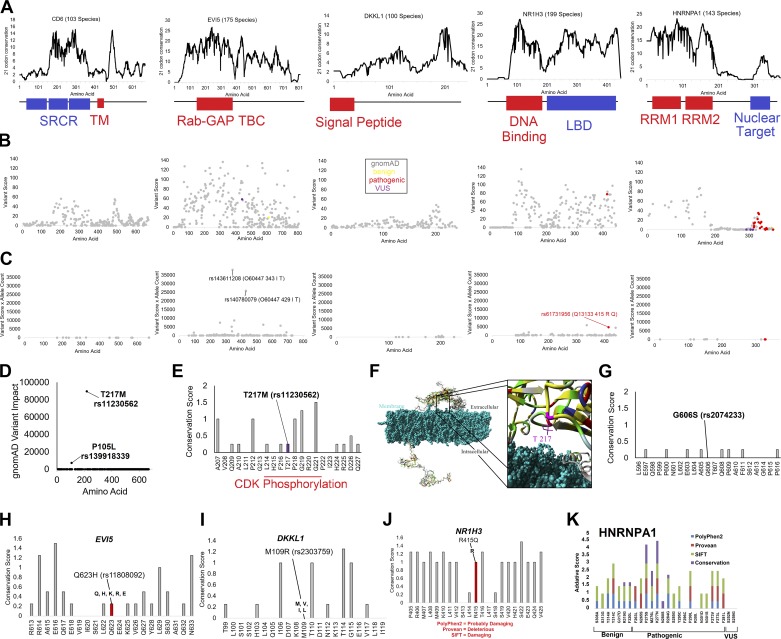
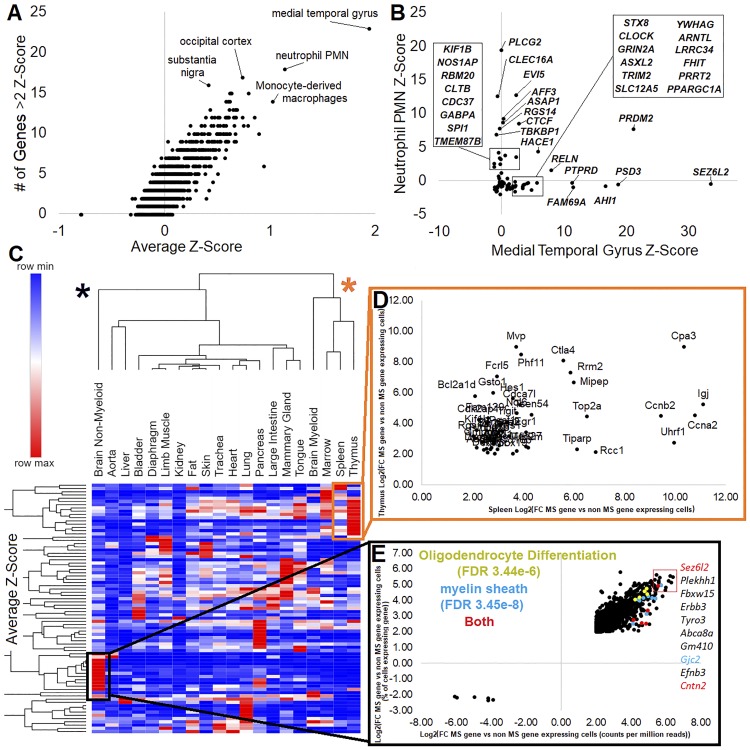
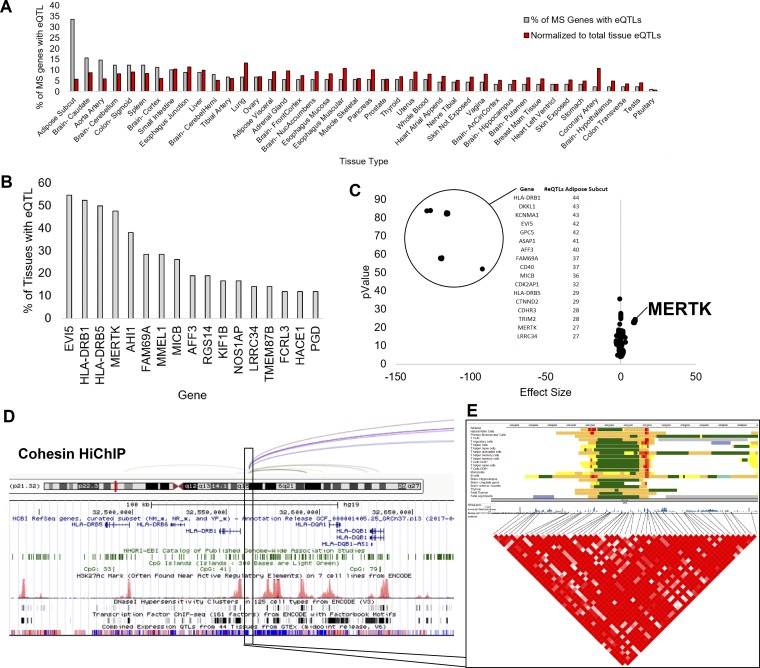
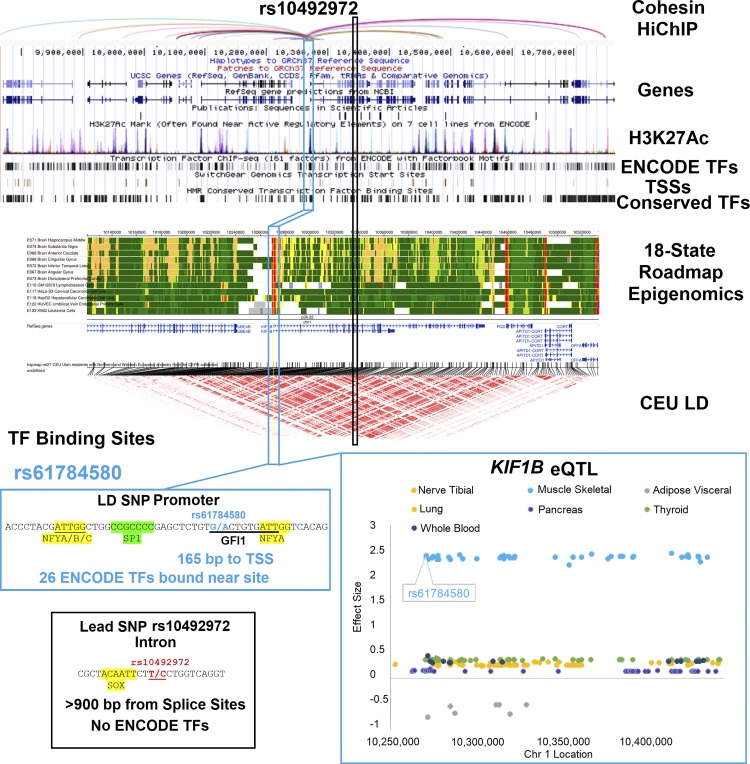
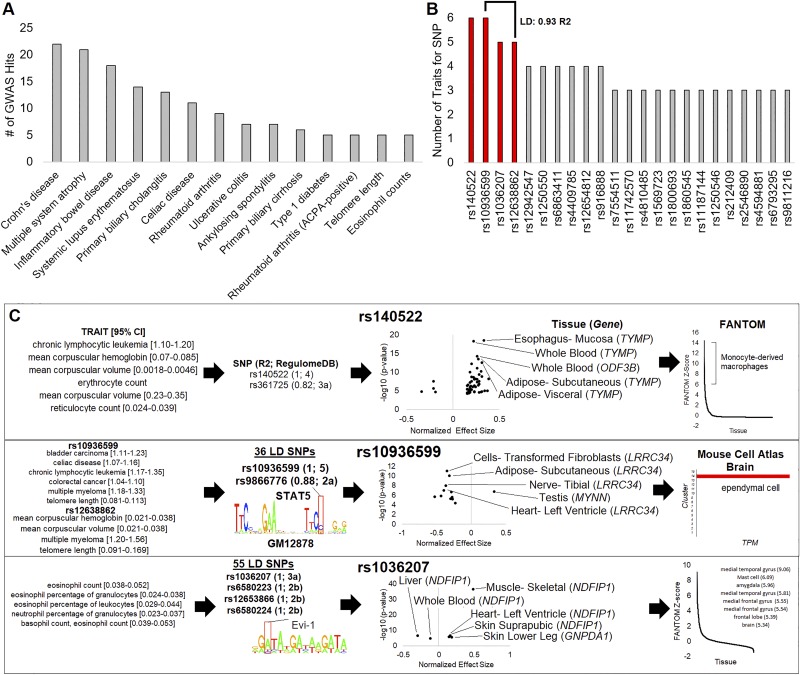
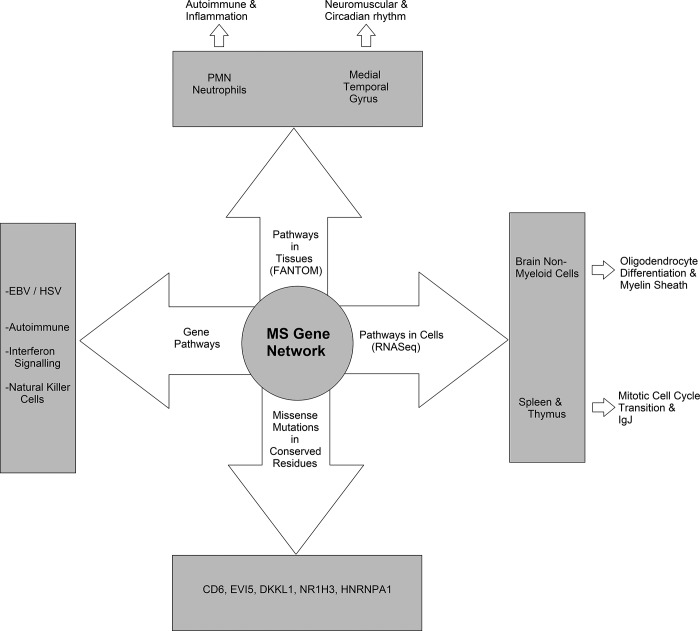
Genetics of multiple sclerosis (MS) are highly polygenic with few insights into mechanistic associations with pathology. In this study, we assessed MS genetics through linkage disequilibrium and missense variant interpretation to yield a MS gene network. This network of 96 genes was taken through pathway analysis, tissue expression profiles, single cell expression segregation, expression quantitative trait loci (eQTLs), genome annotations, transcription factor (TF) binding profiles, structural genome looping, and overlap with additional associated genetic traits. This work revealed immune system dysfunction, nerve cell myelination, energetic control, transcriptional regulation, and variants that overlap multiple autoimmune disorders. Tissue-specific expression and eQTLs of MS genes implicate multiple immune cell types including macrophages, neutrophils, and T cells, while the genes in neural cell types enrich for oligodendrocyte and myelin sheath biology. There are eQTLs in linkage with lead MS variants in 25 genes including the multitissue eQTL, rs9271640, for HLA-DRB1/DRB5. Using multiple functional genomic databases, we identified noncoding variants that disrupt TF binding for GABPA, CTCF, EGR1, YY1, SPI1, CLOCK, ARNTL, BACH1, and GFI1. Overall, this paper suggests multiple genetic mechanisms for MS associated variants while highlighting the importance of a systems biology and network approach when elucidating intersections of the immune and nervous system.
Keywords: GWAS; data integration; eQTL; multiple sclerosis; omics.
Conflict of interest statement
No conflicts of interest, financial or otherwise, are declared by the authors.
Figures
Similar articles
-
Impact of genetic risk loci for multiple sclerosis on expression of proximal genes in patients.Hum Mol Genet. 2018 Mar 1;27(5):912-928. doi: 10.1093/hmg/ddy001. Hum Mol Genet. 2018. PMID: 29325110
-
Functional relevance for multiple sclerosis-associated genetic variants.Immunogenetics. 2015 Jan;67(1):7-14. doi: 10.1007/s00251-014-0803-4. Epub 2014 Oct 12. Immunogenetics. 2015. PMID: 25308886
-
Influence of tissue context on gene prioritization for predicted transcriptome-wide association studies.Pac Symp Biocomput. 2019;24:296-307. Pac Symp Biocomput. 2019. PMID: 30864331 Free PMC article. Clinical Trial.
-
Complex approaches to study complex trait genetics in multiple sclerosis.Ideggyogy Sz. 2014 Sep 30;67(9-10):309-21. Ideggyogy Sz. 2014. PMID: 25518259 Review.
-
Reworking GWAS Data to Understand the Role of Nongenetic Factors in MS Etiopathogenesis.Genes (Basel). 2020 Jan 14;11(1):97. doi: 10.3390/genes11010097. Genes (Basel). 2020. PMID: 31947683 Free PMC article. Review.
Cited by
-
Combination of Genomic and Transcriptomic Approaches Highlights Vascular and Circadian Clock Components in Multiple Sclerosis.Int J Mol Sci. 2021 Dec 28;23(1):310. doi: 10.3390/ijms23010310. Int J Mol Sci. 2021. PMID: 35008743 Free PMC article.
-
Sez6L2 autoimmunity induces cerebellar ataxia in mice.bioRxiv [Preprint]. 2025 May 29:2025.05.28.656724. doi: 10.1101/2025.05.28.656724. bioRxiv. 2025. PMID: 40502079 Free PMC article. Preprint.
-
Shared Molecular Signatures Across Zika Virus Infection and Multiple Sclerosis Highlight AP-1 Transcription Factor as a Potential Player in Post-ZIKV MS-Like Phenotypes.Mol Neurobiol. 2023 Aug;60(8):4184-4205. doi: 10.1007/s12035-023-03305-y. Epub 2023 Apr 13. Mol Neurobiol. 2023. PMID: 37046138
-
Heat shock protein 70 gene polymorphisms in Iranian patients with Multiple sclerosis.Am J Clin Exp Immunol. 2024 Dec 25;13(6):278-284. doi: 10.62347/CMYA9839. eCollection 2024. Am J Clin Exp Immunol. 2024. PMID: 39839348 Free PMC article.
-
The Multifaceted Roles of BACH1 in Disease: Implications for Biological Functions and Therapeutic Applications.Adv Sci (Weinh). 2025 Mar;12(10):e2412850. doi: 10.1002/advs.202412850. Epub 2025 Jan 30. Adv Sci (Weinh). 2025. PMID: 39887888 Free PMC article. Review.
References
-
- Andlauer TFM, Buck D, Antony G, Bayas A, Bechmann L, Berthele A, Chan A, Gasperi C, Gold R, Graetz C, Haas J, Hecker M, Infante-Duarte C, Knop M, Kümpfel T, Limmroth V, Linker RA, Loleit V, Luessi F, Meuth SG, Mühlau M, Nischwitz S, Paul F, Pütz M, Ruck T, Salmen A, Stangel M, Stellmann J-P, Stürner KH, Tackenberg B, Then Bergh F, Tumani H, Warnke C, Weber F, Wiendl H, Wildemann B, Zettl UK, Ziemann U, Zipp F, Arloth J, Weber P, Radivojkov-Blagojevic M, Scheinhardt MO, Dankowski T, Bettecken T, Lichtner P, Czamara D, Carrillo-Roa T, Binder EB, Berger K, Bertram L, Franke A, Gieger C, Herms S, Homuth G, Ising M, Jöckel K-H, Kacprowski T, Kloiber S, Laudes M, Lieb W, Lill CM, Lucae S, Meitinger T, Moebus S, Müller-Nurasyid M, Nöthen MM, Petersmann A, Rawal R, Schminke U, Strauch K, Völzke H, Waldenberger M, Wellmann J, Porcu E, Mulas A, Pitzalis M, Sidore C, Zara I, Cucca F, Zoledziewska M, Ziegler A, Hemmer B, Müller-Myhsok B. Novel multiple sclerosis susceptibility loci implicated in epigenetic regulation. Sci Adv 2: e1501678, 2016. doi:10.1126/sciadv.1501678. - DOI - PMC - PubMed
-
- Aulchenko YS, Hoppenbrouwers IA, Ramagopalan SV, Broer L, Jafari N, Hillert J, Link J, Lundström W, Greiner E, Dessa Sadovnick A, Goossens D, Van Broeckhoven C, Del-Favero J, Ebers GC, Oostra BA, van Duijn CM, Hintzen RQ. Genetic variation in the KIF1B locus influences susceptibility to multiple sclerosis. Nat Genet 40: 1402–1403, 2008. doi:10.1038/ng.251. - DOI - PubMed
Publication types
MeSH terms
Grants and funding
LinkOut - more resources
Full Text Sources
Medical
Research Materials
Miscellaneous