. 2019 Oct 1;129(10):4224-4238.
doi: 10.1172/JCI127458.

Type I IFN protects cancer cells from CD8+ T cell-mediated cytotoxicity after radiation

Affiliations

Type I IFN protects cancer cells from CD8+ T cell-mediated cytotoxicity after radiation

Jianzhou Chen et al. J Clin Invest. .

Abstract

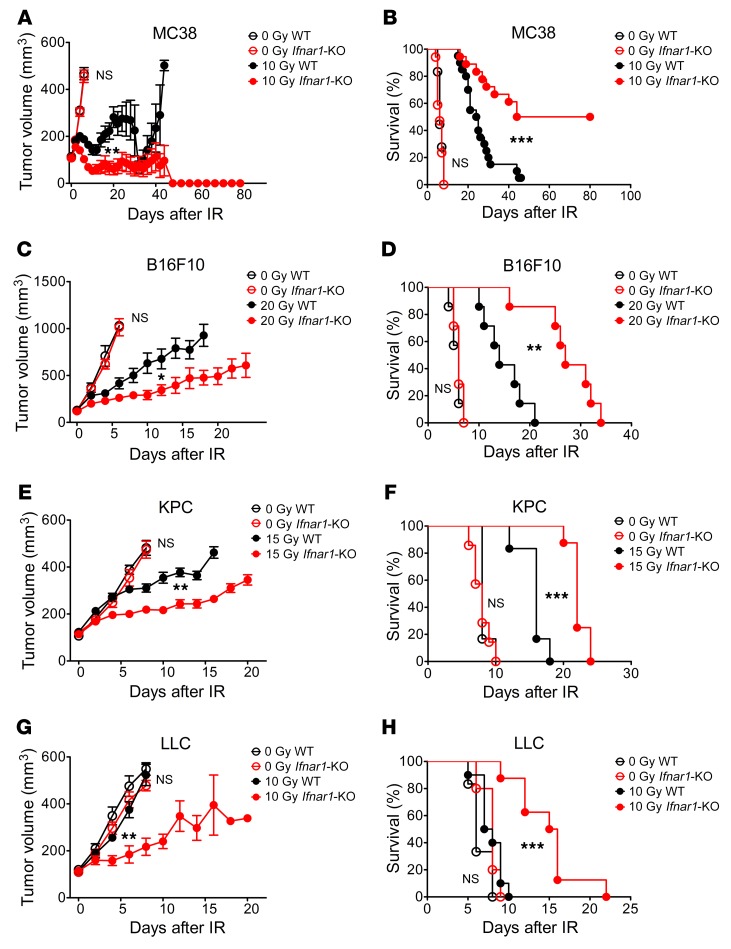
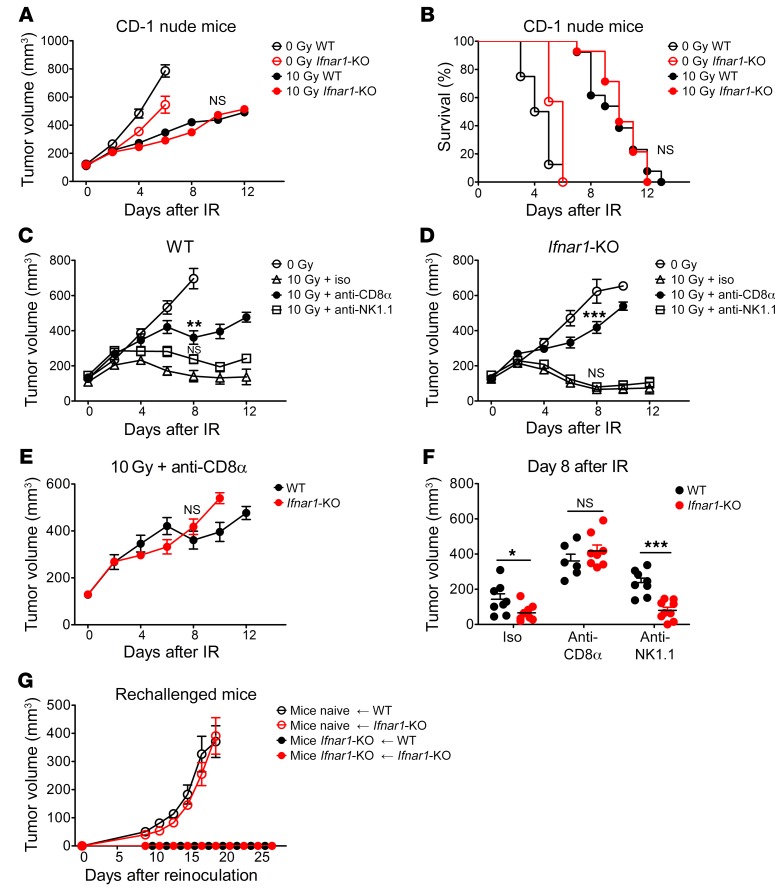
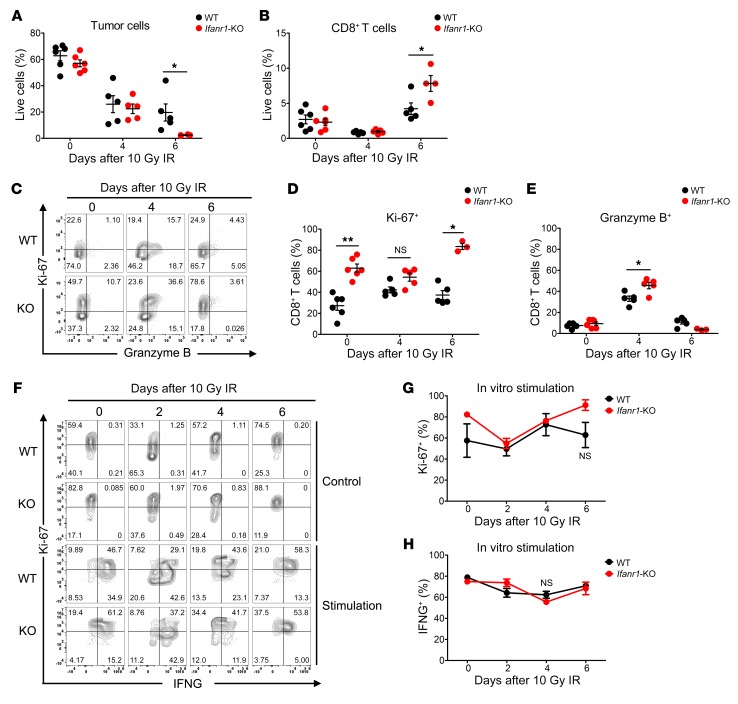
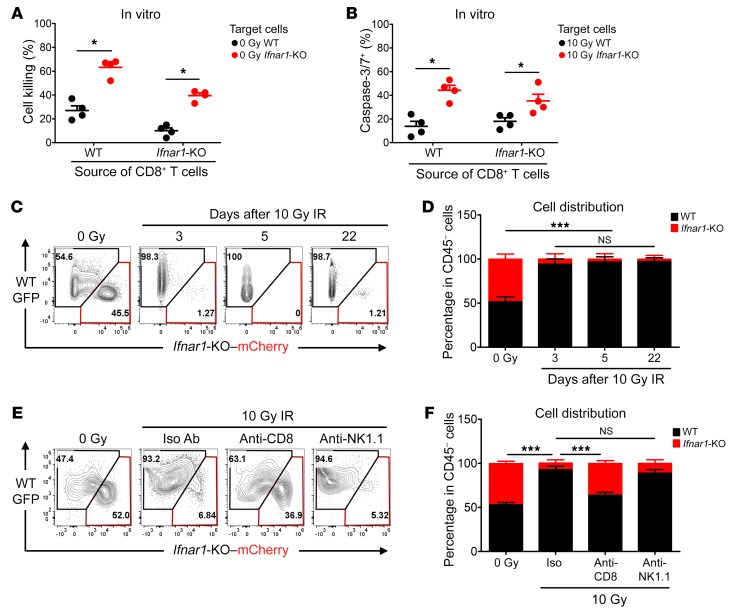
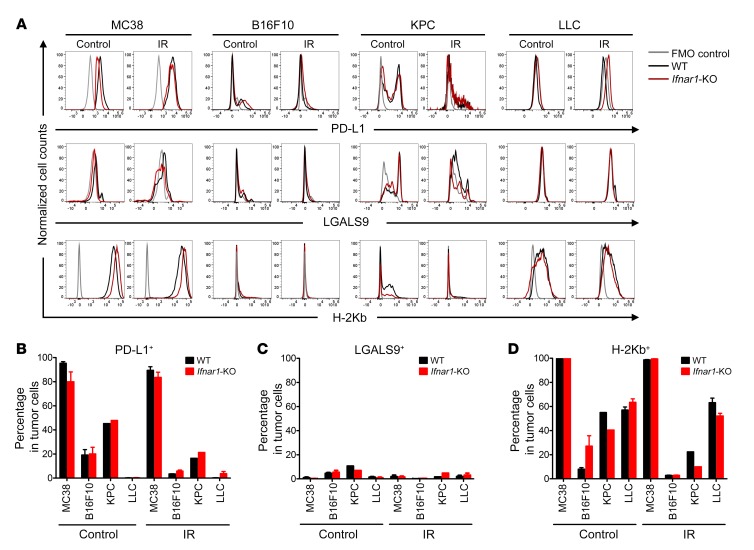
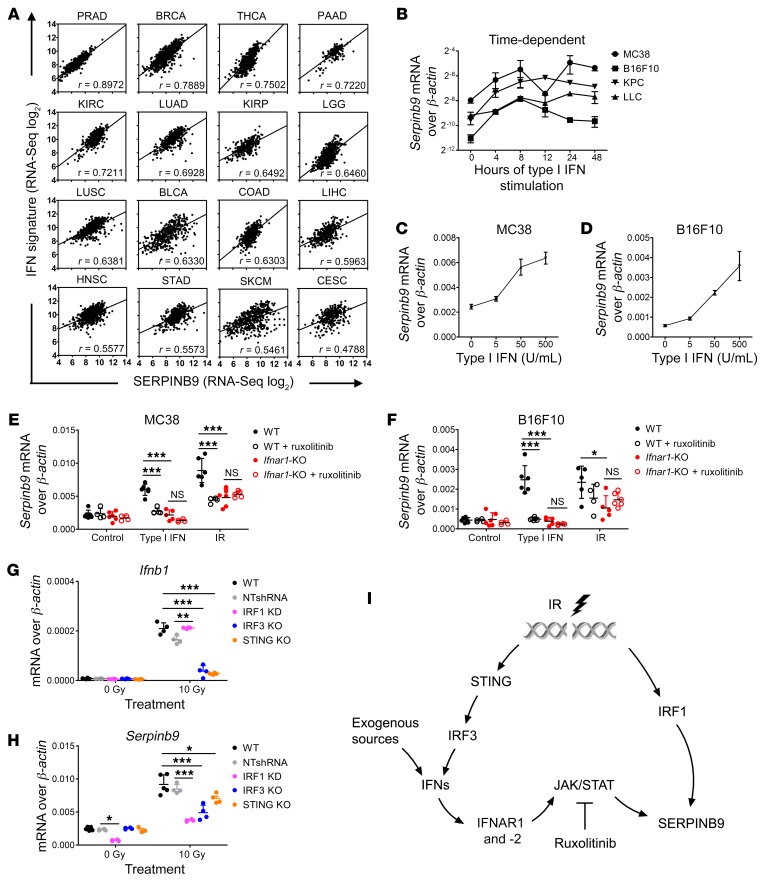
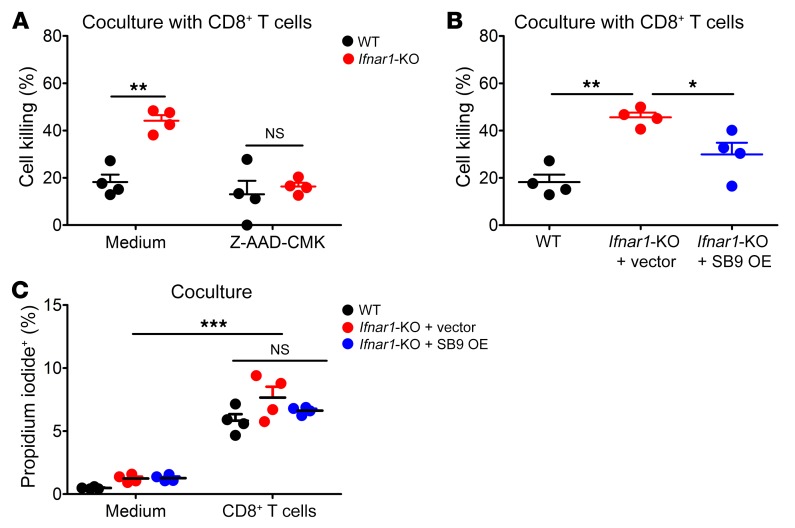
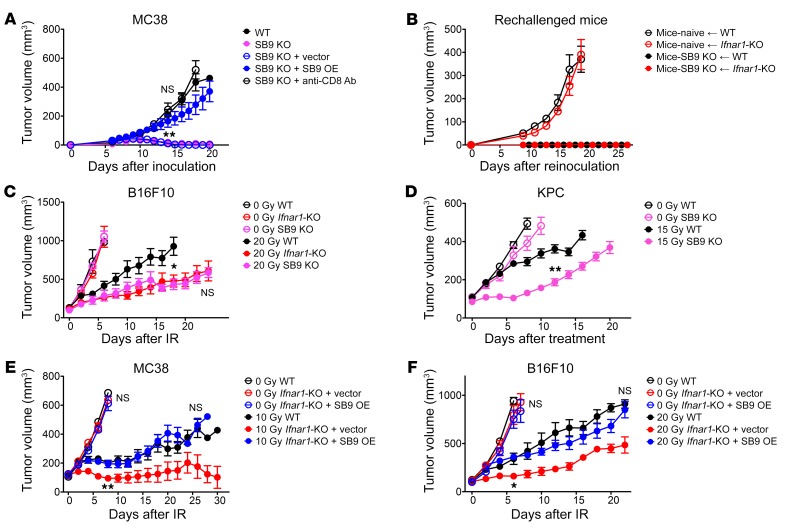
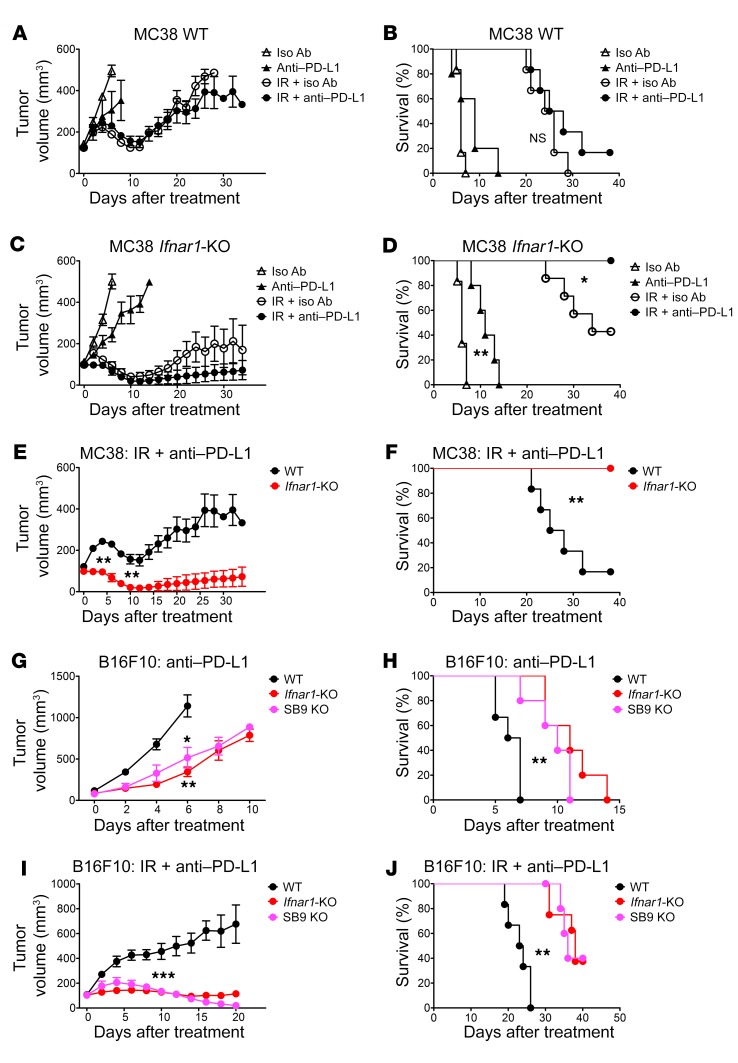
Treatment of tumors with ionizing radiation stimulates an antitumor immune response partly dependent on induction of IFNs. These IFNs directly enhance dendritic cell and CD8+ T cell activity. Here we show that resistance to an effective antitumor immune response is also a result of IFN signaling in a different cellular compartment of the tumor, the cancer cells themselves. We abolished type I IFN signaling in cancer cells by genetic elimination of its receptor, IFNAR1. Pronounced immune responses were provoked after ionizing radiation of tumors from 4 mouse cancer cell lines with Ifnar1 knockout. This enhanced response depended on CD8+ T cells and was mediated by enhanced susceptibility to T cell-mediated killing. Induction of Serpinb9 proved to be the mechanism underlying control of susceptibility to T cell killing after radiation. Ifnar1-deficient tumors had an augmented response to anti-PD-L1 immunotherapy with or without radiation. We conclude that type I IFN can protect cancer cells from T cell-mediated cytotoxicity through regulation of Serpinb9. This result helps explain why radiation of tumors can stimulate antitumor immunity yet also result in resistance. It further suggests potential targets for intervention to improve therapy and to predict responses.

Keywords: Cancer; Cellular immune response; Immunology; Oncology; Radiation therapy.


Conflict of interest statement

Conflict of interest: The authors have declared that no conflict of interest exists.

Figures

Figure 1
Figure 1. Ifnar1 KO in cancer cells enhances tumor response to IR.
Tumors in C57BL/6 mice derived from the indicated cancer cell lines with or without Ifnar1 KO, including MC38 (A and B), B16F10 (C and D), KPC (E and F), and LLC (G and H) cells, received 0 Gy or the indicated single doses of IR. (A, C, E, and G) Tumor volume. Note that once mice had been culled due to reaching the ethically acceptable limit for tumor volume, the tumors from those mice no longer were included in the mean tumor volume calculation. (B, D, F, and H) Kaplan-Meier survival curves from the same experiment. n = 7–18 in control groups and 8–20 in irradiation groups. Error bars represent mean ± SEM. Comparison of 2 means was performed by the Mann-Whitney U test. Survival comparison between groups were performed using log-rank test (NS: P ≥ 0.05, *P < 0.05, **P < 0.01, ***P < 0.001).
Figure 2
Figure 2. The enhanced response of Ifnar1-KO tumors to IR is mediated by CD8+ T cell immunity.
MC38 tumors (WT and Ifnar1-KO) grown in CD-1 nude mice were treated with 0 Gy (n = 7–8) or 10 Gy (n = 13–14) IR. (A and B) Tumor volumes and mouse survival were assessed and summarized. C57BL/6 mice bearing subcutaneous WT (C) or Ifnar1-KO (D) MC38 tumors were subjected to the following treatments: 0 Gy IR; 10 Gy IR on day 0 plus isotype control Abs (10 Gy + iso); 10 Gy IR plus anti-CD8α Ab; and 10 Gy IR plus anti-NK1.1 Ab. Abs were administered on days –1, 2, 5, 8, and 11. n = 8–10. WT (C) or Ifnar1-KO (D) tumors with either CD8+ T cells or NK cells depleted were compared with tumors receiving isotype control Abs. (E) Growth of WT and Ifnar1-KO MC38 tumors following 10 Gy IR with CD8+ T cell depletion. (F) Mean volume of tumors on day 8 after IR was compared in WT and Ifnar1-KO mice. C57BL/6 mice with completely regressed Ifnar1-KO MC38 tumors after IR were rechallenged with WT or Ifnar1-KO MC38 cell on the other flank. (G) Growth of tumors following reinoculation. n = 4–6. Data show mean ± SEM (AE and G) and mean ± SD (F). Comparison of 2 means was performed by the unpaired Student’s t test when data were normally distributed, and the Mann-Whitney U test when they were not or their normality could not be evaluated. Comparison of means of more than 2 groups was performed by 1-way ANOVA with Tukey’s multiple-comparisons test (NS: P ≥ 0.05, *P < 0.05, **P < 0.01, ***P < 0.001).
Figure 3
Figure 3. Characterization of infiltrating CD8+ T cells from Ifnar1-KO and WT MC38 tumors.
WT or Ifnar1-KO MC38 tumors in C57BL/6 mice were subjected to 0 Gy or 10 Gy IR. On day 0, before IR, and days 4 and 6 after IR, tumors were harvested and disaggregated for cell type profiling using flow cytometry. (A and B) Percentages of tumor cells and CD8+ T cells among the total live cells. n = 5–6. (C) Representative flow cytometry plots characterizing gated CD8+ T cells, with Ki-67 on the y axis displayed against granzyme B on the x axis. (D and E) Percentages of Ki-67– and granzyme B–positive CD8+ T cells in WT or Ifnar1-KO tumors with or without IR. n = 5–6. CD8+ T cells isolated from WT or Ifnar1-KO MC38 tumors on days 0, 2, 4, and 6 following 10 Gy IR, were stimulated with PMA, ionomycin, and brefeldin A for 4 hours, and assessed by flow cytometry (representative plot shown in F). (G and H) Percentages of Ki-67– or IFNG-positive CD8+ T cells. n = 3–4. Data represent mean ± SD. Comparison of 2 means was performed by the Mann-Whitney U test (NS: P ≥ 0.05, *P < 0.05, **P < 0.01).
Figure 4
Figure 4. Ifnar1-KO MC38 tumor cells are more susceptible to CD8+ T cell–mediated killing.
WT and Ifnar1-KO MC38 cells were cocultured with CD8+ T cells derived from either WT or Ifnar1-KO MC38 tumors at a ratio of CD8+ T cells/tumor cells of 3:2 for 48 hours. (A) Percentage of cell killing. n = 4. Irradiated MC38 cells (WT or Ifnar1-KO) were cocultured with CD8+ T cells derived from irradiated WT or Ifnar1-KO MC38 tumors at a ratio of 3:2. Cells in medium supplemented with Caspase-3/7 Green detection reagent were imaged with an epifluorescence microscope. (B) The percentage of tumor cells becoming caspase-3/7+ following interaction with CD8+ T cells was evaluated. n = 4. GFP-tagged WT MC38 cells and mCherry-tagged Ifnar1-KO MC38 cells at a ratio of 1:1 were injected subcutaneously into C57BL/6 mice. Established tumors were subjected to 0 Gy or 10 Gy IR on day 0. On days 3 and 5, and 22 for irradiated tumors, the percentages of GFP- and mCherry-positive cells in the CD45-negative population were assessed by flow cytometry (representative plot in C and summary in D). n =4. Tumors formed from a mixture of cells (MC38 WT-GFP + Ifnar1-mCherry, 1:1) were subjected to the following: 0 Gy, 10 Gy (day 0) + isotype control Abs; 10 Gy + anti-CD8 Ab; and 10 Gy + anti-NK1.1 Ab. The distribution of GFP versus mCherry cells in the CD45-negative live population on day 3 was assessed by flow cytometry (representative plot in E and quantification in F). n = 5. Data represent mean ± SD. Comparison of 2 means was performed by the Mann-Whitney U test. Comparison of means of more than 2 groups was performed by 1-way ANOVA with Tukey’s multiple-comparisons test (NS: P ≥ 0.05, *P < 0.05, ***P < 0.001).
Figure 5
Figure 5. Flow cytometry profiling of candidate mediators.
The abundance of PD-L1, LGALS9, and H-2Kb on the surface of cells from either WT or Ifnar1-KO tumors on day 4 following 0 Gy or IR administration was assessed by flow cytometry in tumors from the indicated cell lines. (A) Cells stained with FMO were negative controls (gray line); WT cells are represented in black and Ifnar1-KO in red. (BD) Percentages of PD-L1– (CD274), LGALS9-, and H-2Kb–positive cells. n = 5–6, except for KPC cells, where n = 1 due to the necessity of pooling samples to obtain sufficient material for analysis. Data represent mean ± SD.
Figure 6
Figure 6. Serpinb9 is induced by type I IFN signaling in cancer cells.
(A) The correlation of SERPINB9 expression with IFN signature genes in 16 different human cancer types from the TCGA database was evaluated by Pearson’s correlation. Pearson’s correlation coefficients (r) are indicated. P values for all comparisons were less than 0.0001. (B) Serpinb9 expression in cancer cells (MC38, B16F10, KPC, and LLC) after exposure to type I IFN (50 U/mL) over 48 hours. n = 3. (C and D) Serpinb9 expression in MC38 and B16F10 cells after exposure to the indicated concentration of type I IFN (0–500 U/mL) after 4 hours. n = 3. (E and F) Serpinb9 expression in MC38 and B16F10 cells (WT vs. Ifnar1-KO) at 4 hours after exposure to type I IFN (50 U/mL) or 72 hours after IR (10 Gy for MC38 and 20 Gy for B16F10 cells) with or without ruxolitinib. Dimethyl sulfoxide (final v/v 0.5%) or ruxolitinib (final concentration 2.5 μM) was added to the medium 1 hour before IFN or IR treatment and remained in the medium through the experiment. n = 4–6. (G and H) Serpinb9 and Ifnb1 expression in WT cells and WT MC38 cells transfected with nontargeting shRNA lentivirus (NTshRNA), and IRF1-knockdown (KD), IRF3-KO, and STING-KO MC38 cells at 72 hours after 10 Gy. n = 4. Gene expression was assessed by RT-qPCR. All mRNA expression levels were normalized to β-actin. (I) Scheme for induction of Serpinb9 in cancer cells after type I IFN or IR treatment. Data represent mean ± SD. Comparison of means was performed by 1-way ANOVA with Tukey’s multiple-comparisons test (NS: P ≥ 0.05, *P < 0.05, **P < 0.01, ***P < 0.001).
Figure 7
Figure 7. Overexpression of Serpinb9 in Ifnar1-KO cancer cells reduces enhanced killing by CD8+ T cells in vitro.
WT and Ifnar1-KO MC38 cells were cocultured with CD8+ T cells isolated from WT MC38 tumors for 48 hours with or without Z-AAD-CMK. CD8+ T cells were treated with Z-AAD-CMK (100 μM) for 30 minutes prior to coculture. Z-AAD-CMK remained in the medium through the experiment. (A) Percentage of cell killing. n = 4. MC38 cells (WT, Ifnar1-KO + vector, and Ifnar1-KO + Serpinb9 overexpression [SB9 OE]) were cocultured with CD8+ T cells isolated from WT MC38 tumors. (B) Percentage of cell killing. n = 4. MC38 cells (WT, Ifnar1-KO + vector, and Ifnar1-KO + SB9 OE) were cocultured with either control medium or CD8+ T cells isolated from WT MC38 tumors for 4 hours with propidium iodide (50 μg/mL) in the medium. (C) Percentage of propidium iodide–positive cells following coculture. n = 4. Data represent mean ± SD. Comparison of means was performed by 1-way ANOVA with Tukey’s multiple-comparisons test (NS: P ≥ 0.05, *P < 0.05, **P < 0.01, ***P < 0.001).
Figure 8
Figure 8. Serpinb9 is a mediator for the enhanced response of Ifnar1-KO tumors to IR.
(A) Growth of WT, SB9 KO (with or without CD8+ T cell depletion), SB9 KO + vector, and SB9 KO + SB9 OE MC38 tumors. n = 6–8. C57BL/6 mice with complete regression of SB9 KO MC38 tumors were rechallenged with WT or Ifnar1-KO MC38 cells on the opposite flank. (B) Growth of tumors following reinoculation along with growth data for WT and Ifnar1-KO MC38 tumors in naive mice from Figure 2G. n = 4–6. (C) Volumes of B16F10 tumors (WT, Ifnar1-KO, and SB9 KO) following 0 Gy or 20 Gy IR. n = 6–7. 20 Gy WT vs. 20 Gy SB9 KO: P <0.05. 20 Gy-Ifnar1-KO vs. 20 Gy-SB9 KO: NS. (D) Volumes of KPC tumors (WT and SB9 KO) following 0 Gy (n = 5–7) or 15 Gy (n = 5–6) IR. MC38 and B16F10 tumors (WT, Ifnar1-KO + vector, and Ifnar1-KO + SB9 OE) grown in C57BL6 mice were treated with 0 Gy or 10 Gy IR for MC38 and 20 Gy IR for B16F10. (E and F) Tumor growth. n = 5–6. Data represent mean ± SD in A and B, and mean ± SEM in CF. Comparison of 2 means was performed by the Mann-Whitney U test (NS: P ≥ 0.05, *P < 0.05, **P < 0.01).
Figure 9
Figure 9. Ifnar1-KO or Serpinb9-KO tumors exhibited greater levels of response to anti–PD-L1 with or without IR than WT tumors.
C57BL/6 mice bearing subcutaneous WT or Ifnar1-KO MC38 tumors were subjected to the following treatments: isotype control Ab; anti–PD-L1 Ab; 10 Gy IR on day 0 plus isotype control Ab; 10 Gy IR plus anti–PD-L1 Ab. Ab was administrated on days –1, 3, 7, and 11. (A, C, and E) Tumor volumes. (B, D, and F) Kaplan-Meier survival curves for mice. n = 5–7. C57BL/6 mice bearing subcutaneous WT, Ifnar1-KO, or SB9 KO B16F10 tumors received anti–PD-L1 Ab on days –1, 3, 7, and 11 with or without 20 Gy IR on day 0. (GJ) Tumor growth and survival. n = 5–8. Data represent mean ± SEM. Comparison of 2 means was performed with the Mann-Whitney U test. Survival comparisons between groups were performed using the log-rank test (NS: P ≥ 0.05, *P < 0.05, **P < 0.01, ***P < 0.001).

References

    1. Minn AJ, Wherry EJ. Combination cancer therapies with immune checkpoint blockade: convergence on interferon signaling. Cell. 2016;165(2):272–275. doi: 10.1016/j.cell.2016.03.031. - DOI - PubMed
    1. Deng L, Liang H, Fu S, Weichselbaum RR, Fu YX. From DNA damage to nucleic acid sensing: a strategy to enhance radiation therapy. Clin Cancer Res. 2016;22(1):20–25. doi: 10.1158/1078-0432.CCR-14-3110. - DOI - PubMed
    1. Burnette BC, et al. The efficacy of radiotherapy relies upon induction of type i interferon-dependent innate and adaptive immunity. Cancer Res. 2011;71(7):2488–2496. doi: 10.1158/0008-5472.CAN-10-2820. - DOI - PMC - PubMed
    1. Deng L, et al. STING-dependent cytosolic DNA sensing promotes radiation-induced type I interferon-dependent antitumor immunity in immunogenic tumors. Immunity. 2014;41(5):843–852. doi: 10.1016/j.immuni.2014.10.019. - DOI - PMC - PubMed
    1. Vanpouille-Box C, et al. DNA exonuclease Trex1 regulates radiotherapy-induced tumour immunogenicity. Nat Commun. 2017;8:15618. - PMC - PubMed

Publication types

MeSH terms