. 2019 Oct 1;129(10):4290-4304.
doi: 10.1172/JCI128531.

Electronic cigarettes disrupt lung lipid homeostasis and innate immunity independent of nicotine

Affiliations

Electronic cigarettes disrupt lung lipid homeostasis and innate immunity independent of nicotine

Matthew C Madison et al. J Clin Invest. .

Abstract

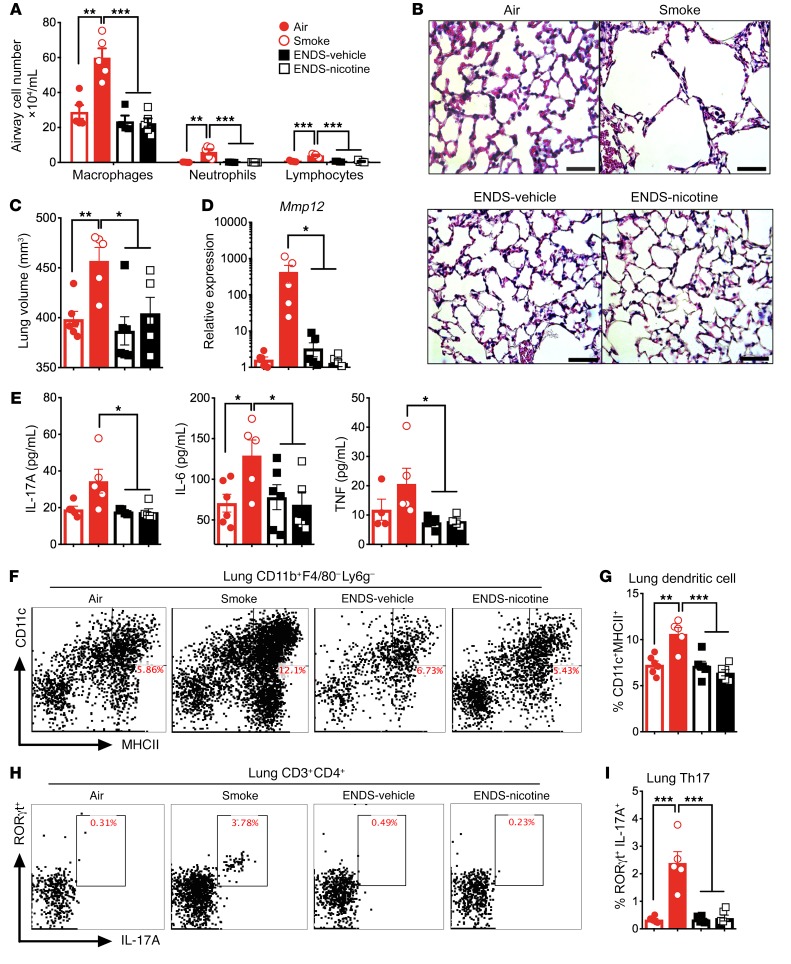
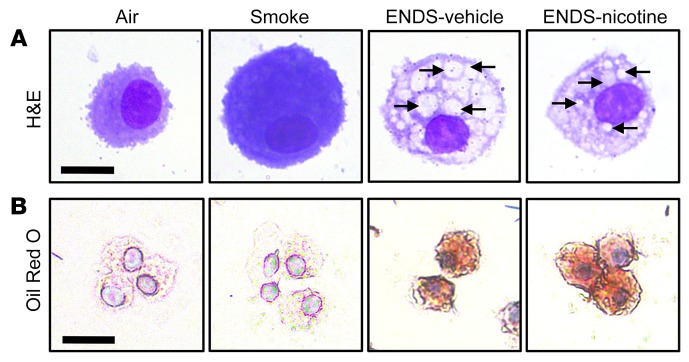
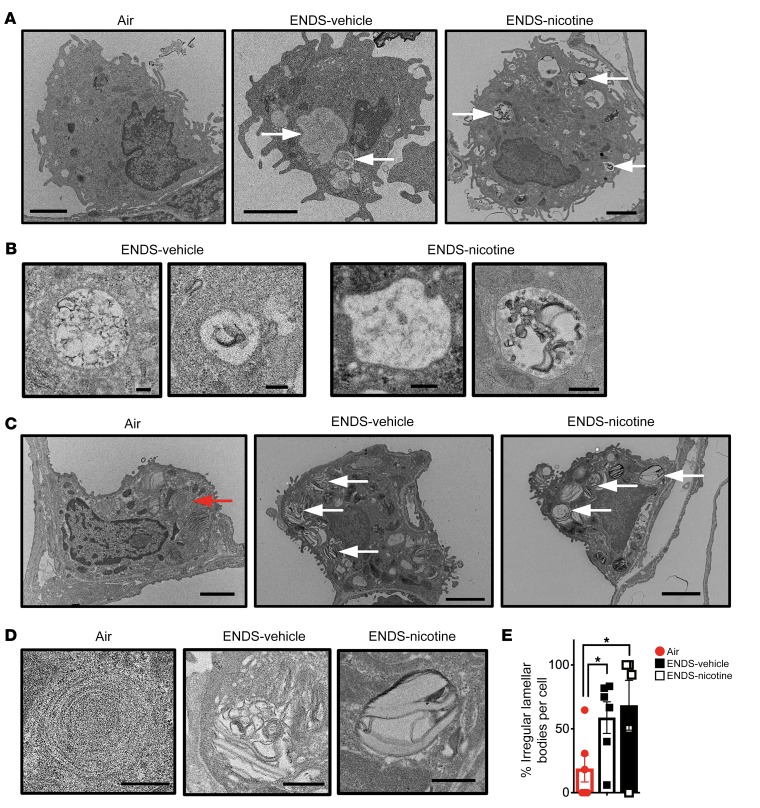
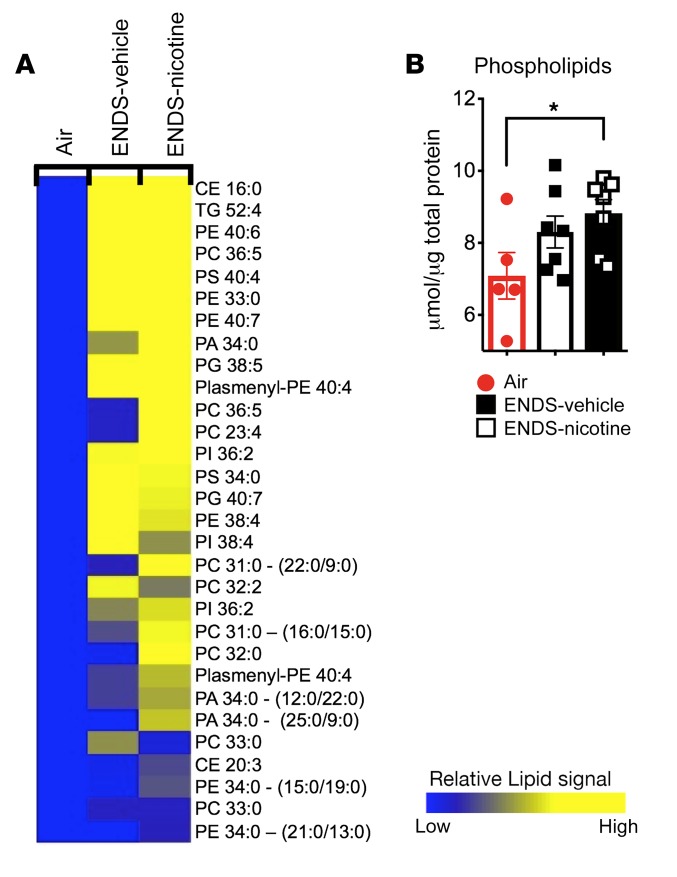
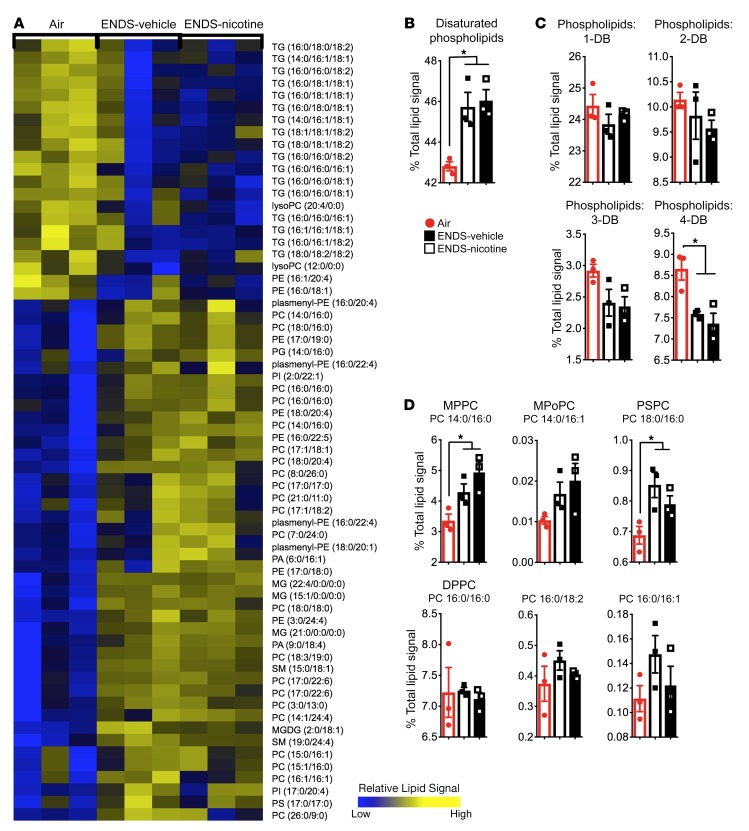
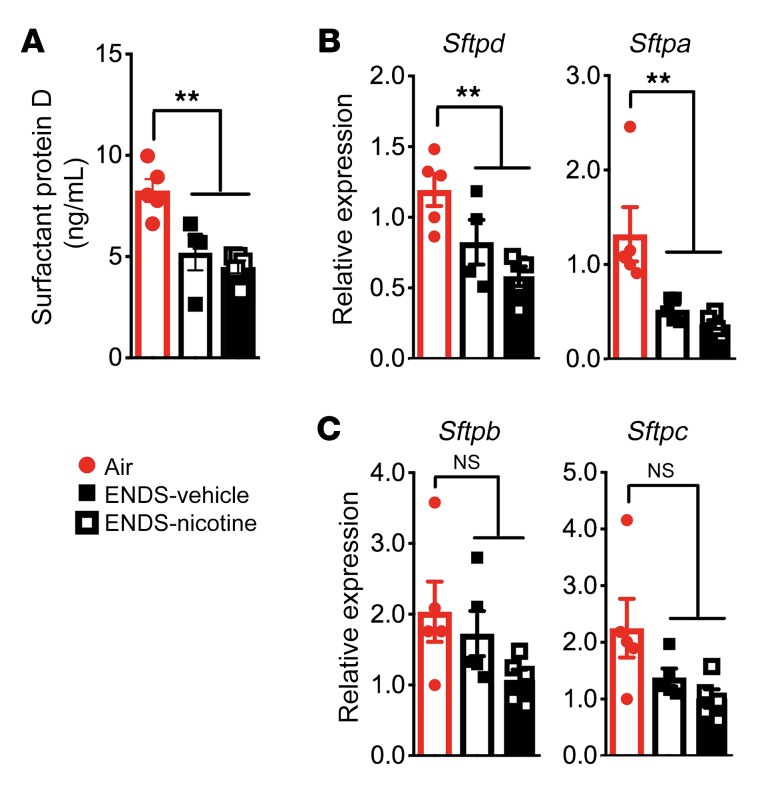
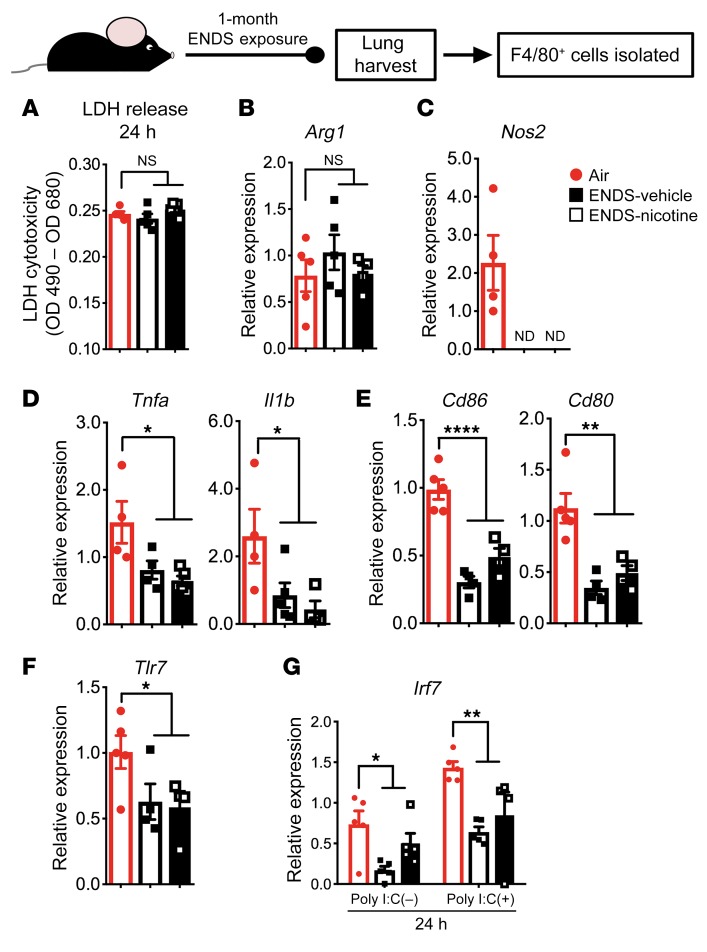
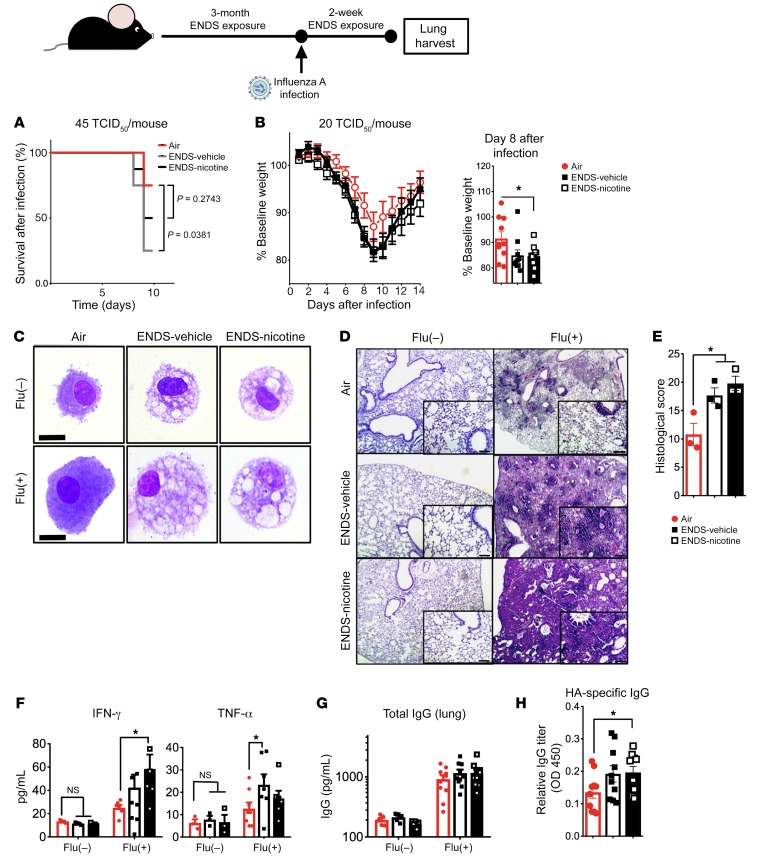
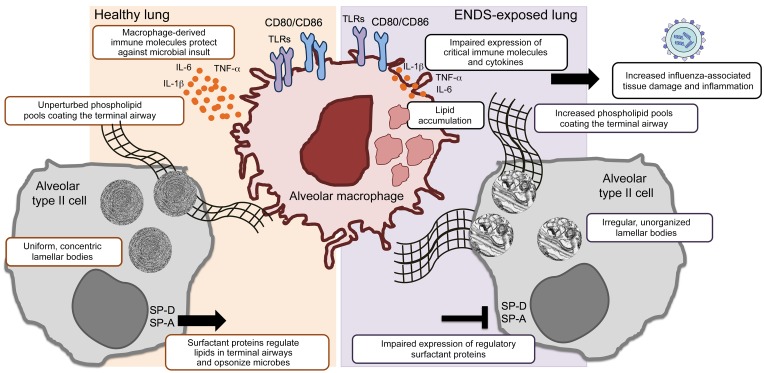
Electronic nicotine delivery systems (ENDS) or e-cigarettes have emerged as a popular recreational tool among adolescents and adults. Although the use of ENDS is often promoted as a safer alternative to conventional cigarettes, few comprehensive studies have assessed the long-term effects of vaporized nicotine and its associated solvents, propylene glycol (PG) and vegetable glycerin (VG). Here, we show that compared with smoke exposure, mice receiving ENDS vapor for 4 months failed to develop pulmonary inflammation or emphysema. However, ENDS exposure, independent of nicotine, altered lung lipid homeostasis in alveolar macrophages and epithelial cells. Comprehensive lipidomic and structural analyses of the lungs revealed aberrant phospholipids in alveolar macrophages and increased surfactant-associated phospholipids in the airway. In addition to ENDS-induced lipid deposition, chronic ENDS vapor exposure downregulated innate immunity against viral pathogens in resident macrophages. Moreover, independent of nicotine, ENDS-exposed mice infected with influenza demonstrated enhanced lung inflammation and tissue damage. Together, our findings reveal that chronic e-cigarette vapor aberrantly alters the physiology of lung epithelial cells and resident immune cells and promotes poor response to infectious challenge. Notably, alterations in lipid homeostasis and immune impairment are independent of nicotine, thereby warranting more extensive investigations of the vehicle solvents used in e-cigarettes.

Keywords: Immunology; Inflammation; Innate immunity.


Conflict of interest statement

Conflict of interest: The authors have declared that no conflict of interest exists.

Figures

Figure 1
Figure 1. Four-month exposure to ENDS does not induce inflammation in the lung.
Mice were exposed to room air (Air), cigarette smoke (Smoke), ENDS-vehicle vapor, or ENDS-nicotine vapor for 4 months and the immune profiles of the lung were quantified. (A) Differential BAL cell numbers for macrophages, neutrophils, and lymphocytes in the airway (n = 5 per group). (B) Histological analysis of lung tissue following 4-month exposure. Representative micrographs of H&E staining. Scale bars: 50 μm. (C) MicroCT quantification of total lung volume (n = 5 or 6 per group). (D) BAL cell expression of RNA transcript for matrix metalloproteinase 12 by qPCR (n = 5 or 6 per group). (E) IL-17A, IL-6, and TNF-α concentrations from mouse lung homogenate measured by multiplex assay (n = 4 or 5 per group). (F) Representative and (G) cumulative flow cytometric analysis of live, CD11b+F4/80Ly6GCD11c+MHCII+ dendritic cells. Numbers in the upper-right corner indicate percentage positive cells for the markers (n = 5 or 6 per group). (H) Representative and (I) cumulative flow cytometric analysis of live, CD3+CD4+RORγt+IL-17A+ T lymphocytes. Numbers in the upper-right corner indicate percentage positive cells for the markers (n = 5 or 6 per group). Significance was determined by Student’s t test or 1-way ANOVA with Bonferroni’s correction for multiple comparisons. ***P < 0.001, **P < 0.01, *P < 0.05. All data shown are representative of 4 or more independent 4-month experiments with n = 5 or 6.
Figure 2
Figure 2. Lipids accumulate in alveolar macrophages in chronic ENDS exposure.
Mice were exposed to Air, Smoke, ENDS-vehicle, or ENDS-nicotine for 4 months. Airway immune cells were then acquired by BAL and were cytocentrifuged onto glass slides. (A) Representative H&E staining of the cytospin preparations reveals intracytoplasmic inclusions in the ENDS-vehicle and ENDS-nicotine groups (black arrows). Scale bar: 10 μm. (B) Representative Oil Red O staining of cytospin preparations reveals lipid accumulation in ENDS-vehicle and ENDS-nicotine groups. All data shown are representative of 3 or more independent 4-month experiments with n = 4 or 5 per group. Scale bar: 25 μm.
Figure 3
Figure 3. TEM imaging of lipid inclusions in alveolar macrophage and alveolar type II pneumocytes.
Following 4 months of exposure, lungs from Air, ENDS-vehicle, and ENDS-nicotine groups were fixed and processed for electron microscopic analysis. (A) Representative micrographs of alveolar macrophages demonstrating lipid inclusions and increased presence of lysosomal compartments in ENDS-vehicle and ENDS-nicotine groups (white arrows). Scale bars: 2000 nm. 80 kV high voltage. (B) Higher magnification of the lipid inclusions (right) and lysosomes (left) observed in ENDS-vehicle and ENDS-nicotine groups. Scale bars: 200 nm. 80 kV high voltage. (C) Representative micrographs of alveolar type II pneumocytes (ATIIs) demonstrating normal, uniform lamellar bodies in AIR-exposed mice (red arrow) and atypical lamellar body structures in ENDS-vehicle and ENDS-nicotine groups (white arrows). Scale bars: 2000 nm. 80 kV high voltage. (D) Higher magnification of the representative lamellar bodies observed in AIR, ENDS-vehicle, and ENDS-nicotine groups. Scale bars: 500 nm. 80 kV high voltage. (E) Blinded quantification of atypical lamellar bodies observed within ATIIs. The quantified results are expressed as the percentage of atypical lamellar bodies per total lamellar body count in each cell (mean ± SEM). n = 5 or 6 per group. Each data point represents a single ATII, all of which were located and imaged by scanning 3 or more independent mounted grids per experimental group. Significance was determined by Student’s t test. *P < 0.05.
Figure 4
Figure 4. ENDS exposure independent of nicotine increases phospholipids in BAL cells.
(A) Heatmap demonstrating the upregulated phospholipids in ENDS-vehicle and ENDS-nicotine groups (fold change > 1.5) from the lipidomic analysis conducted on the BAL cells. Heatmap values represent averages from the 3 pooled samples per group. Changes shown are relative to the Air controls. (B) Quantification of total intracellular phospholipid content in pelleted BAL cells. n = 5–7 per group. The quantified results are expressed as means ± SEM. Significance was determined by Student’s t test and corrected for multiple comparisons. *P < 0.05. CE, cholesterol ester; TG, triglyceride; PE, phosphatidylethanolamine; PC, phosphatidylcholine; PS, phosphatidylserine; PI, phosphatidylinositol; PA, phosphatidic acid; PG, phosphatidylglycerol.
Figure 5
Figure 5. ENDS exposure independent of nicotine increases disaturated phospholipid pools in BAL fluid.
(A) Heatmap depicting the upregulated phospholipid species in the ENDS-vehicle and ENDS-nicotine groups from the lipidomic analysis conducted on the BAL fluid. n = 3 pooled samples per group. (B and C) Quantification of BAL fluid phospholipids based on saturation of the lipid acyl groups. n = 3 per group. The quantified results are expressed as percentage of total lipid signal (mean ± SEM). DB, double bond. (D) Quantification of known surfactant-associated species in BAL fluid. n = 3 per group. The quantified results are expressed as percentage of total lipid signal (mean ± SEM). Significance was determined by 1-way ANOVA with Bonferroni’s correction for multiple comparisons. *P < 0.05. CE, cholesterol ester; TG, triglyceride; PE, phosphatidylethanolamine; PC, phosphatidylcholine; PS, phosphatidylserine; PI, phosphatidylinositol; PA, phosphatidic acid; PG, phosphatidylglycerol; SM, sphingomyelin; MG, monoacylglycerol; MGDG, mono/diacylglycerol.
Figure 6
Figure 6. Four-month exposure to ENDS vapor reduces the expression of surfactant proteins.
(A) Quantification of SP-D by ELISA from BAL fluid. n = 4 or 5 per group. (B and C) Relative gene expression of surfactant-associated proteins (SP-A, SP-B, SP-C, and SP-D) from whole lung homogenate. n = 4 or 5 per group. The quantified results are expressed as means ± SEM. Significance was determined by 1-way ANOVA with Bonferroni’s correction for multiple comparisons. **P < 0.01. NS, not significant.
Figure 7
Figure 7. One-month exposure to ENDS vapor attenuates lung-resident macrophage function.
Lung-resident F4/80+ macrophages were isolated from whole lung tissue using magnetic beads following 1 month of exposure. Cells were cultured for 24 hours following isolation and supernatants and cells were harvested for the analyses. Individual data points represent technical replicates from pooled lungs of 4 mice per treatment group. (A) Absorbance values following the colorimetric, lactate dehydrogenase (LDH) cytotoxicity assay from 24-hour cultures of Air-, ENDS-vehicle–, and ENDS-nicotine–exposed groups. (B and C) Relative gene expression for Arg1 and Nos2 derived from RNA samples acquired from the cells after 24-hour culture. (DF) Relative gene expression for (D) cytokines Tnfa and Il1b, (E) costimulatory molecules Cd86 and Cd80, and (F) viral recognition receptor Tlr7, derived from RNA samples in each treatment group acquired from the cells after 24-hour culture. (G) Relative gene expression for the transcription factor Irf7, a critical factor for type I IFN production, derived from RNA samples acquired from the cells in each treatment group after 24-hour culture. Cells were treated with either polyinosinic:polycytidylic acid (poly I:C) at a concentration of 10 μg/mL or PBS vehicle. All quantified results are expressed as means ± SEM. n = 4 or 5 per group. Significance was determined by 1-way ANOVA with Bonferroni’s correction for multiple comparisons. ****P < 0.0001, **P < 0.01, *P < 0.05. All data shown are representative of 3 or more independent 1-month experiments with n = 4 or 5 per group. NS, not significant; ND, none detected.
Figure 8
Figure 8. ENDS exposure alters immune responses and recovery from influenza A infection.
Eight-week-old mice were exposed to ENDS vapor or room air for 3 months. Subsequently, mice were infected with influenza A (45 TCID50/mouse or 20 TCID50/mouse). (A) Survival curve following infection with higher-titer viral infection — 45 TCID50/mouse. n = 8 per group. Significance was assessed by the log-rank (Mantel-Cox) test. *P < 0.05. (B) The weight loss and recovery curve following infection with influenza virus (20 TCID50/mouse) with quantification of weight loss on day 8 of infection. Significance was determined by Student’s t test. *P < 0.05; n = 10 per group. (C) Representative BAL cytospin preparations demonstrating the intracytoplasmic inclusions found in alveolar macrophages irrespective of infection status. Scale bars: 20 μm. (D) Histological analysis of lung tissue on day 14 following infection. Representative micrographs of H&E staining. Scale bars: 10 μm. (E) Objective quantification of pathological changes in lung H&E micrographs on day 14 following infection. n = 3 per group. (F) Cytokine concentrations for IFN-γ and TNF-α on day 14 following infection as determined by cytokine multiplex arrays. n = 5–9 per group. Significance was determined by Student’s t test. *P < 0.05. (G and H) Antibody titers for total (G) and hemagglutinin-specific IgG (H) from whole lung homogenate on day 14 following infection as determined by ELISA (n = 5–10 per group). Significance was determined by Student’s t test or 1-way ANOVA with Bonferroni’s correction for multiple comparisons. *P < 0.05. All data shown are representative of 3 or more independent experiments with n = 5–9 per group.
Figure 9
Figure 9. Summary model: ENDS-mediated changes in the lung upon chronic exposure.
The lung’s delicate surfactant layer is of critical importance to the organ’s overall physiology and innate immune function. Both alveolar type II cells and alveolar macrophages are the principal subsets that maintain and catabolize surfactant at the liquid-air interface. Our study reveals that ENDS exposure disrupts both the lipid and protein components of pulmonary surfactant, increasing phospholipid pools in the airway and decreasing the expression of the regulatory surfactant proteins SP-A and SP-D. Lipid deposition and impaired immune function are distinct features of alveolar macrophages upon chronic ENDS treatment. Upon viral infection, ENDS-exposed mice exhibit increased morbidity and mortality with excessive pulmonary damage and inflammation late in infection. Of chief importance, the ENDS-mediated effects observed in our model are independent of the presence of nicotine.

Comment in

References

    1. Regan AK, Promoff G, Dube SR, Arrazola R. Electronic nicotine delivery systems: adult use and awareness of the ‘e-cigarette’ in the USA. Tob Control. 2013;22(1):19–23. doi: 10.1136/tobaccocontrol-2011-050044. - DOI - PubMed
    1. Gentzke AS, et al. Vital signs: Tobacco product use among middle and high school students - United States, 2011-2018. MMWR Morb Mortal Wkly Rep. 2019;68(6):157–164. doi: 10.15585/mmwr.mm6806e1. - DOI - PMC - PubMed
    1. Mirbolouk M, et al. Prevalence and distribution of e-cigarette use among U.S. adults: Behavioral Risk Factor Surveillance System, 2016. Ann Intern Med. 2018;169(7):429–438. doi: 10.7326/M17-3440. - DOI - PMC - PubMed
    1. McCarthy M. E-cigarettes are major threat to young people’s health, says US surgeon general. BMJ. 2016;355:i6652. - PubMed
    1. Zhu SH, et al. Four hundred and sixty brands of e-cigarettes and counting: implications for product regulation. Tob Control. 2014;23(Suppl 3):iii3–iii9. doi: 10.1136/tobaccocontrol-2014-051670. - DOI - PMC - PubMed

Publication types

MeSH terms