

Quantification of whole-brain oxygenation extraction fraction and cerebral metabolic rate of oxygen consumption in adults with sickle cell anemia using individual T2 -based oxygenation calibrations
- PMID: 31483528
- PMCID: PMC6879787
- DOI: 10.1002/mrm.27972
Quantification of whole-brain oxygenation extraction fraction and cerebral metabolic rate of oxygen consumption in adults with sickle cell anemia using individual T2 -based oxygenation calibrations
Abstract
Purpose: To evaluate different T2 -oxygenation calibrations for estimating venous oxygenation in people with sickle cell anemia (SCA).
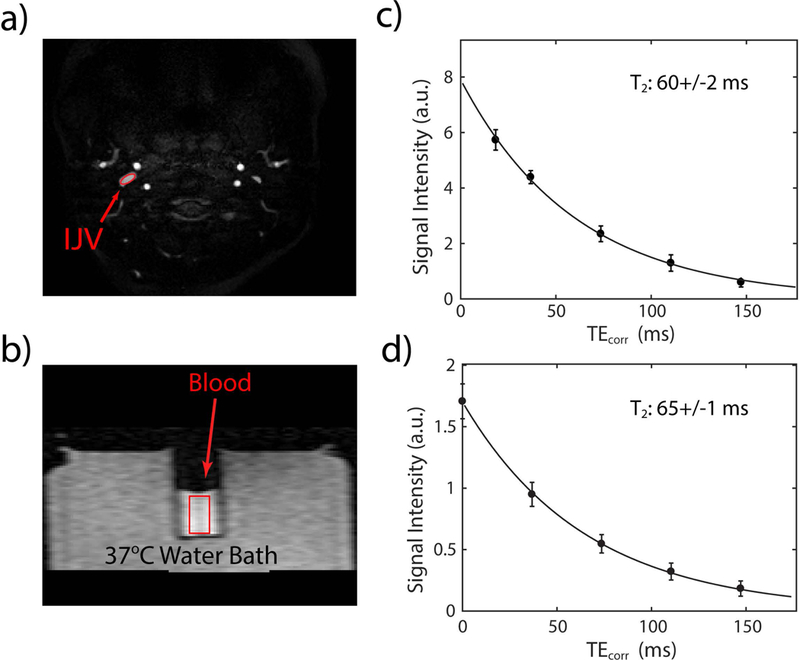
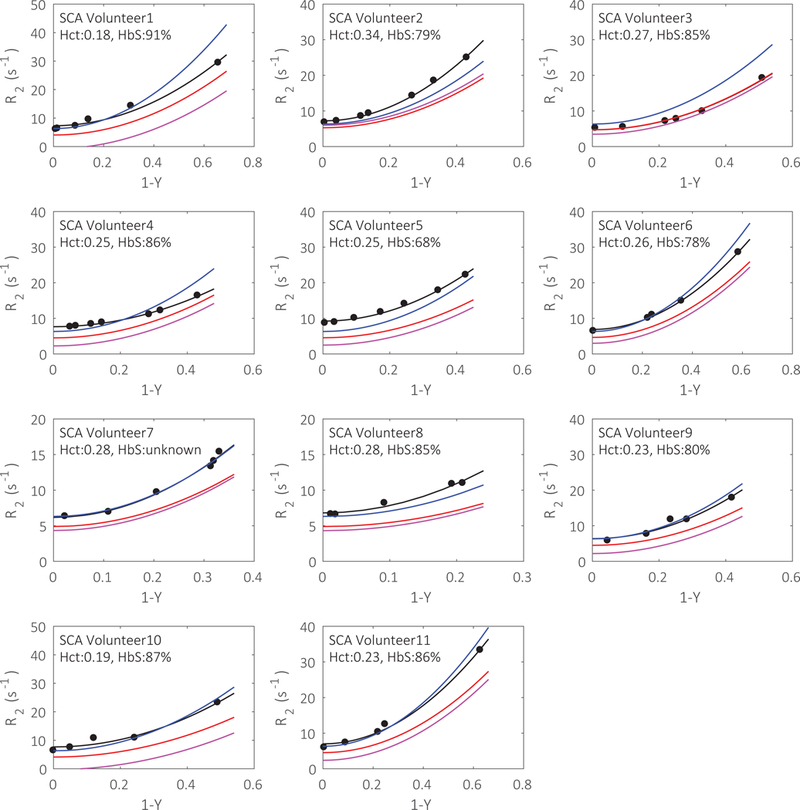
Methods: Blood T2 values were measured at 3 T in the internal jugular veins of 12 healthy volunteers and 11 SCA participants with no history of stroke, recent transfusion, or renal impairment. T2 -oxygenation relationships of both sickled and normal blood samples were calibrated individually and compared with values generated from published models. After converting venous T2 values to venous oxygenation, whole-brain oxygen extraction fraction and cerebral metabolic rate of oxygen were calculated.
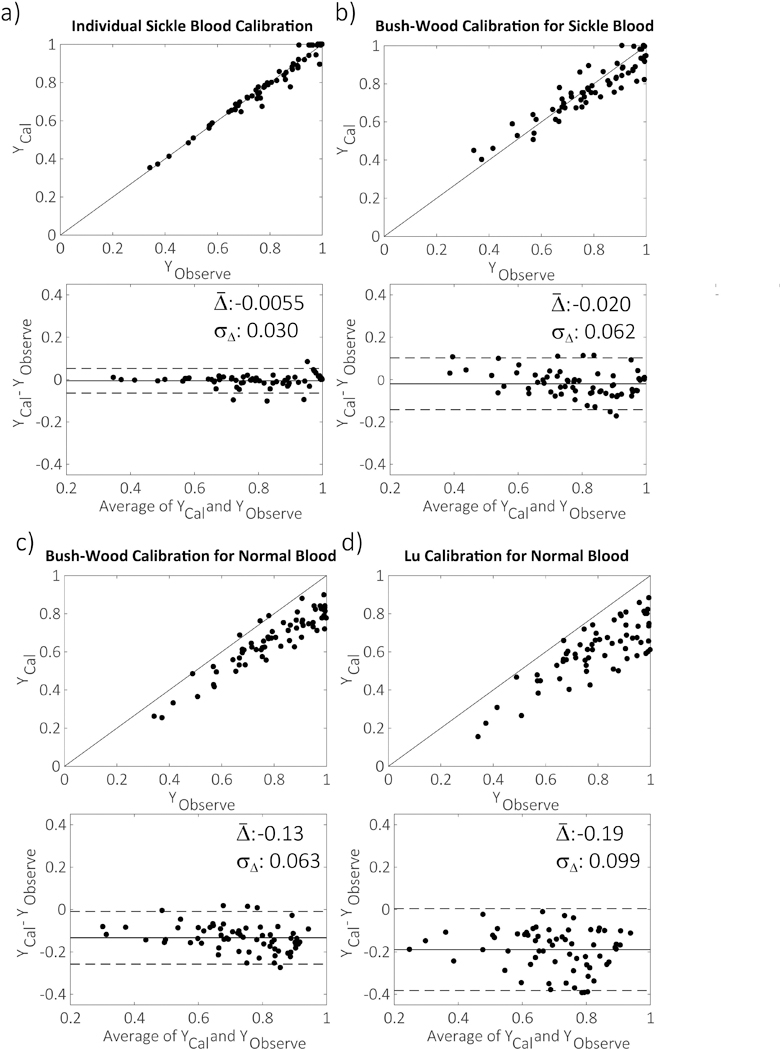
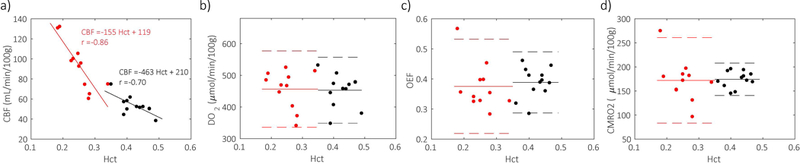
Results: Sickle blood samples' oxygenation values calculated from our individual calibrations agreed well with measurements using a blood analyzer, whereas previous T2 calibrations based on normal blood samples showed 13%-19% underestimation. Meanwhile, oxygenation values calculated from previous grouped T2 calibration for sickle blood agreed well with experimental measurement on averaged values, but showed up to 20% variation for several individual samples. Using individual T2 calibrations, the whole-brain oxygen extraction fraction and cerebral metabolic rate of oxygen of SCA participants were 0.38 ± 0.08 and 172 ± 42 µmol/min/100 g, respectively, which were comparable to those values measured on healthy volunteers.
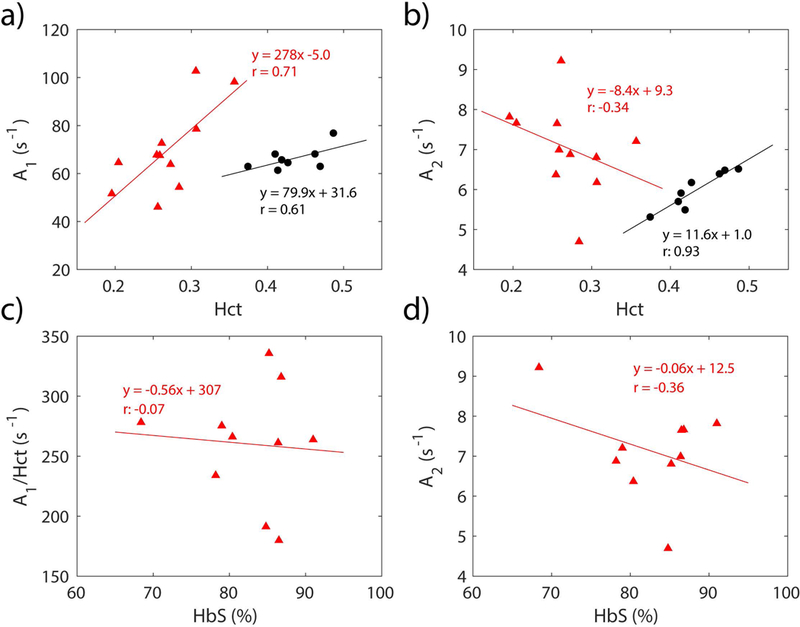
Conclusion: Our results confirm that sickle blood T2 values not only depend on the hematocrit and oxygenation values, but also on other hematological factors. The individual T2 calibrations minimized the effect of heterogeneity of sickle blood between different SCA populations and improved the accuracy of T2 -based oximetry. The measured oxygen extraction fraction and cerebral metabolic rate of oxygen of this group of SCA participants were found to not differ significantly from those of healthy individuals.
Keywords: CMRO2; HbS; OEF; T2 oximetry; blood T2; sickle cell disease.
© 2019 International Society for Magnetic Resonance in Medicine.
Figures
References
-
- Hurlet-Jensen AM, Prohovnik I, Pavlakis SG, Piomelli S. Effects of total hemoglobin and hemoglobin S concentration on cerebral blood flow during transfusion therapy to prevent stroke in sickle cell disease. Stroke. 1994;25(8):1688–1692. - PubMed
-
- Herold S, Brozovic M, Gibbs J, et al. Measurement of regional cerebral blood flow, blood volume and oxygen metabolism in patients with sickle cell disease using positron emission tomography. Stroke. 1986;17(4):692–698. - PubMed
-
- Prohovnik I, Pavlakis SG, Piomelli S, Bello J, Mohr JP, Hilal S. Cerebral hyperemia, stroke, and transfusion in sickle cell disease. Neurology. 1989;39:344. - PubMed
-
- Prohovnik I, Hurlet-jensen A, Adams R, et al. Hemodynamic etiology of elevated flow velocity and stroke in sickle-cell disease. J Cereb Blood Flow Metab. 2009;29(4):803–810. - PubMed
Publication types
MeSH terms
Substances
Grants and funding
LinkOut - more resources
Full Text Sources
Medical
