

Noninvasive imaging of renal urea handling by CEST-MRI
- PMID: 31483529
- PMCID: PMC6879789
- DOI: 10.1002/mrm.27968
Noninvasive imaging of renal urea handling by CEST-MRI
Abstract
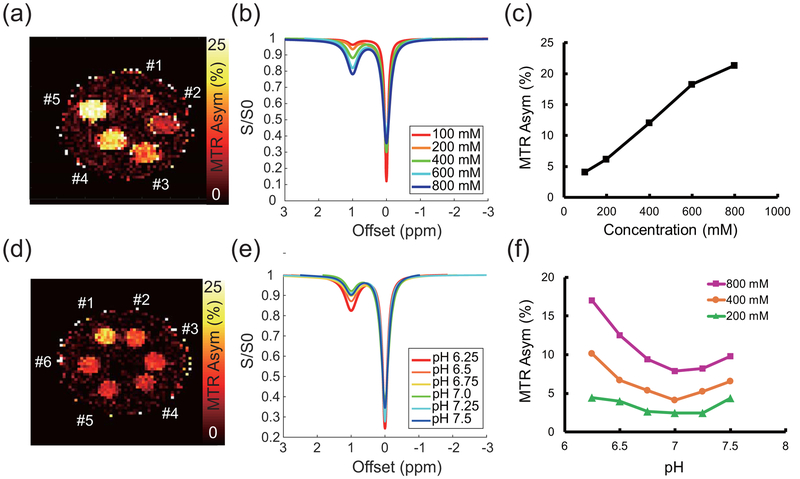
Purpose: Renal function is characterized by concentration of urea for removal in urine. We tested urea as a CEST-MRI contrast agent for measurement of the concentrating capacity of distinct renal anatomical regions.
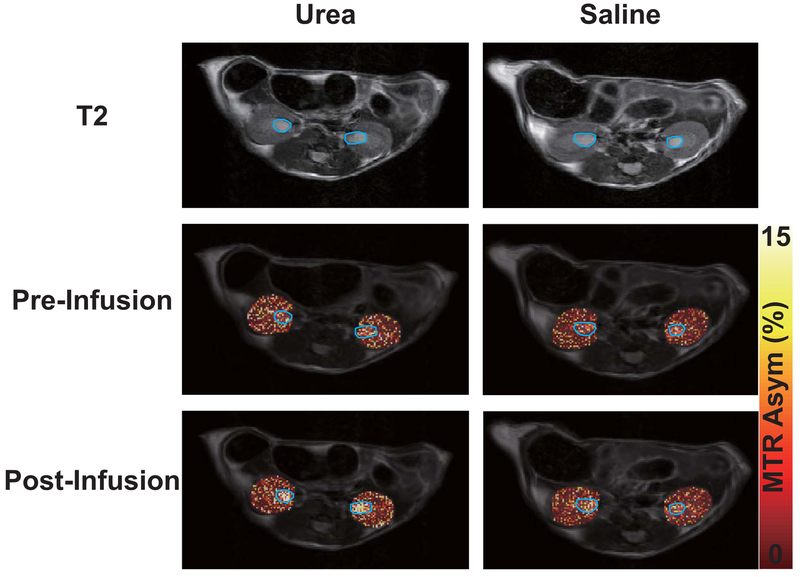
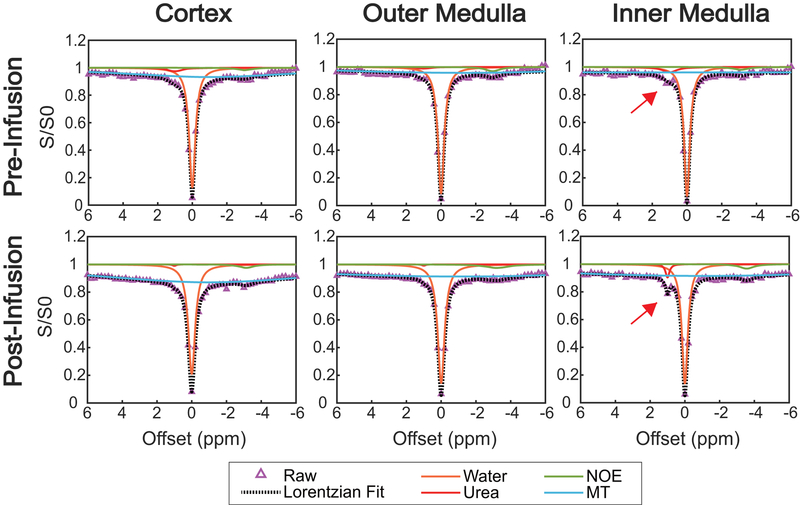
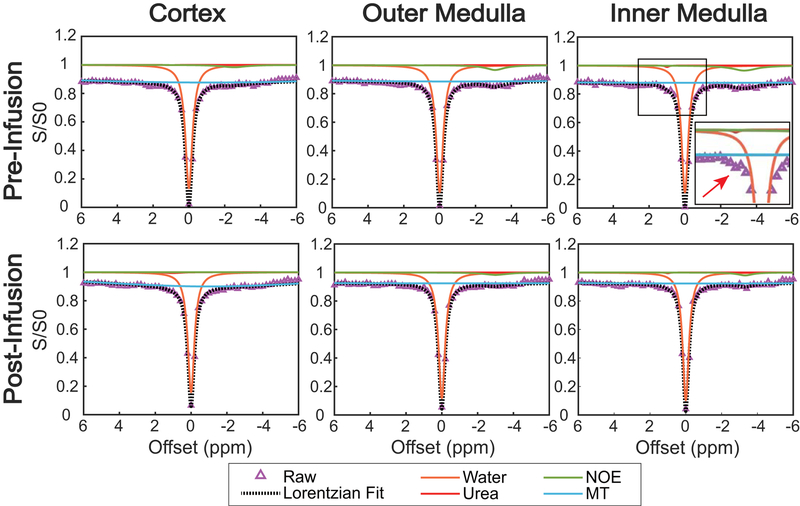
Methods: The CEST contrast of urea was examined using phantoms with different concentrations and pH levels. Ten C57BL/6J mice were scanned twice at 7 T, once following intraperitoneal injection of 2M 150 µL urea and separately following an identical volume of saline. Kidneys were segmented into regions encompassing the cortex, outer medulla, and inner medulla and papilla to monitor spatially varying urea concentration. Z-spectra were acquired before and 20 minutes after injection, with dynamic scanning of urea handling performed in between via serial acquisition of CEST images acquired following saturation at +1 ppm.
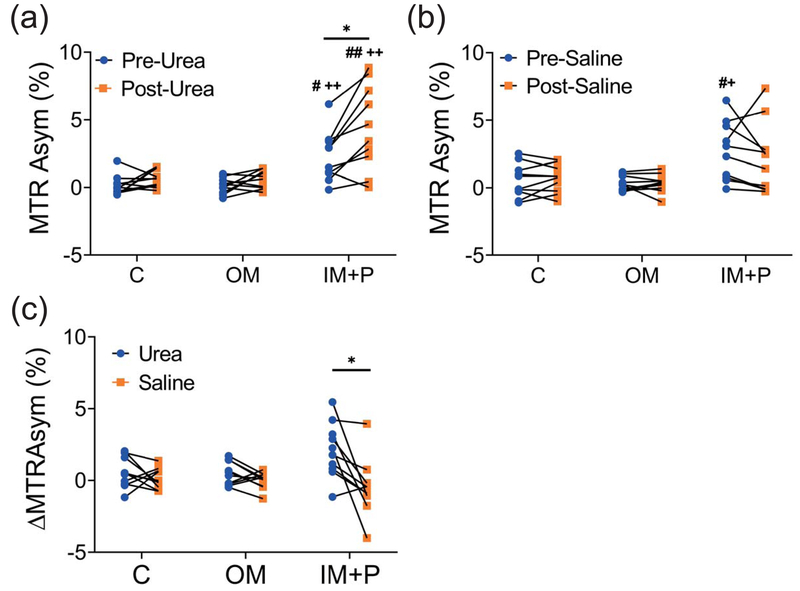
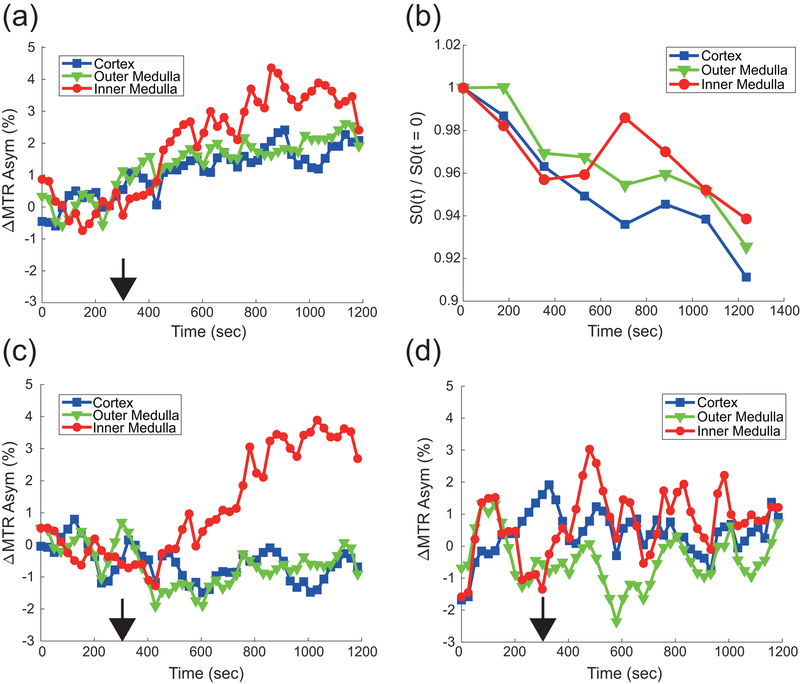
Results: Phantom experiments revealed concentration and pH-dependent CEST contrast of urea that was both acid- and base-catalyzed. Z-spectra acquired before injection showed significantly higher CEST contrast in the inner medulla and papilla (2.3% ± 1.9%) compared with the cortex (0.15% ± 0.75%, P = .011) and outer medulla (0.12% ± 0.58%, P = .008). Urea infusion increased CEST contrast in the inner medulla and papilla by 2.1% ± 1.9% (absolute), whereas saline infusion decreased CEST contrast by -0.5% ± 2.0% (absolute, P = .028 versus urea). Dynamic scanning revealed that thermal drift and diuretic status are confounding factors.
Conclusion: Urea CEST has a potential of monitoring renal function by capturing the spatially varying urea concentrating ability of the kidneys.
Keywords: CEST; MRI; kidney; urea.
© 2019 International Society for Magnetic Resonance in Medicine.
Figures

Similar articles
-
Delayed urea differential enhancement CEST (dudeCEST)-MRI with T1 correction for monitoring renal urea handling.Magn Reson Med. 2021 May;85(5):2791-2804. doi: 10.1002/mrm.28583. Epub 2020 Nov 12. Magn Reson Med. 2021. PMID: 33180343 Free PMC article.
-
Systematic Evaluation of Amide Proton Chemical Exchange Saturation Transfer at 3 T: Effects of Protein Concentration, pH, and Acquisition Parameters.Invest Radiol. 2016 Oct;51(10):635-46. doi: 10.1097/RLI.0000000000000292. Invest Radiol. 2016. PMID: 27272542
-
A generalized ratiometric chemical exchange saturation transfer (CEST) MRI approach for mapping renal pH using iopamidol.Magn Reson Med. 2018 Mar;79(3):1553-1558. doi: 10.1002/mrm.26817. Epub 2017 Jul 7. Magn Reson Med. 2018. PMID: 28686805 Free PMC article.
-
A review of optimization and quantification techniques for chemical exchange saturation transfer MRI toward sensitive in vivo imaging.Contrast Media Mol Imaging. 2015 May-Jun;10(3):163-178. doi: 10.1002/cmmi.1628. Epub 2015 Jan 12. Contrast Media Mol Imaging. 2015. PMID: 25641791 Free PMC article. Review.
-
Clinical applications of chemical exchange saturation transfer (CEST) MRI.J Magn Reson Imaging. 2018 Jan;47(1):11-27. doi: 10.1002/jmri.25838. Epub 2017 Aug 9. J Magn Reson Imaging. 2018. PMID: 28792646 Free PMC article. Review.
Cited by
-
Quasi-steady state chemical exchange saturation transfer (QUASS CEST) analysis-correction of the finite relaxation delay and saturation time for robust CEST measurement.Magn Reson Med. 2021 Jun;85(6):3281-3289. doi: 10.1002/mrm.28653. Epub 2021 Jan 23. Magn Reson Med. 2021. PMID: 33486816 Free PMC article.
-
Repurposing Clinical Agents for Chemical Exchange Saturation Transfer Magnetic Resonance Imaging: Current Status and Future Perspectives.Pharmaceuticals (Basel). 2020 Dec 24;14(1):11. doi: 10.3390/ph14010011. Pharmaceuticals (Basel). 2020. PMID: 33374213 Free PMC article. Review.
-
Chemical exchange saturation transfer magnetic resonance imaging of the kidney: applications and challenges.Abdom Radiol (NY). 2025 May 31. doi: 10.1007/s00261-025-04980-2. Online ahead of print. Abdom Radiol (NY). 2025. PMID: 40448845 Review. No abstract available.
-
Dynamic Contrast Enhanced-MR CEST Urography: An Emerging Tool in the Diagnosis and Management of Upper Urinary Tract Obstruction.Tomography. 2021 Mar 2;7(1):80-94. doi: 10.3390/tomography7010008. Tomography. 2021. PMID: 33801533 Free PMC article. Review.
-
Novel non‑metal‑based contrast agents for MR imaging: Emerging approaches and clinical perspectives (Review).Int J Oncol. 2025 Aug;67(2):70. doi: 10.3892/ijo.2025.5776. Epub 2025 Jul 19. Int J Oncol. 2025. PMID: 40682851 Free PMC article. Review.
References
Publication types
MeSH terms
Substances
Grants and funding
LinkOut - more resources
Full Text Sources
Medical
