

Test-retest reproducibility of a multi-atlas automated segmentation tool on multimodality brain MRI
- PMID: 31483562
- PMCID: PMC6790328
- DOI: 10.1002/brb3.1363
Test-retest reproducibility of a multi-atlas automated segmentation tool on multimodality brain MRI
Abstract
Introduction: The increasing use of large sample sizes for population and personalized medicine requires high-throughput tools for imaging processing that can handle large amounts of data with diverse image modalities, perform a biologically meaningful information reduction, and result in comprehensive quantification. Exploring the reproducibility of these tools reveals the specific strengths and weaknesses that heavily influence the interpretation of results, contributing to transparence in science.
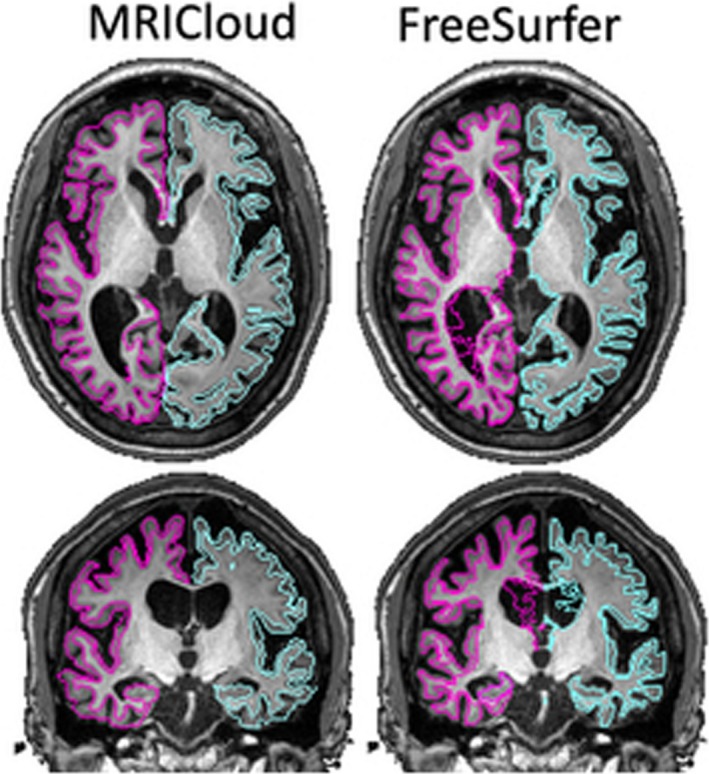
Methods: We tested-retested the reproducibility of MRICloud, a free automated method for whole-brain, multimodal MRI segmentation and quantification, on two public, independent datasets of healthy adults.
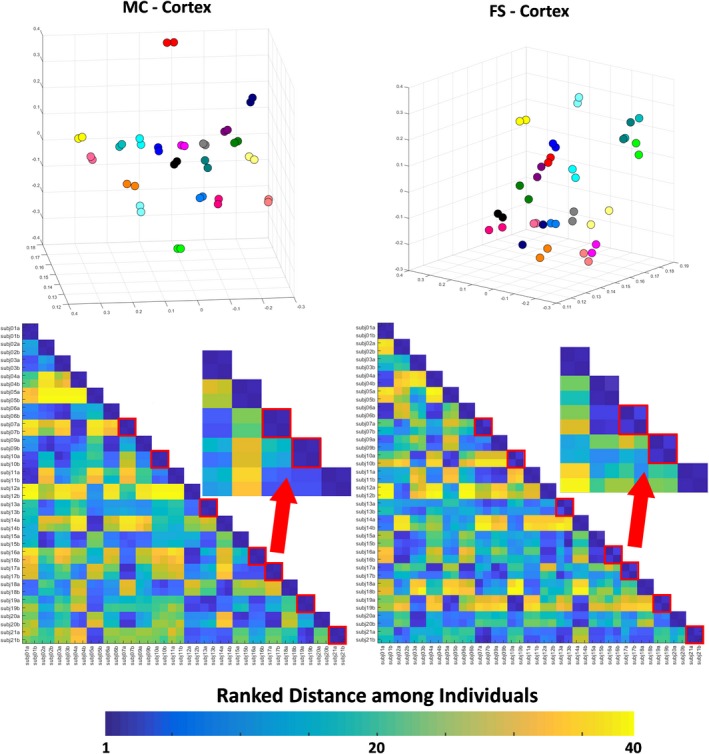
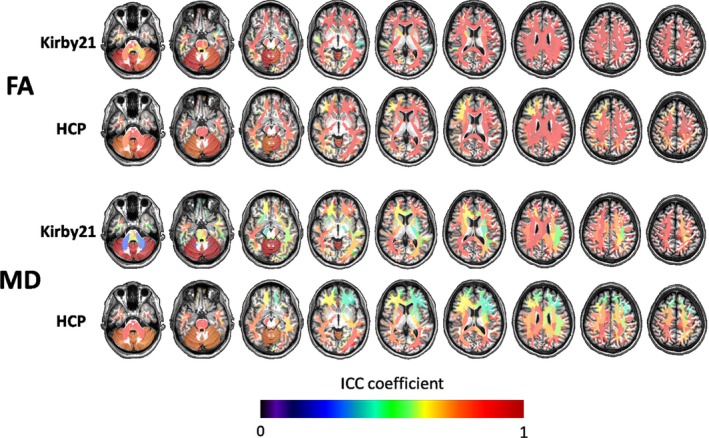
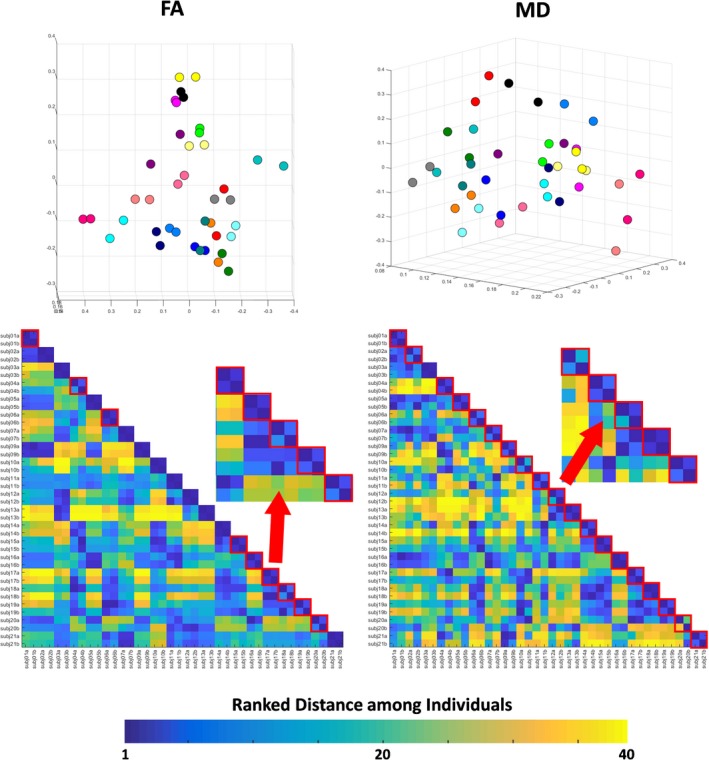
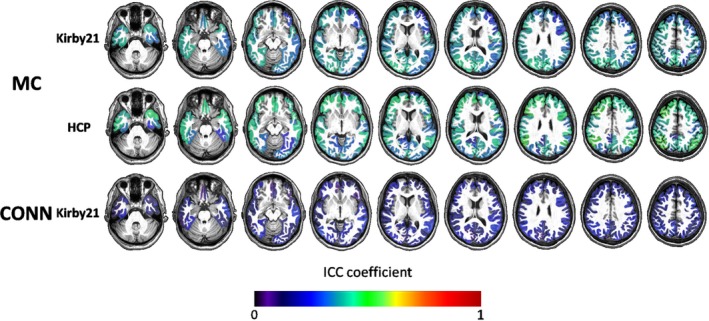
Results: The reproducibility was extremely high for T1-volumetric analysis, high for diffusion tensor images (DTI) (however, regionally variable), and low for resting-state fMRI.
Conclusion: In general, the reproducibility of the different modalities was slightly superior to that of widely used software. This analysis serves as a normative reference for planning samples and for the interpretation of structure-based MRI studies.
Keywords: automated segmentation; multimodality brain MRI; reproducibility; test-retest.
© 2019 The Authors. Brain and Behavior published by Wiley Periodicals, Inc.
Conflict of interest statement
None declared.
Figures


Similar articles
-
Reproducibility of the Structural Connectome Reconstruction across Diffusion Methods.J Neuroimaging. 2016 Jan-Feb;26(1):46-57. doi: 10.1111/jon.12298. Epub 2015 Oct 14. J Neuroimaging. 2016. PMID: 26464179
-
Inter-scanner reproducibility of brain volumetry: influence of automated brain segmentation software.BMC Neurosci. 2020 Sep 4;21(1):35. doi: 10.1186/s12868-020-00585-1. BMC Neurosci. 2020. PMID: 32887546 Free PMC article.
-
Magnetic Resonance Imaging in Huntington's Disease.Methods Mol Biol. 2018;1780:303-328. doi: 10.1007/978-1-4939-7825-0_16. Methods Mol Biol. 2018. PMID: 29856026
-
Potential and limitations of diffusion MRI tractography for the study of language.Brain Lang. 2014 Apr;131:65-73. doi: 10.1016/j.bandl.2013.06.007. Epub 2013 Jul 30. Brain Lang. 2014. PMID: 23910928 Review.
-
Reproducible Research Practices in Magnetic Resonance Neuroimaging: A Review Informed by Advanced Language Models.Magn Reson Med Sci. 2024 Jul 1;23(3):252-267. doi: 10.2463/mrms.rev.2023-0174. Epub 2024 Jun 19. Magn Reson Med Sci. 2024. PMID: 38897936 Free PMC article. Review.
Cited by
-
Mean kurtosis-Curve (MK-Curve) correction improves the test-retest reproducibility of diffusion kurtosis imaging at 3 T.NMR Biomed. 2023 Mar;36(3):e4856. doi: 10.1002/nbm.4856. Epub 2022 Nov 22. NMR Biomed. 2023. PMID: 36285630 Free PMC article.
-
Automatic Segmentation of Heschl Gyrus and Planum Temporale by MRICloud.Otol Neurotol Open. 2024 Jul 5;4(3):e056. doi: 10.1097/ONO.0000000000000056. eCollection 2024 Sep. Otol Neurotol Open. 2024. PMID: 39328866 Free PMC article.
-
Computerized paired associate learning performance and imaging biomarkers in older adults without dementia.Brain Imaging Behav. 2022 Apr;16(2):921-929. doi: 10.1007/s11682-021-00583-9. Epub 2021 Oct 23. Brain Imaging Behav. 2022. PMID: 34686968 Free PMC article.
-
The longitudinal progression of MRI changes in pre-ataxic carriers of SCA3/MJD.J Neurol. 2023 Sep;270(9):4276-4287. doi: 10.1007/s00415-023-11763-6. Epub 2023 May 16. J Neurol. 2023. PMID: 37193796 Free PMC article.
-
A Volumetric Study of the Corpus Callosum in the Turkish Population.J Neurol Surg B Skull Base. 2021 Jun 30;83(4):443-450. doi: 10.1055/s-0041-1731033. eCollection 2022 Aug. J Neurol Surg B Skull Base. 2021. PMID: 35903660 Free PMC article.
References
-
- Alexander, A. L. , Lee, J. E. , Wu, Y. C. , & Field, A. S. (2006). Comparison of diffusion tensor imaging measurements at 3.0 T versus 1.5 T with and without parallel imaging. Neuroimaging Clinics of North America, 16, 299–309. - PubMed
Publication types
MeSH terms
Grants and funding
LinkOut - more resources
Full Text Sources
Medical
