. 2019 Sep 4;17(9):e3000419.
doi: 10.1371/journal.pbio.3000419. eCollection 2019 Sep.

Strong preference for autaptic self-connectivity of neocortical PV interneurons facilitates their tuning to γ-oscillations

Affiliations

Strong preference for autaptic self-connectivity of neocortical PV interneurons facilitates their tuning to γ-oscillations

Charlotte Deleuze et al. PLoS Biol. .

Abstract

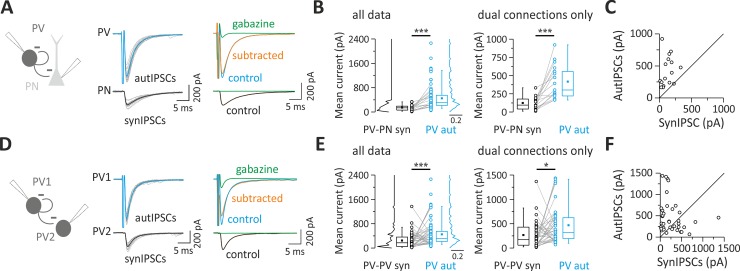
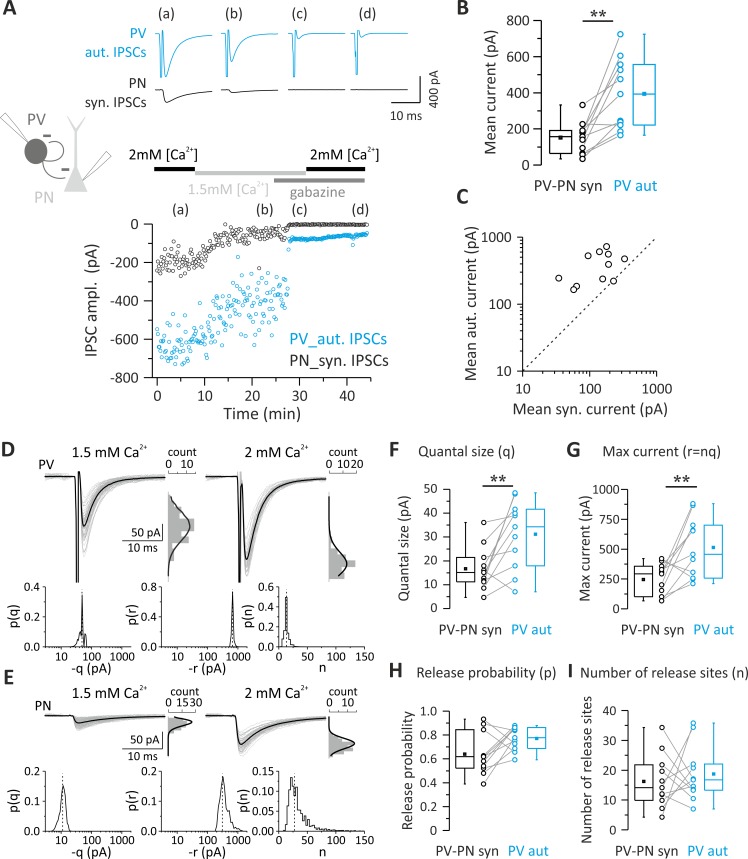
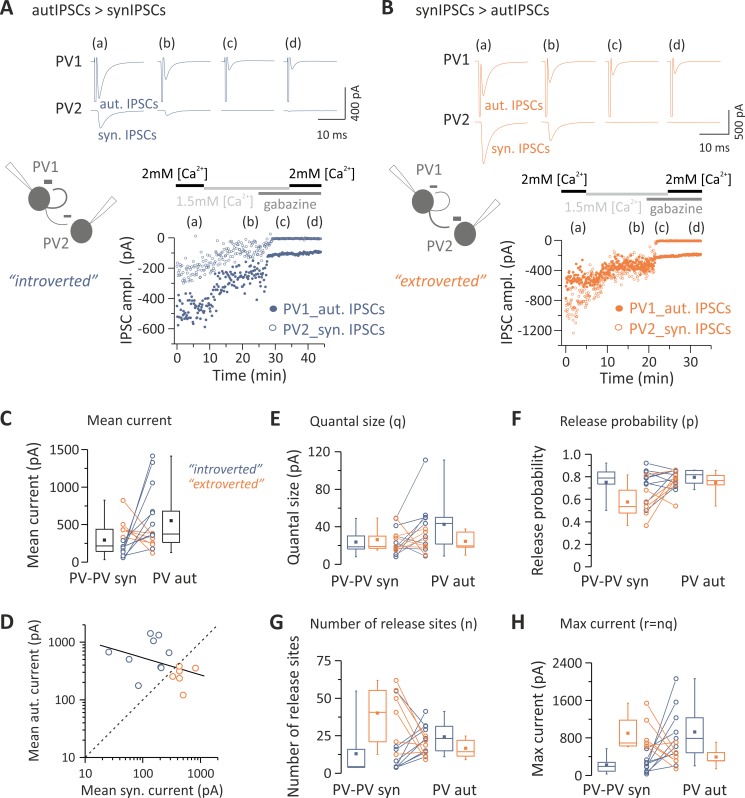
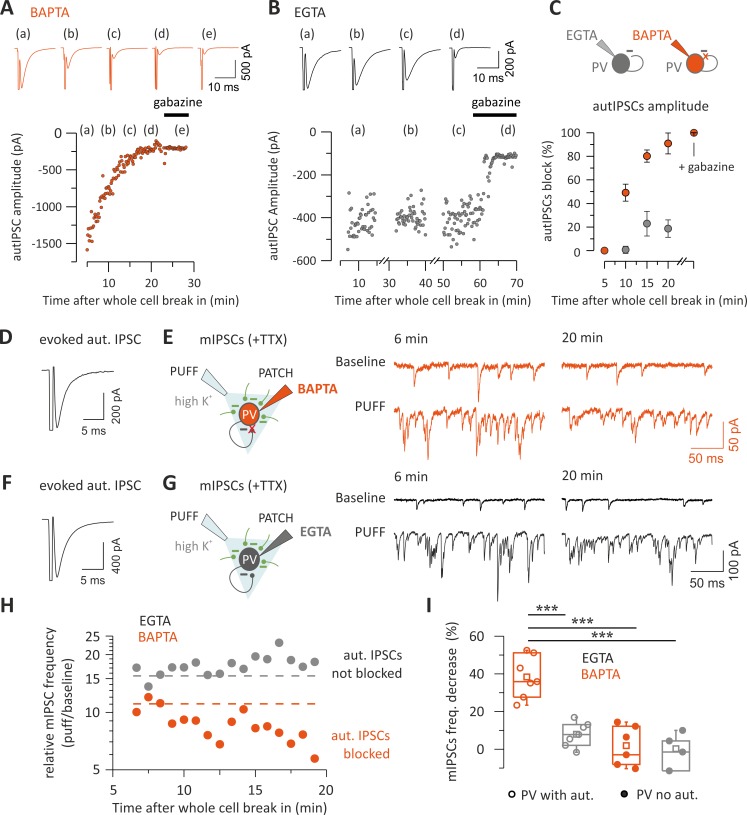
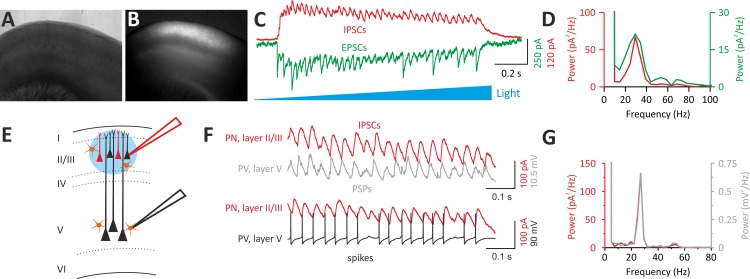
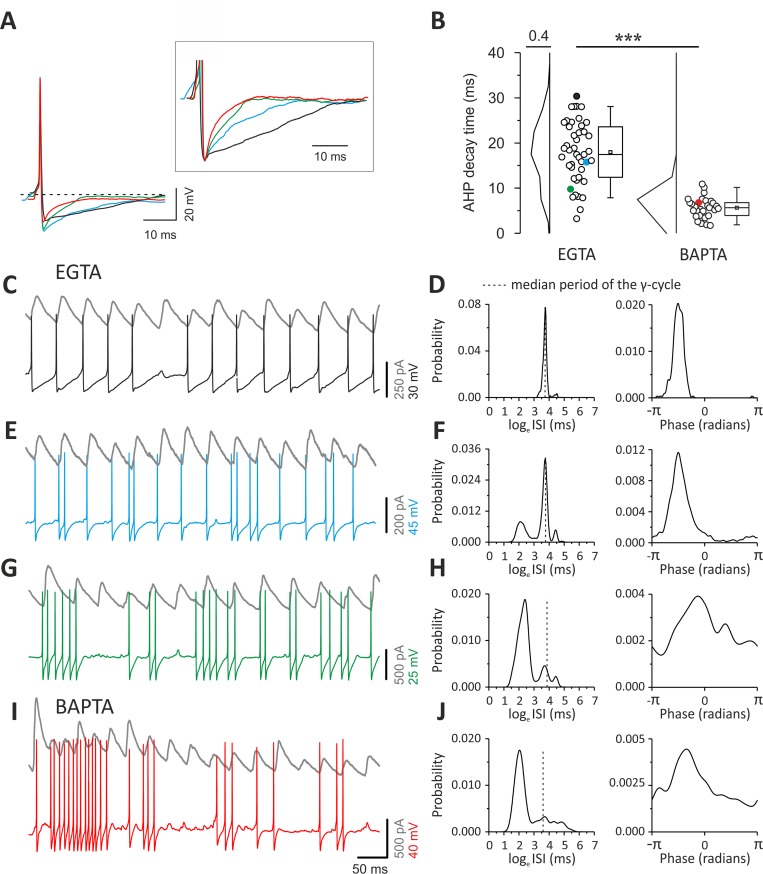
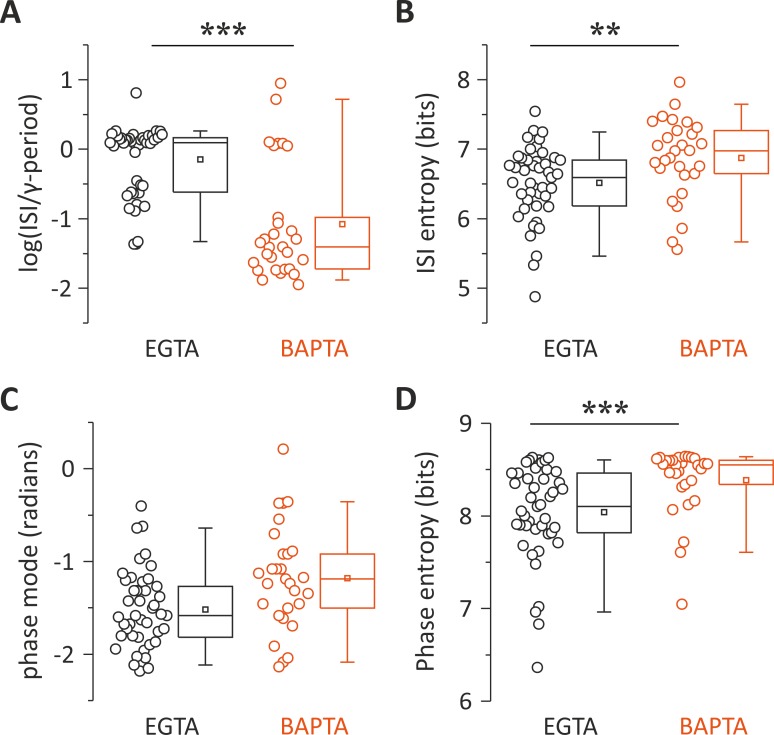
Parvalbumin (PV)-positive interneurons modulate cortical activity through highly specialized connectivity patterns onto excitatory pyramidal neurons (PNs) and other inhibitory cells. PV cells are autoconnected through powerful autapses, but the contribution of this form of fast disinhibition to cortical function is unknown. We found that autaptic transmission represents the most powerful inhibitory input of PV cells in neocortical layer V. Autaptic strength was greater than synaptic strength onto PNs as a result of a larger quantal size, whereas autaptic and heterosynaptic PV-PV synapses differed in the number of release sites. Overall, single-axon autaptic transmission contributed to approximately 40% of the global inhibition (mostly perisomatic) that PV interneurons received. The strength of autaptic transmission modulated the coupling of PV-cell firing with optogenetically induced γ-oscillations, preventing high-frequency bursts of spikes. Autaptic self-inhibition represents an exceptionally large and fast disinhibitory mechanism, favoring synchronization of PV-cell firing during cognitive-relevant cortical network activity.


Conflict of interest statement

The authors have declared that no competing interests exist.

Figures

Fig 1
Fig 1. Layer V PV cells connect more powerfully with themselves via autaptic contacts than with other synaptic partners.
(A) Unitary autaptic and synaptic inhibitory currents (autIPSCs and synIPSCs) evoked simultaneously in a PV cell and a PN, respectively, in response to PV cell stimulation. Individual responses (15 gray traces) were averaged (thick trace, blue for autIPSC and black for synIPSC). In the presence of the GABAAR antagonist, gabazine (10 μM), the two responses were blocked, but note the residual current in the PV cell reflecting the distortion due to the voltage step eliciting the action potential current (clipped). In order to cancel this stimulus waveform, current traces in gabazine were subtracted from control responses (orange: subtracted trace, average of 10 trials). (B) Population data obtained from PV-PN pairs with either single (autaptic or synaptic) or paired dual (autaptic and synaptic) connections (all data, left panel). Right panel illustrates pairs with both synaptic and autaptic connections from the same presynaptic PV cell (dual connections only). Note that the mean autaptic current from PV cell is systematically and significantly larger than the synaptic one (***p < 0.001). (C) Representative traces of autIPSCs and synIPSCs as in (A) but recorded in a PV-PV pair. (D) Population data obtained from PV-PV pairs with summary plots as described in (B). Note that, on average, autaptic currents are larger than synaptic currents (***p < 0.001, *p < 0.05). Individual numerical data for panels B, C, E, and F are provided in Supporting information, S1 Data. autIPSC, autaptic inhibitory postsynaptic current; GABAAR, GABAA receptor; PN, pyramidal neuron; PV, parvalbumin; synIPSC, synaptic inhibitory postsynaptic current.
Fig 2
Fig 2. Quantal parameters accounting for larger unitary autaptic than synaptic connections between PV cells and PNs.
(A) Top: representative autaptic and synaptic traces in response to PV-cell stimulation recorded from a PV-PN pair. IPSCs were elicited every 10 s, and each trace is the average of 10 sweeps. Bottom: time course of autIPSC (blue symbols) and synIPSC (black symbols) amplitude recorded simultaneously from the same PV cell and PN, respectively, at two extracellular Ca2+ concentrations (2.0 and 1.5 mM) and in the presence of 10 μM gabazine (at both [Ca2+]) to subtract the stimulus waveform. (B, C) Summary (B) and correlation plots (C) of synIPSCs and autIPSC amplitude obtained from all PV-PN pairs with dual connections used for BQA and measured at 2 mM [Ca2+]. Note that in all pairs (open circles), autaptic currents in PV cells are consistently bigger than their synaptic correlates in PN, as all points fall above the unity line (dashed line). (D–I) Quantal analysis of PV and PN responses to PV-cell stimulation recorded from the PV-PN pair shown in (A). Example responses of the PV cell (D) and PN (E) are shown alongside their respective amplitude distributions observed in the presence of 1.5 mM (left, low release probability) and 2 mM (right, high release probability) extracellular Ca2+. The results of BQA are represented as probability distributions for the quantal size (q) (F), maximal response (n) (G), release probability (p) (H), and number of release sites (r) (I). The dashed line is the median. Note the larger quantal size and maximum current of autaptic responses (n = 11; **p < 0.01). Individual numerical data for panels B, C, F, G, H, and I are provided in Supporting information, S2 Data. ampl., amplitude; autIPSC, autaptic inhibitory postsynaptic current; BQA, Bayesian quantal analysis; IPSC, inhibitory postsynaptic current; PN, pyramidal neuron; PV, parvalbumin; synIPSC, synaptic inhibitory postsynaptic current.
Fig 3
Fig 3. Extroverted and introverted PV cells rely on a different number of release sites.
(A, B) Top: representative responses from pairs of PV cells (PV1 and PV2) at two extracellular Ca2+ concentrations (2.0 and 1.5 mM) and in the presence of gabazine. Shown are cases of introverted (autIPSCs > synIPSCs [A]) and extroverted (autIPSCs < synIPSCs [B]) presynaptic PV cells. Each trace is the average of 10 sweeps. Bottom: time course of autaptic and synaptic IPSC amplitudes. Responses were elicited every 10 (A) or 5 s (B). (C) Summary plots of synIPSC and autIPSC amplitude from all pairs used for BQA (black box charts), measured at 2 mM [Ca2+], with color-coded introverted and extroverted PV cells (blue and orange, respectively). (D) autIPSCs plotted against synIPSCs. Data were fitted with a linear regression (black line) showing a good degree of correlation between paired autaptic and synaptic responses from a single presynaptic PV cell. Note also that individual pairs (open circles) are distributed on both sides of the relationship for equal autaptic and synaptic IPSCs (dashed line), thus indicating a split of PV cells into two types of connection patterns, introverted and extroverted (blue and orange, respectively). (E–H) Quantal analysis of PV responses. Introverted and extroverted cases are color coded as in (A). Results of BQA are represented as probability distributions for the quantal size (q) (E), release probability (p) (F), number of release sites (n) (G), and max response (r) (H). Note that the large size of an autaptic/synaptic response relies on a large number of release sites compared with their synaptic/autaptic correlate in all but one introverted and extroverted PV cell, respectively. Individual numerical data for panels C–H are provided in Supporting information, S3 Data. ampl., amplitude; autIPSC, autaptic inhibitory postsynaptic current; BQA, Bayesian quantal analysis; IPSC, inhibitory postsynaptic current; max, maximal; PV, parvalbumin; synIPSC, synaptic inhibitory postsynaptic current.
Fig 4
Fig 4. Autaptic neurotransmission accounts for a large fraction of the total inhibition onto single PV cells.
(A–C) Representative voltage-clamp traces (top) and time course (bottom) of autaptic responses recorded from two PV cells in the presence of 20 mM BAPTA (A, orange) or 1 mM EGTA (B, black) in the recording whole-cell pipette. IPSCs were elicited every 10 s, and their amplitudes illustrated on the time course plot (bottom). Note the decline of autIPSC amplitudes during BAPTA perfusion up to a complete block (A), as compared with the absence of rundown during long (1 h) EGTA perfusion (B). Gabazine completely blocked autIPSCs in both cases. (C) Summary of autaptic IPSC block by intracellular BAPTA in PV cells. IPSC amplitudes were normalized to the average value obtained 5 min after establishment of whole-cell configuration. Autaptic currents are blocked by BAPTA perfusion within 20 min (n = 5) but not in EGTA (n = 5). (D) Average trace of autIPSC recorded in a PV cell immediately after whole-cell establishment in the presence of BAPTA in the recording pipette. (E) Schematic of the experiment (left) and representative voltage-clamp traces of mIPSCs before and after puffing high-K+ ACSF (PUFF) at the beginning (6 min) and after intracellular blockade of autaptic release (20 min). Note the decrease of mIPSC frequency in high extracellular K+ after 20 min of intracellular perfusion of BAPTA. (F, G) Same as in (E) and (F) but in another PV cell recorded with a control EGTA (1 mM) intracellular solution. Note that the increase of mIPSCs induced by high K+ is constant over the same period. (H) mIPSCs frequency changes induced by high-K+ puff in the same PV cells as in (E) and (G), as estimated by the ratio before and after application of the high-K+ solution for each puff. The dashed line indicates baseline frequency (average of the first three points). Note that in BAPTA, the frequency declines progressively following the same time course as the autaptic transmission block, whereas it is stable in EGTA. (I) The percentage of decrease in mIPSC frequency calculated between the same time points as in (E) and (G)—i.e., before and after potential autaptic transmission block—is shown on the summary plot. In PV cells with evoked autaptic IPSC, the frequency strongly decreases in the presence of intracellular BAPTA (n = 7) but not EGTA (n = 7), whereas in PV cells with no autaptic transmission, the frequency did not change in both conditions (BAPTA, n = 6; EGTA, n = 4) (***p < 0.001). Individual numerical data for panels C and I are provided in Supporting information, S4 Data. ACSF, artificial cerebrospinal fluid; autIPSC, autaptic inhibitory postsynaptic current; BAPTA, 1,2-bis(o-aminophenoxy)ethane-N,N,N′,N′-tetraacetic acid; IPSC, inhibitory postsynaptic current; mIPSC, miniature IPSC; PN, pyramidal neuron; PV, parvalbumin; TTX, tetrodotoxin.
Fig 5
Fig 5. Optogenetically induced γ-oscillations in layer II/III efficiently propagate to layer V PV interneurons.
(A, B) Bright-field (A) and fluorescent (B) photomicrographs of an acute cortical slice of a mouse that was electroporated in utero at E15.5 with two plasmids expressing ChR2 and mRFP, respectively. Note the wide expression of mRFP in layer II/III in the barrel field (B). (C) Representative voltage-clamp traces of IPSCs (red) and EPSCs (green) recorded from a ChR2-negative PN of layer II/III in response to a ramp of blue light delivered with an LED coupled to the epifluorescence path of the microscope. IPSCs and EPSCs were isolated by holding the recorded neuron at the reversal potential of glutamate- and GABA-mediated responses, respectively. (D) Power spectra of the IPSCs (red) and EPSCs (green) of the cell of (C). Note the sharp peak at approximately 30 Hz in the γ-frequency range. (E) Scheme of the experimental configuration: a dual patch-clamp recording is established. A ChR2-negative PN in layer II/III is recorded in voltage clamp, and a PV cell in layer V is simultaneously recorded in current clamp: a ramp of blue light is then delivered on layer II/III PN cell bodies. (F) A ramp of blue light induces rhythmic IPSCs in the layer II/III PNs and subthreshold PSPs in the PV cell recorded at its resting potential in layer V. When the PV cell was slightly depolarized, optogenetic activation of ChR2-positive layer II/III PNs induced sustained firing of the PV cell in layer V. (G) The power spectra of IPSCs (red) and PSPs (gray) of the layer II/III PN and layer V PV cell shown in (F) coincide, indicating a good transmission of layer II/III γ-activity across the two cortical layers. ChR2, channelrhodopsin2; E, embryonic day; EPSC, excitatory postsynaptic current; IPSC, inhibitory postsynaptic current; LED, light-emitting diode; mRFP, monomeric red fluorescent protein; PN, pyramidal neuron; PSP, postsynaptic potential; PV, parvalbumin.
Fig 6
Fig 6. Different AHP durations and firing patterns of PV cells during γ-oscillations.
(A) Representative overlapped action potentials (aligned to their peaks) recorded from different PV cells showing different AHP waveform in control (EGTA: black, blue, and green traces) and in the presence of intracellular BAPTA (red trace). Inset: same traces at a larger voltage and time scale, normalized to the negative peak of the AHP. (B) Plots of AHP duration from PV cells recorded with control intracellular solution (EGTA, left) and BAPTA (right). Colors indicate the cells illustrated in (A). (C) Representative traces of oscillating IPSCs recorded from a layer II/III ChR2-negative PN (gray) and a PV cell with slow AHP (same as [A] and [B], black). Note that spikes occur regularly at precise times, relative to the oscillating IPSCs. (D) Distributions of ISIs (left) and phases (right) of the PV cell illustrated in (C) with a black trace. The dotted line indicates the interval corresponding to the median oscillation period. Note the sharp ISI distribution peaking at the oscillation period and the sharp phase distribution. (E, F) Same as (C) and (D) but for the PV cell represented with the blue trace in (A) and (B). Note the appearance of spike doublets (E), yielding multimodal ISI distribution (F, left) and broader phase histogram (right). (G, H) Same as (C–F) but for the cell represented with green trace in (A) and (B). Note the appearance of high-frequency bursts (G) yielding a large peak in the ISI distribution at faster intervals than the oscillation period. Furthermore, note that the phase histogram yielded an even broader profile. (I, J) Same as in (C–H) but for the PV cell intracellularly perfused with BAPTA, illustrated with a red trace in (A) and (B). Note the similar firing behavior of the EGTA cell characterized by the fast AHP and burst firing (green traces in [A, B, G, and H]). Individual numerical data for panel B are provided in Supporting information, S5 Data. AHP, after-hyperpolarization; BAPTA, 1,2-bis(o-aminophenoxy)ethane-N,N,N′,N′-tetraacetic acid; ChR2, channelrhodopsin2; IPSC, inhibitory postsynaptic current; ISI, interspike interval; PN, pyramidal neuron; PV, parvalbumin.
Fig 7
Fig 7. Autaptic neurotransmission facilitates the tuning of PV-cell firing to γ-oscillations.
(A, B) Population data and distributions of ISI values relative to γ-period (A) and ISI entropy (B) of PV cells recorded with intracellular EGTA (black) and BAPTA (red). The zero value in the y-axis of the left plot corresponds to the period of the γ-cycles. (C, D) Same as in (A) and (B) but for the peak (mode) of phase distributions as illustrated in Fig 6. **p < 0.01; ***p < 0.001. Individual numerical data for all panels are provided in Supporting information, S6 Data. BAPTA, 1,2-bis(o-aminophenoxy)ethane-N,N,N′,N′-tetraacetic acid; ISI, interspike interval; PV, parvalbumin.

References

    1. Allene C, Lourenco J, Bacci A The neuronal identity bias behind neocortical GABAergic plasticity. Trends Neurosci. 2015; 38: 524–534. 10.1016/j.tins.2015.07.008 - DOI - PubMed
    1. Harris KD, Shepherd GM. The neocortical circuit: themes and variations. Nat Neurosci. 2015; 18: 170–181. 10.1038/nn.3917 - DOI - PMC - PubMed
    1. Kepecs A, Fishell G. Interneuron cell types are fit to function. Nature. 2014; 505: 318–326. 10.1038/nature12983 - DOI - PMC - PubMed
    1. Tremblay R, Lee S, Rudy B. GABAergic Interneurons in the Neocortex: From Cellular Properties to Circuits. Neuron. 2016; 91: 260–292. 10.1016/j.neuron.2016.06.033 - DOI - PMC - PubMed
    1. Isaacson JS, Scanziani M. How inhibition shapes cortical activity. Neuron. 2011; 72: 231–243. 10.1016/j.neuron.2011.09.027 - DOI - PMC - PubMed

Publication types