. 2019 Sep 3;28(10):2567-2580.e6.
doi: 10.1016/j.celrep.2019.07.101.

Peptide/Receptor Co-evolution Explains the Lipolytic Function of the Neuropeptide TLQP-21

Affiliations

Peptide/Receptor Co-evolution Explains the Lipolytic Function of the Neuropeptide TLQP-21

Bhavani S Sahu et al. Cell Rep. .

Abstract

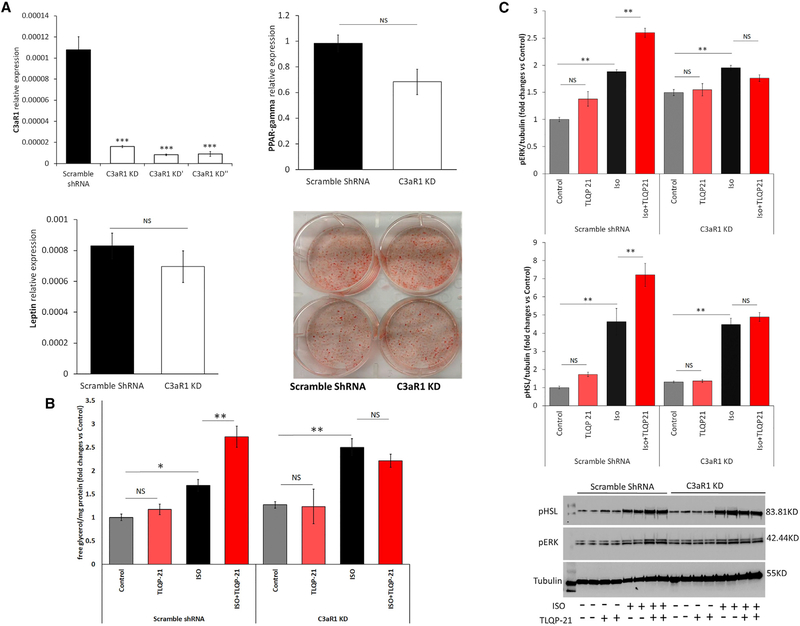
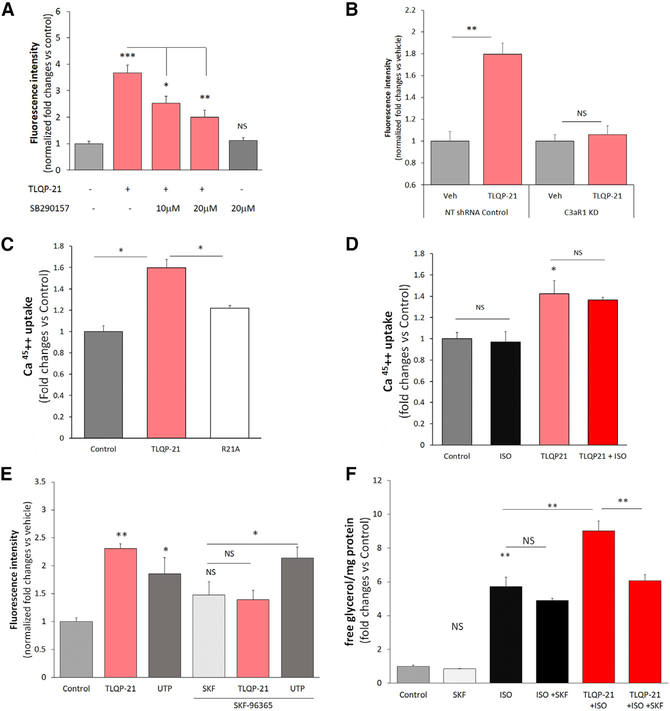
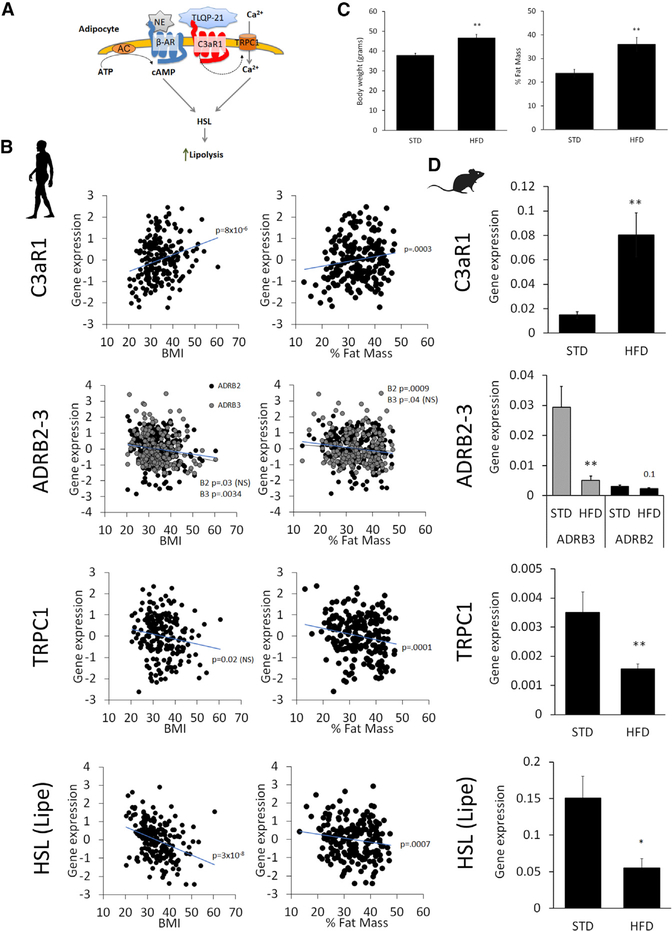
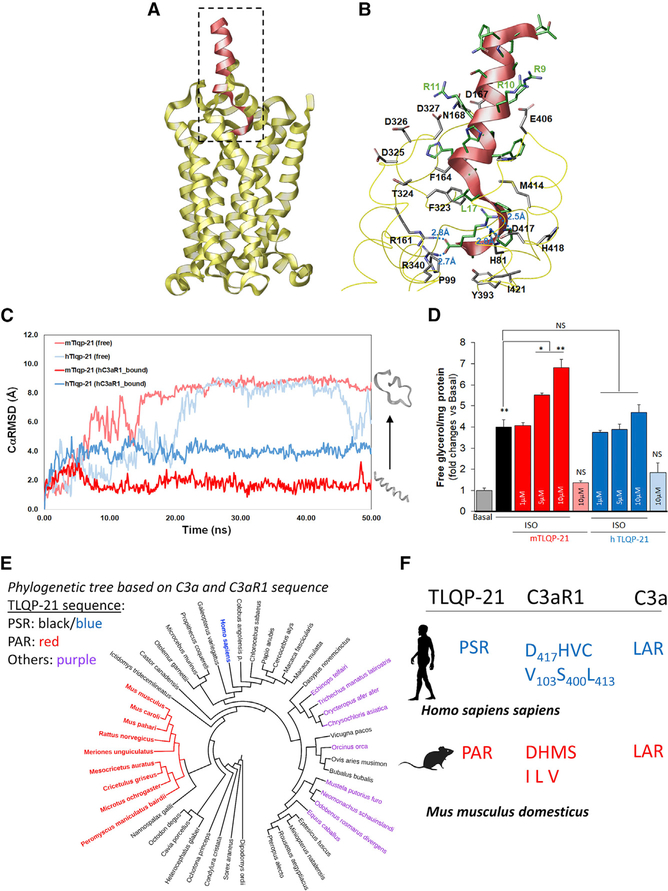
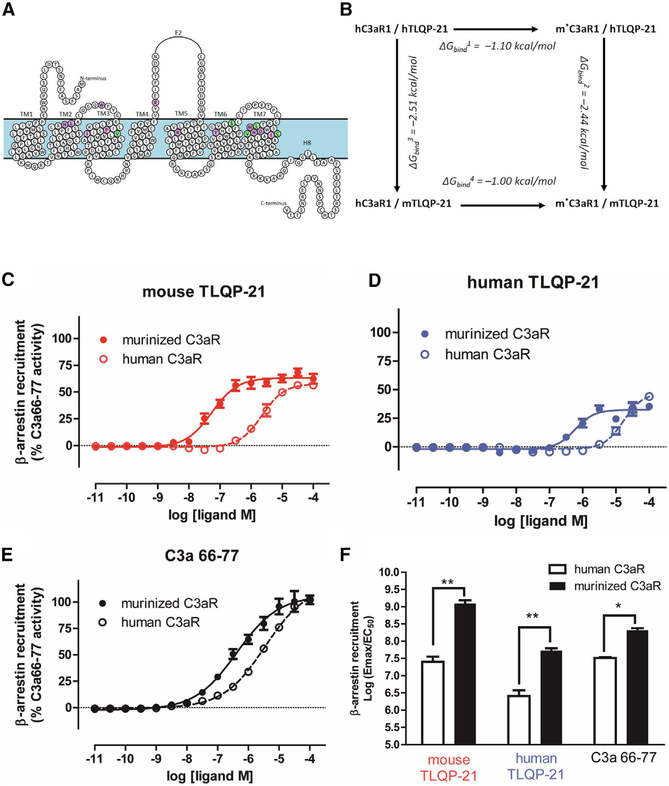
Structural and functional diversity of peptides and GPCR result from long evolutionary processes. Even small changes in sequence can alter receptor activation, affecting therapeutic efficacy. We conducted a structure-function relationship study on the neuropeptide TLQP-21, a promising target for obesity, and its complement 3a receptor (C3aR1). After having characterized the TLQP-21/C3aR1 lipolytic mechanism, a homology modeling and molecular dynamics simulation identified the TLQP-21 binding motif and C3aR1 binding site for the human (h) and mouse (m) molecules. mTLQP-21 showed enhanced binding affinity and potency for hC3aR1 compared with hTLQP-21. Consistently, mTLQP-21, but not hTLQP-21, potentiates lipolysis in human adipocytes. These findings led us to uncover five mutations in the C3aR1 binding pocket of the rodent Murinae subfamily that are causal for enhanced calculated affinity and measured potency of TLQP-21. Identifying functionally relevant peptide/receptor co-evolution mechanisms can facilitate the development of innovative pharmacotherapies for obesity and other diseases implicating GPCRs.

Keywords: VGF; drug discovery; granin peptides; innate immunity; lipolytic catecholamine resistance; obesity; transient receptor potential channel.


Conflict of interest statement

DECLARATION OF INTERESTS

The authors declare no competing interests.

Figures

Figure 1.
Figure 1.. C3aR1 Is Required for TLQP-21-Induced Lipolysis
(A) Generation and characterization of stable C3aR1 KD cell lines. Shown is qPCR analysis of C3aR1 mRNA in 3 independent shRNA lines in comparison with the scramble shRNA C3aR1 KD cell line expressing normal leptin and PPAR-γ levels and normal differentiation using oil red O staining. (B) Free glycerol release in C3aR1 KD and control cells. C3aR1 KD prevents TLQP-21 (100 nM) potentiation of isoproterenol (ISO, 50 nM)-induced lipolysis (cell line x treatment F(3,58) = 5.07, p < 0.005, N = 4–14). (C) Western blot analysis of pERK and pHSL in C3aR1 KD and control adipocytes incubated for 5 min with ISO (50 nM) or TLQP-21 (10 μM). C3aR1 KD prevented TLQP-21-induced phosphorylation of HSL (cell line × treatment F(3,24) = 4.7, p < 0.01, N = 4) and ERK (cell line × treatment F(3,24) = 26.1, p < 0.00001, N = 4). Tukey’s post hoc tests; NS, not significant; *p < 0.05, **p < 0.01, ***p < 0.001. Data are expressed as average and SEM. See also Figure S1.
Figure 2.
Figure 2.. TLQP-21 Mediates Extracellular Calcium Influx in 3T3-L1 Cells
(A) TLQP-21 (10 μM) increases [Ca2+]i (as measured by Fluo-4 fluorescence) during a 60-s incubation, and this effect is antagonized by the C3aR1 antagonist SB290157 (F(4,178) = 18.9, p < 0.00001, N = 25–60 cells from 2 independent experiments). (B) TLQP-21 (10 μM) increases [Ca2+]i in non-targeting (NT) shRNA controls but not C3aR1 KD cells (F(1,102) = 17.05, p < 0.00001, N = 20–29 cells from 2 independent experiments). Additional data can be found in Figure S2C. (C) TLQP-21 but not the R21A mutant increases uptake of Ca452+ from the medium (F(1,14) = 17.3, p < 0.001, N = 3–9 from 3 independent experiments. (D) ISO does not modify TLQP-21-induced Ca452+ uptake from the medium (F(1,8) = 17.3, p < 0.005, N = 3). (E) TLQP-21-induced potentiation of ISO-induced lipolysis is blocked by SKF-96365 (F(1,35) = 65.8, p < 0.0001; N = 5–6; ISO = 50 nM, TLQP-21 = 100 nM, SKF-96365 = 20 μM). (F) TLQP-21-induced increase in [Ca2+]i, measured by Fluo-4 fluorescence, is blocked by SKF-96365 (F(1,126) = 6.8, p < 0.0001; N = 8–50 cells from 2 different experiments; ISO = 50 nM, TLQP-21 = 10 μM, SKF-96365 = 20 μM, UTP =10 μM) (Figure S4 presents the dose response curves). Tukey’s post hoc tests; *p < 0.05, **p < 0.01, ***p < 0.001. Data are expressed as average and SEM. See also Figures S2 and S4 and Table S2.
Figure 3.
Figure 3.. Expression of Key Signaling Nodes in the TLQP-21/C3aR1-Mediated Pathway Is Conserved in Obese Mice and Humans
(A) Simplified model of key nodes in the TLQP-21/C3aR1 pathway. (B) Association of normalized gene expression in human adipose tissue biopsies with BMI (coefficient of determination (R2):C3aR1 = 9.4%, ADRB2 = 2.2%, ADRB3 = 4.2%, TRPC1 = 2.7%, LIPE = 14%) and percent fat mass (R2: C3aR1 = 6.4%, ADRB2 = 5.3%, ADRB3 = 2.0%, TRPC1 = 7.0%, LIPE = 5.5%). (C) Body weight and percent fat mass in mice fed a standard diet (STD) or high-fat diet (HFD) for 9 weeks starting at 9 weeks of age. (D) Difference in gene expression in subcutaneous WAT in mice fed a STD and HFD (N = 6). The silhouettes of Homo sapiens and Mus musculus are from http://www.phylopic.org. *p < 0.05, **p < 0.01. Data are expressed as average and SEM. See also Figure S3.
Figure 4.
Figure 4.. Homology Modeling and Biological Significance of TLQP-21/C3aR1 in Humans
(A) Homology modeling of hC3aR1 (yellow ribbon) with bound mTLQP-21 (red ribbon). (B) Binding site of hC3aR1 (labeled in black) with bound mTLQP-21 (labeled in green) after 50 ns simulation showed that TLQP-21 R21 forms multiple salt bridges with nearby R161, R340, and D417. mTLQP-21 containing the conserved RRRH motif was found to be surrounded by D167, D325, D326, D327, and E406, which could stabilize the α helix portion of TLQP-21 upon C3aR1 binding. (C) Molecular dynamics simulation of TLQP-21 (mouse [m], human [h]) in water and in complex with hC3aR1. The CαRMSDs are shown for unbound mTLQP-21 (salmon) and unbound hC3aR1 (light blue), hC3aR1 (gray and black), mTLQP-21-bound hC3aR1 (red), and hTLQP-21-bound hC3aR1 (blue). The simulation showed that mTLQP-21 binding to hC3aR1 retained its secondary helical structure compared with the partially unfolded hTLQP-21 bound to hC3aR1 and the completely unfolded m/hTLQP-21 in water. (D) mTLQP-21 potentiates ISO (10 nM)-induced lipolysis in human adipocytes (F(9,23) = 59.4, p < 0.0001). **p < 0.00. (E) Phylogenetic analysis of the combined C3a and C3aR1 sequence of the 87 species for which the three proteins (VGF, C3, and C3aR1) are present in NCBI. The color highlights the sequence at the C terminus of TLQP-21. Red, PAR; black (blue for humans), PSR; purple, other sequences (full details are presented in Table S3). The specific Murinae and Cricetinae subfamilies have the exclusive invariant PAR motif in TLQP-21. The phylogenetic tree was built using the Itol software (https://itol.embl.de). (F) Diagrams of critical motifs in humans and mice. The silhouettes of Homo sapiens and Mus musculus are from http://www.phylopic.org. Data are expressed as average and SEM. See also Figures S5–S7 and Table S3.
Figure 5.
Figure 5.. Murinizing the hC3aR1 by Site-Directed Mutagenesis Enhances TLQP-21 Binding Affinity and Potency
(A) Murinized hC3aR1 (m*C3aR1) from the homology model, highlighting conserved amino acids (purple circles) and amino acids affected by variants in rodents (V103I, S400L, L413V, V419M, and C420S, green circles). (B) Change in binding affinity (ΔGbind) of mouse and human TLQP-21 to hC3aR1 and m*C3aR1 was calculated based on the mutagenesis thermodynamic cycle. (C-E) β-Arrestin recruitment Tango assay transfected with either hC3aR1 or m*C3aR1 and incubated with a range of concentrations with either mTLQP-21 (hC3aR1, EC50 = 2.3 μM; m*C3aR1, EC50 = 0.055 μM) (C), hTLQP-21 (hC3aR1, EC50 = 16.9 μM; m*C3aR1, EC50 = 0.59 μM) (D), or C3a63–77 (hC3aR1, EC50 = 3.6 μM; m*C3aR1, EC50 = 0.4 μM) (E). Data represent mean and SE of triplicates from three independent experiments. (F) Quantitative comparison of β-arrestin recruitment functional activity as measured by log(Emax/EC50) from three independent experiments in (C)–(E) (ANOVA F(5,12) = 2.5, p = 0.032). *p < 0.05, **p < 0.01 comparing m*C3aR1 with hC3aR1. Emax, maximal effect at high drug concentrations when all the receptors are occupied by the drug. Data are expressed as average and SEM.

Similar articles

Cited by

References

    1. Ahmed MH, Kellogg GE, Selley DE, Safo MK, and Zhang Y (2014). Predicting the molecular interactions of CRIP1a-cannabinoid 1 receptor with integrated molecular modeling approaches. Bioorg. Med. Chem. Lett 24, 1158–1165. - PMC - PubMed
    1. Arner P (1999). Catecholamine-induced lipolysis in obesity. Int. J. Obes. Relat. Metab. Disord 23 (Suppl 1), 10–13. - PubMed
    1. Bandyopadhyay GK, Vu CU, Gentile S, Lee H, Biswas N, Chi NW, O’Connor DT, and Mahata SK (2012). Catestatin (chromogranin A(352–372)) and novel effects on mobilization of fat from adipose tissue through regulation of adrenergic and leptin signaling. J. Biol. Chem 287, 23141–23151. - PMC - PubMed
    1. Bartolomucci A, La Corte G, Possenti R, Locatelli V, Rigamonti AE, Torsello A, Bresciani E, Bulgarelli I, Rizzi R, Pavone F, et al. (2006). TLQP-21, a VGF-derived peptide, increases energy expenditure and prevents the early phase of diet-induced obesity. Proc. Natl. Acad. Sci. USA 103, 14584–14589. - PMC - PubMed
    1. Bartolomucci A, Possenti R, Mahata SK, Fischer-Colbrie R, Loh YP, and Salton SRJ (2011). The extended granin family: structure, function, and biomedical implications. Endocr. Rev 32, 755–797. - PMC - PubMed

MeSH terms