. 2019 Sep 3;28(10):2689-2703.e4.
doi: 10.1016/j.celrep.2019.07.103.

Nonreciprocal and Conditional Cooperativity Directs the Pioneer Activity of Pluripotency Transcription Factors

Affiliations

Nonreciprocal and Conditional Cooperativity Directs the Pioneer Activity of Pluripotency Transcription Factors

Sai Li et al. Cell Rep. .

Abstract

Cooperative binding of transcription factors (TFs) to chromatin orchestrates gene expression programming and cell fate specification. However, the biophysical principles of TF cooperativity remain incompletely understood. Here we use single-molecule fluorescence microscopy to study the partnership between Sox2 and Oct4, two core members of the pluripotency gene regulatory network. We find that the ability of Sox2 to target DNA inside nucleosomes is strongly affected by the translational and rotational positioning of its binding motif. In contrast, Oct4 can access nucleosomal sites with equal capacities. Furthermore, the Sox2-Oct4 pair displays nonreciprocal cooperativity, with Oct4 modulating interaction of Sox2 with the nucleosome but not vice versa. Such cooperativity is conditional upon the composite motif's residing at specific nucleosomal locations. These results reveal that pioneer factors possess distinct chromatin-binding properties and suggest that the same set of TFs can differentially regulate gene activities on the basis of their motif positions in the nucleosomal context.

Keywords: Oct4; Sox2; cooperative binding; gene regulatory network; nucleosome; pioneer activity; single-molecule fluorescence; transcription factor.


Figures

Figure 1.
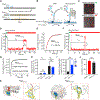
Figure 1.. Sox2 Displays Differential Binding Kinetics on DNA and Nucleosome Substrates
(A) Diagram of DNA and nucleosome substrates containing a Sox2 binding motif (blue) located near the end of a 601 NPS (orange). (B) Schematic of the single-molecule TF binding assay using a total internal reflection fluorescence microscope. (C) A representative field of view under green and red laser excitation showing immobilized substrates (marked by circles) and bound TFs (marked by arrowheads), respectively. (D) A representative fluorescence-time trajectory showing Cy5-labeled Sox2 binding to a Cy3-labeled DNAS-End substrate. A 532 nm laser was first turned on to locate the surface-immobilized substrates. Then a 640 nm laser was switched on to monitor Sox2 binding and dissociation. Sox2 was injected at the time point indicated by the dashed line. The waiting time before the first binding event occurred (toff) and the lifetime of binding events (ton) were measured. (E) Cumulative distribution (open circles) of the Sox2 residence time (ton) on DNAS-End and its fit (red curve) to a single-exponential function, y(t) = A × exp(−t/τ) + y0. (F) A representative fluorescence-time trajectory showing Cy5-Sox2 binding to a Cy3-labeled NucS-End substrate. Two photobleaching steps under green laser excitation confirm the existence of two Cy3-labeled H2B, suggesting an intact nucleosome. (G) Cumulative distribution (open circles) of the Sox2 residence time (ton) on NucS-End and its fit (solid curve) to a double-exponential function, y(t) = A1 × exp(−t/τ1) + A2 × exp(−t/τ2) + yo. The dashed curve displays a poor fit to a single-exponential function. (H) Time constants for the two exponential components (τ1 and τ2) from the double-exponential fit shown in (G) (black bars for NucS-End, blue bars for NucS-End+7). (I) Relative weights of the fast (A1) and slow (A2) exponential components for NucS-End (black) and NucS-End+7 (blue). (J) Average waiting time (toff) before Sox2 binding to DNAS-End or NucS-End. (K) The Sox2hmg:DNA structure (PDB: 1GT0; yellow) superimposed on the 601 nucleosome structure (PDB: 3LZ0; gray) aligned by the DNA motif (blue), which spans nucleotides 1–7 for NucS-End (left) or nucleotides 8–14 for NucS-End+7 (right). Steric clash between Sox2 and the nucleosome is highlighted in red. Data are represented as mean ± SD. See also Figures S1, S2, and S3.
Figure 2.
Figure 2.. The Pioneer Activity of Sox2 Is Regulated by the Rotational Phasing of Its Binding Motif
(A) Diagram of nucleosome substrates harboring a Sox2 binding motif around the nucleosome dyad axis. In the NucRev-S-Dyad construct, the Sox2 motif is placed in the opposite direction to those in the other constructs. (B) Time constants for the fast and slow exponential components (τ1 and τ2) that describe the residence time of Sox2 on different nucleosome substrates. (C) Fraction of long-lived, specific Sox2 binding events (A2) for the different nucleosome substrates. (D) Structural superposition illustrating the putative binding configuration of Sox2 on the NucS-Dyad substrate. The Sox2 HMG domain and the DNA motif are shown in yellow and blue, respectively. (E) Zoomed-in view of the nucleosome dyad region displaying the orientation of the DNA minor groove. The midpoints of the Sox2 binding motif placed at different positions (Dyad-2, Dyad, Rev-Dyad, Dyad+3, and Dyad+6) are indicated in blue. Data are represented as mean ± SD. See also Figures S2, S3, and S4.
Figure 3.
Figure 3.. The Nucleosome-Targeting Activity of Oct4 Is Insensitive to Its Motif Position
(A) Diagram of DNA and nucleosome substrates containing an Oct4 binding motif located near the end or dyad of the 601 NPS. (B) Representative single-molecule fluorescence trajectories showing Cy5-labeled Oct4 binding to nucleosome substrates labeled with Cy3. (C) Cumulative distributions (open circles) of the Oct4 residence time on different DNA and nucleosome substrates and their respective single-exponential fits (curves). (D) Average Oct4 residence times (ton) on different substrates. (E) Average waiting time (toff) before Oct4 binding to a DNA or nucleosome substrate, which reports on the corresponding association rate. (F) Average number of surface-immobilized and fluorescently labeled nucleosomes per field of view before (white bar) and 10 min after (blue bar) the addition of 2 nM Sox2. (G) Surface density of fluorescent nucleosomes before (white bar) and after (orange bar) the addition of 2 nM Oct4. (H) Surface density of fluorescent nucleosomes before (white bar) and after (yellow bar) the addition of both Sox2 and Oct4. The results in (F)-(H) suggest that Sox2 and Oct4 binding does not cause significant nucleosome disassembly. Data are represented as mean ± SD. See also Figures S1, S2, and S4.
Figure 4.
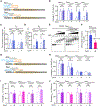
Figure 4.. Oct4 and Sox2 Exhibit Nonreciprocal Cooperativity
(A) Diagram of nucleosome substrates containing an end-positioned Sox2:Oct4 composite motif, either with no gap (NucSO-End) or with a 3 bp gap between the Sox2 and Oct4 binding motifs (Nucso+3-End). (B) Average residence times (ton) of Sox2 on different DNA and nucleosome substrates shown in (A) in the absence or presence of Oct4. (C) Time constants for the long-lived, specific Sox2 binding mode (τ2) on NucSO-End and NucSO+3-End in the absence or presence of Oct4. (D) Relative populations of specific Sox2 binding events (A2) on NucSO-End and NucSO+3-End in the absence or presence of Oct4. (E) A representative EMSA gel showing the formation of Sox2-NucSO-End complexes, or the formation of Sox2-NucSO-End-Oct4 ternary complexes when Oct4 is present, at different Sox2 concentrations. Cy5-labeled Sox2 and unlabeled Sox2 exhibited virtually identical binding patterns (not shown). (F) Dissociation constant (KD) for the Sox2-NucSO-End interaction in the absence or presence of Oct4 determined from the EMSA results. n = 3 experimental replicates. (G) Diagram of nucleosome substrates containing an end-positioned composite motif in which Sox2 and Oct4 sites are oriented in opposite directions, either with no gap (NucRev-SO-End) or with a 3 bp gap (NucRev-SO+3-End). (H) Average residence times (ton) of Sox2 on different DNA and nucleosome substrates shown in (G) in the absence or presence of Oct4. (I) Average residence times (ton) of Oct4 on different DNA and nucleosome substrates containing an end-positioned composite motif in the absence or presence of Sox2. (J) Same as (I), except that the substrates contain a composite motif in which Sox2 and Oct4 sites are oriented in opposite directions. Data are represented as mean ± SD. See also Figures S5 and S6.
Figure 5.
Figure 5.. Hierarchical Engagement of Oct4 and Sox2 in Nucleosome Targeting
(A) Schematic of the three-color TIRF assay that simultaneously monitors Sox2 and Oct4 binding. Histone H2B, Oct4, and Sox2 are labeled with Cy3, Cy5, and AlexaFluor488, respectively. (B) Representative fluorescence-time trajectories showing overlapping Sox2 and Oct4 binding events on NucSO-End, which reveal the order of TF engagement. (C) Pie chart showing the distribution of different scenarios regarding the order of Sox2/Oct4 binding to nucleosome substrates. n = 134 (number of overlapping Sox2 and Oct4 binding events analyzed). (D) Histogram of the lag time between Oct4 and Sox2 binding. The positive part of the histogram (red) corresponds to Oct4-first events and is fit to a single-exponential function (black curve). (E) Cumulative distributions of the Sox2 residence time for the binding events that overlapped with an Oct4 binding event (filled circles) and for those that did not overlap (open circles) (p = 3.3 × 10⁻¹¹, two-sided Kolmogorov-Smirnov test). See also Figures S5 and S6.
Figure 6.
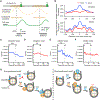
Figure 6.. Oct4 Negatively Influences Sox2 Binding to the Nucleosome Dyad
(A) Diagram of nucleosome substrates containing a dyad-positioned Sox2:Oct4 composite motif, either with no gap (NucSO-Dyad) or with a 3 bp gap between the Sox2 and Oct4 motifs (NucSO+3-Dyad). (B) Average residence times (ton) of Sox2 on different DNA and nucleosome substrates shown in (A) in the absence or presence of Oct4. (C) Time constants for the specific Sox2 binding mode (τ2) on NucSO-Dyad and NucSO+3-Dyad in the absence or presence of Oct4. (D) Relative populations of specific Sox2 binding events (A2) in the absence or presence of Oct4. (E) A representative EMSA gel showing the formation of Sox2-NucSO-Dyad complexes at different Sox2 concentrations in the absence or presence of Oct4. (F) Dissociation constant (KD) for the Sox2-NucSO-Dyad interaction in the absence or presence of Oct4 determined from the EMSA results. n = 3 experimental replicates. (G) Average residence times (ton) of Oct4 on different DNA and nucleosome substrates containing a dyad-positioned composite motif in the absence or presence of Sox2. Data are represented as mean ± SD. See also Figures S5 and S6.
Figure 7.
Figure 7.. Genome-wide Analysis of the Positional Preference of Sox2 and Oct4 Binding Relative to Nucleosome Positioning
(A) Diagram illustrating nucleosome occupancy and TF binding sites in the genome. Nucleosome positions were derived from MNase-seq data. TF binding sites were identified by searching for a cognate sequence motif near a ChIP-seq peak for the given TF. (B) Nucleosome occupancy scores within a 1,000 bp window surrounding a Sox2 (blue) or Oct4 (red) binding site averaged over all sites identified in mouse epiblast stem cells (top) and embryonic stem cells (bottom). Position 0 corresponds to the center of an identified TF binding site. (C) Distribution of the distance between the center of a Sox2 binding site and the nearest nucleosome dyad in mEpiSCs (n = 14,101; n denotes the number of binding sites analyzed). Position 0 (dashed line) corresponds to the dyad; the dotted line approximates the edges of the nucleosome. Displayed significance is from t test conducted between a 13 bp window centered at the dyad and a 13 bp window inside the nucleosome edge (p = 3.6 × 10⁻⁷). (D) Same as (C), except for analyzing the distribution of Oct4 binding sites with respect to the nearest nucleosome (n = 21,050, p = 0.47). (E) Same as (C), except for analyzing the distribution of Sox2 binding sites in mESCs (n = 1,438, p = 0.0027). (F) Same as (C), except for analyzing the distribution of Oct4 binding sites in mESCs (n = 2,437, p = 0.073). (G) Schematic model illustrating the differential pioneer activity of Sox2 and Oct4, as well as their position-dependent cooperativity in the nucleosome context. The short arrows indicate the relative orientation of Sox2 and Oct4 binding motifs. See also Figure S7.

Similar articles

Cited by

References

    1. Adams CC, and Workman JL (1995). Binding of disparate transcriptional activators to nucleosomal DNA is inherently cooperative. Mol. Cell. Biol 15, 1405–1421. - PMC - PubMed
    1. Ambrosetti DC, Basilico C, and Dailey L (1997). Synergistic activation of the fibroblast growth factor 4 enhancer by Sox2 and Oct-3 depends on protein-protein interactions facilitated by a specific spatial arrangement of factor binding sites. Mol. Cell. Biol 17, 6321–6329. - PMC - PubMed
    1. Biddle JW, Nguyen M, and Gunawardena J (2019). Negative reciprocity, not ordered assembly, underlies the interaction of Sox2 and Oct4 on DNA. eLife 8, e41017. - PMC - PubMed
    1. Boyer LA, Lee TI, Cole MF, Johnstone SE, Levine SS, Zucker JP, Guenther MG, Kumar RM, Murray HL, Jenner RG, et al. (2005). Core transcriptional regulatory circuitry in human embryonic stem cells. Cell 122, 947–956. - PMC - PubMed
    1. Chang YK, Srivastava Y, Hu C, Joyce A, Yang X, Zuo Z, Havranek JJ, Stormo GD, and Jauch R (2017). Quantitative profiling of selective Sox/ POU pairing on hundreds of sequences in parallel by Coop-seq. Nucleic Acids Res. 45, 832–845. - PMC - PubMed

Publication types