. 2019 Sep 3;28(10):2715-2727.e5.
doi: 10.1016/j.celrep.2019.07.096.

Ecdysone-Induced 3D Chromatin Reorganization Involves Active Enhancers Bound by Pipsqueak and Polycomb

Affiliations

Ecdysone-Induced 3D Chromatin Reorganization Involves Active Enhancers Bound by Pipsqueak and Polycomb

Irene Gutierrez-Perez et al. Cell Rep. .

Abstract

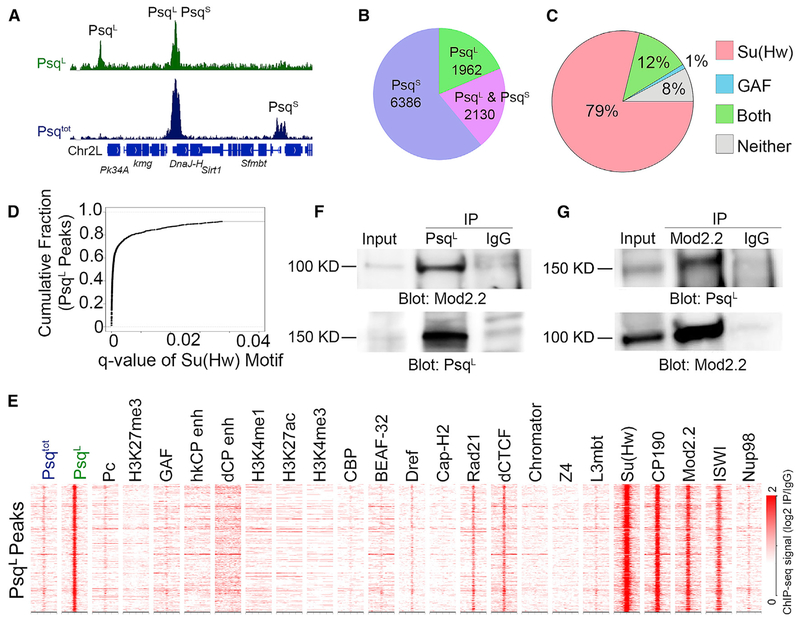
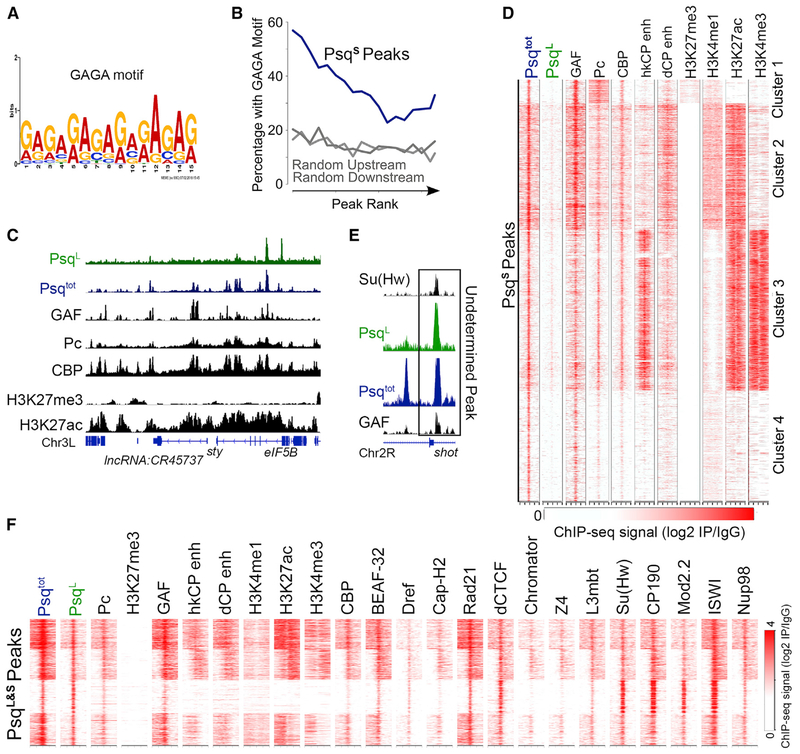
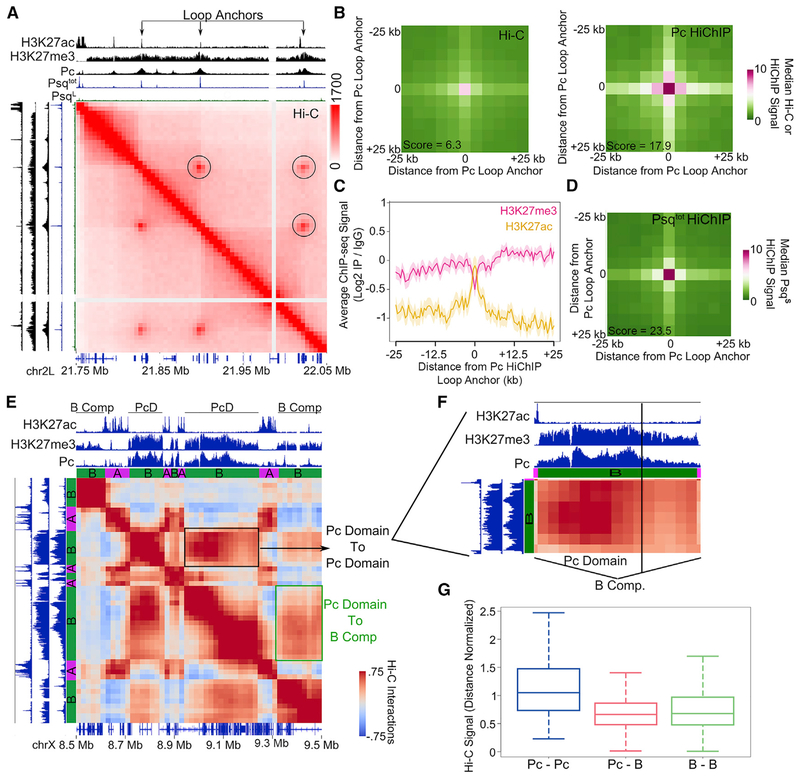
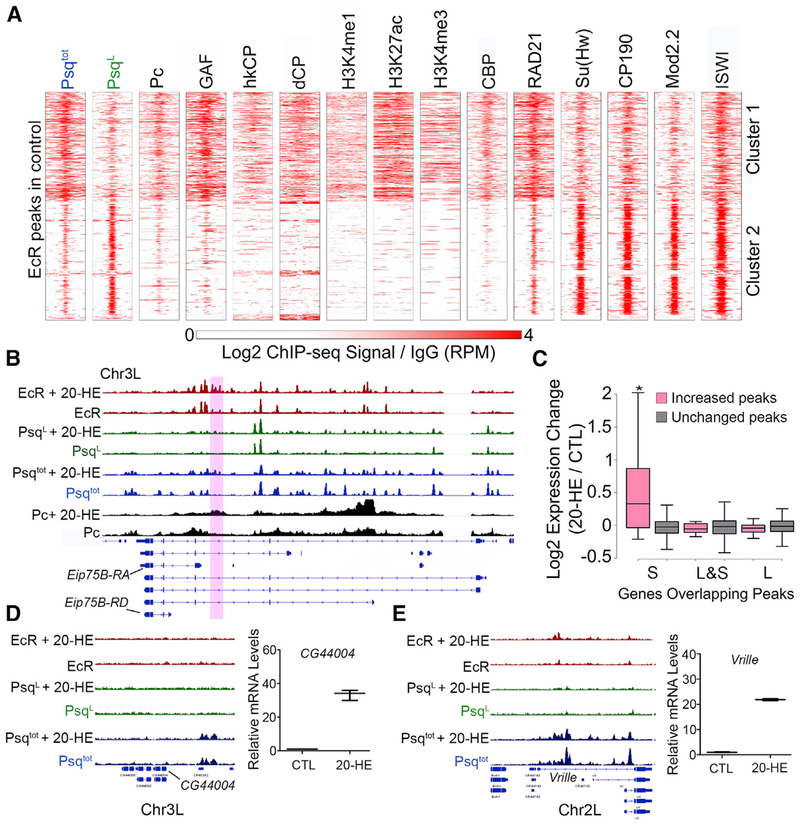
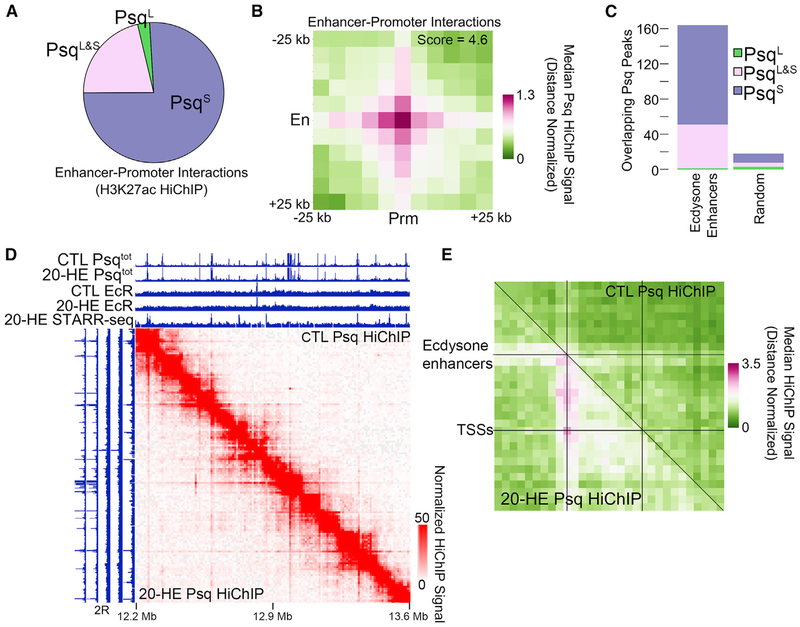
Evidence suggests that Polycomb (Pc) is present at chromatin loop anchors in Drosophila. Pc is recruited to DNA through interactions with the GAGA binding factors GAF and Pipsqueak (Psq). Using HiChIP in Drosophila cells, we find that the psq gene, which has diverse roles in development and tumorigenesis, encodes distinct isoforms with unanticipated roles in genome 3D architecture. The BR-C, ttk, and bab domain (BTB)-containing Psq isoform (PsqL) colocalizes genome-wide with known architectural proteins. Conversely, Psq lacking the BTB domain (PsqS) is consistently found at Pc loop anchors and at active enhancers, including those that respond to the hormone ecdysone. After stimulation by this hormone, chromatin 3D organization is altered to connect promoters and ecdysone-responsive enhancers bound by PsqS. Our findings link Psq variants lacking the BTB domain to Pc-bound active enhancers, thus shedding light into their molecular function in chromatin changes underlying the response to hormone stimulus.

Keywords: CTCF; GAF; HiChIP; POZ/BTB; Pipsqueak; architectural protein; chromatin; epigenetics; hormone; transcription.


Conflict of interest statement

DECLARATION OF INTERESTS

The authors declare no competing interests.

Figures

Figure 1.
Figure 1.. PsqL Colocalizes with Su(Hw) and Its Associated BTB Domain Proteins in Kc167 Cells
(A) Integrative genomics viewer (IGV) tracks showing peaks of PsqL(green) and PsqS (blue). Peaks in green alone detected by the PsqL antibody are classified as PsqL binding sites, while peaks with a signal in blue alone detected by the Psqtot antibodies, but not the PsqL antibodies, are classified as PsqS. Peaks with signals in both ChIP-seq datasets could be either PsqL alone or co-occupied by PsqL and PsqS. (B) Pie chart showing the number of peaks occupied by each Psq isoform. (C) Overlap between PsqL peaks and Su(Hw), GAGA, both, or neither motif. (D) Cumulative fraction of PsqL peaks that overlap Su(Hw) motif locations called at varying q values by individual motif occurrences (fimo). (E) Heatmap showing ChIP-seq signal for various proteins or histone modifications surrounding PsqS binding sites ± 2 kb. n = 1,962. The STARR-seq signal is from S2 cells, and the ChIP-seq signal is from Kc167 cells and is shown relative to immunoglobulin G (IgG). (F) Western analysis of protein extracts from Kc167 cells containing input (left), IP of PsqL (middle), or IgG (right) using antibodies to Mod(mdg4)2.2 (top) or PsqL (bottom). (G) Western analysis of protein extracts from Kc167 cells containing input (left), IP of Mod(mdg4)2.2 (middle), or IgG (right) using antibodies against PsqL (top) or Mod(mdg4)2.2 (bottom). See also Figure S1.
Figure 2.
Figure 2.. The PsqS Isoform Colocalizes with Pc and GAF at Active Enhancers in Kc167 Cells
(A) Binding motif detected by multiple expectation maximization (EM) for motif elicitation designed to analyze ChIP-seq (MEME-ChIP) at PsqS peaks. (B) Percentage of PsqS peaks that overlap GAGA motifs ranked by ChIP-seq signal intensity (blue). Regions upstream and downstream of PsqS summits were tested for comparison (gray). (C) Example region showing PsqS binding sites as peaks with a Psqtot signal (blue), without a PsqL signal (green), and colocalizing with GAF, Pc, CBP, and H3K27ac (black). (D) Heatmap showing ChIP-seq signal for various proteins or histone modifications surrounding PsqS binding sites ± 2 kb. n = 6,386. The STARR-seq signal is from S2 cells, and the ChIP-seq signal is from Kc167 cells and is shown relative to IgG. (E) IGV track showing an example locus with ChIP-seq signal for PsqL and Psqtot overlapping with both Su(Hw) and GAF. (F) ChIP-seq signal for various proteins and histone modifications in a 2-kb region surrounding sites enriched in PsqL and Psqtot. n = 2,130. The STARR-seq signal is from S2 cells, and the ChIP-seq signal is from Kc167 cells and is shown relative to IgG. See also Figure S2.
Figure 3.
Figure 3.. Pc Loop Anchors Contain PsqS and Form Interactions Distinct from Those Involving Pc-Repressive Domains
(A) Example locus showing Hi-C in Kc167 cells signals for loops associated with Pc (circles). Tracks showing ChIP-seq for H3K27ac, H3K27me3, Psqtot, and Pc are shown above and to the left. Genes are shown at the bottom. (B) 2D metaplots of Hi-C (left) and Pc HiChIP (right) data centered on significant interactions called by Pc HiChIP. n = 206. The score indicates the enrichment of the center pixel compared with the top left corner. (C) Average ChIP-seq profile for H3K27ac (orange) and H3K27me3 (pink) surrounding Pc loop anchors identified by Pc HiChIP. n = 206. The shaded area indicates SD. (D) 2D metaplot of Psqtot HiChIP data centered on significant interactions called by Pc HiChIP. n = 206. The score indicates the enrichment of the center pixel compared with the top left corner. (E) Hi-C interaction plot showing an example locus in which two distinct Pc domains interact more strongly with each other (black box) than with other inactive B compartmental domains (green box). Tracks showing H3K27ac, H3K27me3, Pc, and A or B compartmental domains are shown above and to the left. (F) Zoomed-in area of the Pc domain shown in (E). (G) Boxplot showing the distribution of average interaction signals occurring between Pc domains (Pc-Pc, n = 102), between Pc domains and other inactive B compartmental domains (Pc-B, n = 1,365), or between inactive B compartmental domains (B-B, n = 17,208). p < 0.001, Wilcoxon test for Pc-Pc versus Pc-B. See also Figure S3.
Figure 4.
Figure 4.. Psq Colocalizes with EcR at Ecdysone-Induced Genes
(A) ChIP-seq signal in Kc167 cells for various proteins and histone modifications in a 2-kb region surrounding EcR sites. n = 845. The ChIP-seq signal is shown relative to IgG. (B) IGV tracks showing the ChIP-seq signal before and after 20-HE treatment for EcR (red), PsqL (green), Psqtot (blue), and Pc (black). The purple box highlights a region where binding is altered after ecdysone treatment. (C) Fold expression changes for genes with overlapping Psq peaks that increase (pink) or are unchanged (gray) after ecdysone treatment. *p < 0.01, Wilcoxon test. (D) Left: IGV tracks showing the ChIP-seq signal before and after 20-HE treatment for EcR (red), PsqL (green), and Psqtot (blue). Right: expression change of CG44004 after 20-HE treatment relative to the control (CTL) as measured by qPCR. (E) Left: IGV tracks showing ChIP-seq signal before and after 20-HE treatment for EcR (red), PsqL (green), and Psqtot (blue). Right: expression change of Vrille after 20-HE treatment relative to the control (CTL) as measured by qPCR. See also Figure S4.
Figure 5.
Figure 5.. PsqS-Bound Enhancer-Promoter Interactions Are Altered during the Ecdysone Response
(A) Pie graph showing the relative binding of PsqS (purple), PsqL (green), and PsqL&S (pink) at enhancer-promoter interaction anchors determined by H3K27ac HiChIP in Kc167 cells. n = 94,483 interactions. (B) 2D metaplot of Psq HiChIP signal around enhancer-promoter interactions determined by H3K27ac HiChIP found in (A). En, enhancers; Prm, promoters. (C) Number of STARR-seq ecdysone enhancers (left) compared with random loci (right) that overlap PsqS (purple), PsqL (green), and PsqL&S (pink). (D) Psq HiChIP data in a 1-Mb region of chromosome 2R showing changes in the interaction profile after ecdysone treatment (bottom left) compared with the control (top right). ChIP-seq tracks showing PsqS and EcR before (CTL) and after 20-HE treatment. The STARR-seq signal after ecdysone treatment is also shown. (E) 2D metaplot of Psq HiChIP data before (top right) and after (bottom left) ecdysone treatment. Regions between STARR-seq ecdysone enhancers and nearby differentially expressed genes were scaled to equally sized bins. n = 86. See also Figure S5.

Similar articles

Cited by

References

    1. Aranda S, Mas G, and Di Croce L (2015). Regulation of gene transcription by Polycomb proteins. Sci. Adv 1, e1500737. - PMC - PubMed
    1. Bardwell VJ, Treisman R (1994). The POZ domain: a conserved protein-protein interaction motif. Genes Dev. 8, 1664–1677. - PubMed
    1. Bushey AM, Ramos E, and Corces VG (2009). Three subclasses of a Drosophila insulator show distinct and cell type-specific genomic distributions. Genes Dev. 23, 1338–1350. - PMC - PubMed
    1. Cairns J, Freire-Pritchett P, Wingett SW, Várnai C, Dimond A, Plagnol V, Zerbino D, Schoenfelder S, Javierre BM, Osborne C, et al. (2016). CHiCAGO: robust detection of DNA looping interactions in Capture Hi-C data. Genome Biol. 17, 127. - PMC - PubMed
    1. Chaharbakhshi E, and Jemc JC (2016). Broad-complex, tramtrack, and bric-à-brac (BTB) proteins: Critical regulators of development. Genesis 54, 505–518. - PubMed

Publication types

MeSH terms