. 2019 Sep 3;11(9):2076.
doi: 10.3390/nu11092076.

Establishment of the Variation of Vitamin K Status According to Vkorc1 Point Mutations Using Rat Models

Affiliations

Establishment of the Variation of Vitamin K Status According to Vkorc1 Point Mutations Using Rat Models

Jean Valéry Debaux et al. Nutrients. .

Abstract

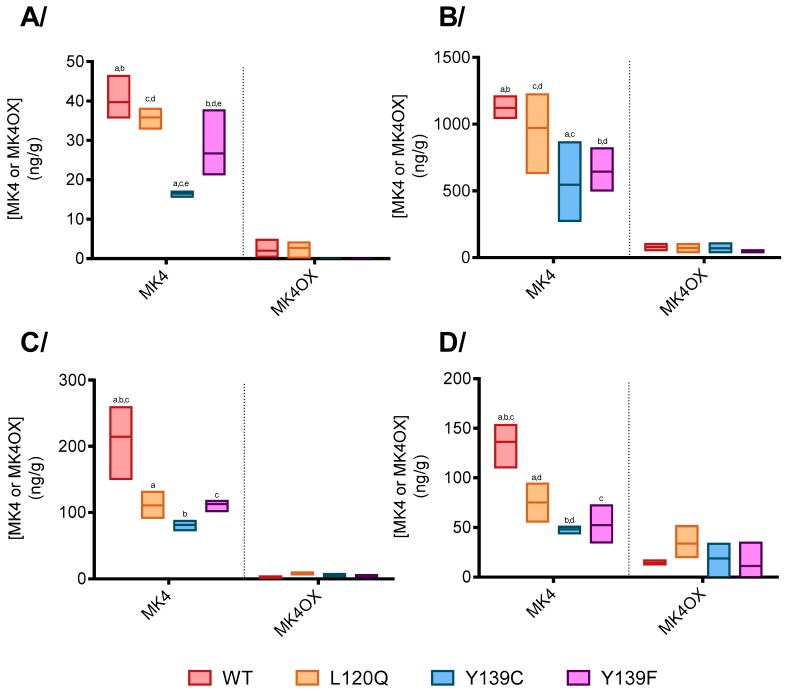
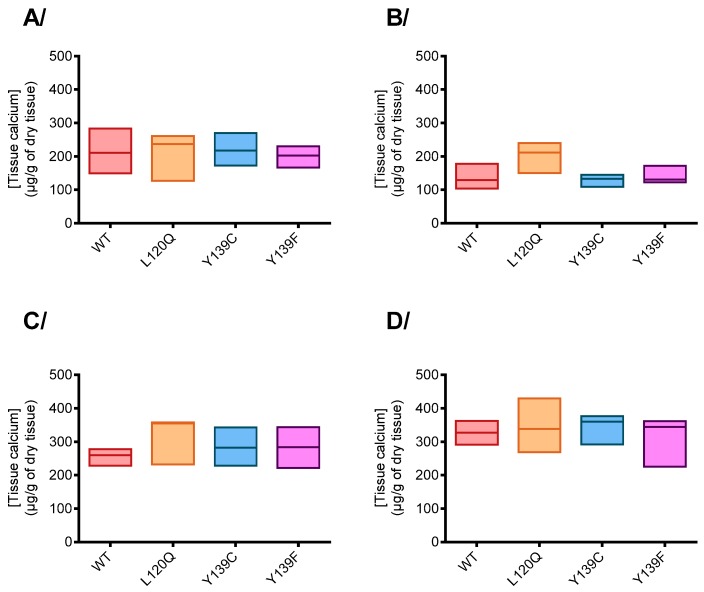
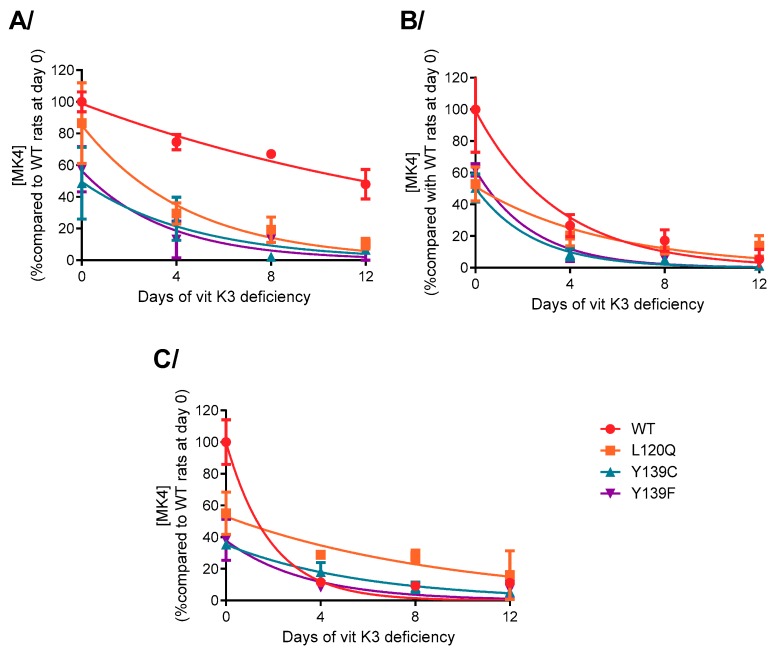
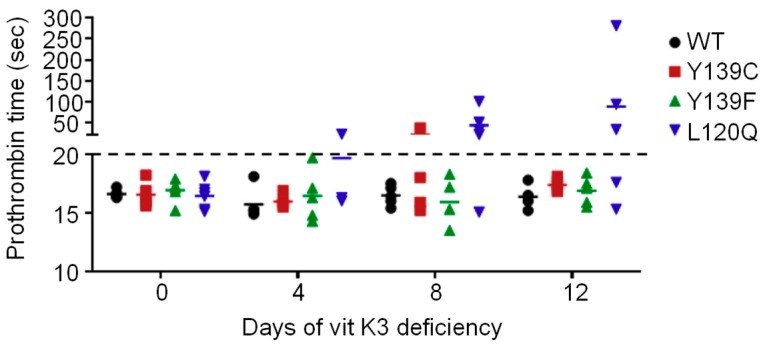
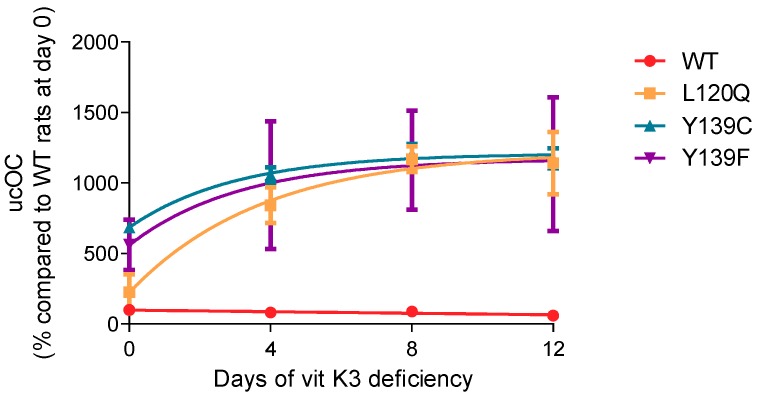
Vitamin K is crucial for many physiological processes such as coagulation, energy metabolism, and arterial calcification prevention due to its involvement in the activation of several vitamin K-dependent proteins. During this activation, vitamin K is converted into vitamin K epoxide, which must be re-reduced by the VKORC1 enzyme. Various VKORC1 mutations have been described in humans. While these mutations have been widely associated with anticoagulant resistance, their association with a modification of vitamin K status due to a modification of the enzyme efficiency has never been considered. Using animal models with different Vkorc1 mutations receiving a standard diet or a menadione-deficient diet, we investigated this association by measuring different markers of the vitamin K status. Each mutation dramatically affected vitamin K recycling efficiency. This decrease in recycling was associated with a significant alteration of the vitamin K status, even when animals were fed a menadione-enriched diet suggesting a loss of vitamin K from the cycle due to the presence of the Vkorc1 mutation. This change in vitamin K status resulted in clinical modifications in mutated rats only when animals receive a limited vitamin K intake totally consistent with the capacity of each strain to recycle vitamin K.

Keywords: mutation; osteocalcin; vitamin K epoxide reductase; vitamin K status.


Conflict of interest statement

The authors declare no conflict of interest.

Figures

Figure 1
Figure 1
Vitamins K concentrations in (A)/liver, (B)/testis, (C)/kidney, and (D)/lung of rats homozygous for WT-, L120Q-, Y139C-, or Y139F-Vkorc1 fed with a standard rodent diet. The box extends from the 25th to 75th percentiles and the line corresponds to the mean. Statistical analyses were performed using a Tukey’s multiple comparisons test. p < 0.05 was the accepted level of significance. a,b,c,d,e, statistical difference between 2 groups.
Figure 2
Figure 2
ucOC concentrations in the plasma of rats homozygous for WT-, L120Q-, Y139C-, or Y139F-Vkorc1 fed with a standard rodent diet. The box extends from the 25th to 75th percentiles and the line corresponds to the mean. Statistical analyses were performed using a Dunn’s multiple comparisons test. p < 0.05 was the accepted level of significance. a,b, statistical difference between two groups.
Figure 3
Figure 3
Tissue calcium content in (A) testis, (B) kidney, (C) lung, and (D) heart of rats homozygous for WT-, L120Q, Y139C or Y139F-VKORC1 fed with a standard rodent diet. The box extends from the 25th to 75th percentiles and the line corresponds to the mean. Statistical analyses were performed using a Dunn’s multiple comparisons test.
Figure 4
Figure 4
Vitamins K concentrations evolution in (A) testis, (B) kidney, and (C) lung of rats homozygous for WT-, L120Q-, Y139C-, or Y139F-Vkorc1 receiving a specific diet -K3 for 12 days. Results are expressed as the mean of the percentage of four animals compared to wild type rats at day 0 ± standard deviation.
Figure 5
Figure 5
Prothrombin time evolution of rats homozygous for WT-, L120Q-, Y139C-, or Y139F-Vkorc1 receiving a specific diet -K3 for 12 days. Results are the mean of 3 or 5 animals, with each point representing each individual.
Figure 6
Figure 6
ucOC concentrations evolution in plasma rats homozygous for WT-, L120Q-, Y139C-, or Y139F-Vkorc1 receiving a specific diet -K3 for 12 days. Results are expressed as the mean of the percentage of 4 animals compared to wild type rats at day 0 ± standard deviation.

References

    1. Shearer M.J., Newman P. Metabolism and cell biology of vitamin K. Thromb. Haemost. 2008;100:530–547. - PubMed
    1. Stafford D.W. The vitamin K cycle. J. Thromb. Haemost. 2005;3:1873–1878. doi: 10.1111/j.1538-7836.2005.01419.x. - DOI - PubMed
    1. Ma H., Zhang B.L., Liu B.Y., Shi S., Gao D.Y., Zhang T.C., Shi H.J., Li Z., Shum W.W. Vitamin K2-Dependent GGCX and MGP Are Required for Homeostatic Calcium Regulation of Sperm Maturation. iScience. 2019;14:210–225. doi: 10.1016/j.isci.2019.03.030. - DOI - PMC - PubMed
    1. Van Summeren M.J., Braam L.A., Lilien M.R., Schurgers L.J., Kuis W., Vermeer C. The effect of menaquinone-7 (vitamin K2) supplementation on osteocalcin carboxylation in healthy prepubertal children. Br. J. Nutr. 2009;102:1171–1178. doi: 10.1017/S0007114509382100. - DOI - PubMed
    1. Willems B.A., Vermeer C., Reutelingsperger C.P., Schurgers L.J. The realm of vitamin K dependent proteins: Shifting from coagulation toward calcification. Mol. Nutr. Food Res. 2014;58:1620–1635. doi: 10.1002/mnfr.201300743. - DOI - PubMed