. 2019 Sep 3;7(9):312.
doi: 10.3390/microorganisms7090312.

Abundance and Antimicrobial Resistance of Three Bacterial Species along a Complete Wastewater Pathway

Affiliations

Abundance and Antimicrobial Resistance of Three Bacterial Species along a Complete Wastewater Pathway

Ilse Verburg et al. Microorganisms. .

Abstract

After consumption, antibiotic residues and exposed bacteria end up via the feces in wastewater, and therefore wastewater is believed to play an important role in the spread of antimicrobial resistance (AMR). We investigated the abundance and AMR profiles of three different species over a complete wastewater pathway during a one-year sampling campaign, as well as including antimicrobial consumption and antimicrobial concentrations analysis. A total of 2886 isolates (997 Escherichia coli, 863 Klebsiella spp., and 1026 Aeromonas spp.) were cultured from the 211 samples collected. The bacterial AMR profiles mirrored the antimicrobial consumption in the respective locations, which were highest in the hospital. However, the contribution of hospital wastewater to AMR found in the wastewater treatment plant (WWTP) was below 10% for all antimicrobials tested. We found high concentrations (7-8 logs CFU/L) of the three bacterial species in all wastewaters, and they survived the wastewater treatment (effluent concentrations were around 5 log CFU/L), showing an increase of E. coli in the receiving river after the WWTP discharge. Although the WWTP had no effect on the proportion of AMR, bacterial species and antimicrobial residues were still measured in the effluent, showing the role of wastewater contamination in the environmental surface water.

Keywords: Aeromonas spp.; Escherichia coli; Klebsiella spp.; antimicrobial consumption; antimicrobial residues; antimicrobial resistance; bacterial abundance; clinical wastewater; wastewater pathway; wastewater treatment plant.


Conflict of interest statement

The authors declare no conflict of interest. The funders had no role in the design of the study; in the collection, analyses, or interpretation of data; in the writing of the manuscript, or in the decision to publish the results.

Figures
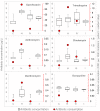
Figure 1
Figure 1
Antimicrobial consumption versus the measured concentrations. The red dots display the antimicrobial consumption, and the boxplots show the antimicrobial concentration measured in the wastewater. C = community, H = hospital, N = nursing home, I = influent. The antimicrobial concentrations measured in community (azithromycin, clindamycin, and clarithromycin) and nursing home wastewater (azithromycin and clarithromycin) are not shown as these locations contained less than five samples with decent measurements.
Figure 2
Figure 2
Antimicrobial consumption versus resistance. The antimicrobial consumption in daily defined dose (DDD) per 1000 inhabitant/patient/resident-days is shown as red bars. The grey bar plots represent the percentage of antimicrobial resistant bacteria measured in the wastewater. C = community, H = hospital, and N = nursing home (N). Meropenem (not shown) was only used in the hospital, although at low amounts (0.47 DDD/1000 patient-days). All bacterial isolates were susceptible to meropenem.
Figure 3
Figure 3
Contribution of hospital wastewater to the total wastewater. The contribution of hospital wastewater to the total volume of water treated by the wastewater treatment plant (WWTP) was approximately 1% (red line). The percentage of antimicrobial resistant bacteria in influent originating from hospital wastewater (grey bar plots) were calculated as explained in Section 2.5. CN = gentamicin, AMP = ampicillin, AMC = co-amoxiclav, PRL = piperacillin, CIP = ciprofloxacin, W = trimethoprim, SXT = co-trimoxazole. Antimicrobials with only one resistant isolate in influent were not included in the calculation.
Figure 4
Figure 4
The counts of colony forming units (CFU) for the three targeted bacteria per location. The bacterial counts are shown as log (CFU)/L, n is the number of collected samples used for the CFU counts. The diamonds within the boxplots represent the mean, the distribution of the CFU counts are shown as scatterplots.
Figure 5
Figure 5
Antimicrobial resistance in the WWTP and surface water. The percentage of resistant E. coli against four antimicrobials in the WWTP (influent and effluent), receiving surface water and the control surface water are shown. The number of isolates tested per location are shown in brackets.

References

    1. WHO . Antimicrobial Resistance Global Report on Surveillance. World Health Organization; Geneva, Switzerland: 2014.
    1. Hocquet D., Muller A., Bertrand X. What happens in hospitals does not stay in hospitals: Antibiotic-resistant bacteria in hospital wastewater systems. J. Hosp. Infect. 2016;93:395–402. doi: 10.1016/j.jhin.2016.01.010. - DOI - PubMed
    1. Shallcross L., Beckely N., Rait G., Hayward A., Petersen I. Antibiotic prescribing frequency amongst patients in primary care: A cohort study using electronic health records. J. Am. Chem. 2017;72:1818–1824. doi: 10.1093/jac/dkx048. - DOI - PMC - PubMed
    1. ECDC . Summary of the Latest Data on Antibiotic Consumption in the European Union. European Centre for Disease Prevention and Control; Solna Municipality, Sweden: 2017.
    1. Buelow E., Bayjanov J.R., Majoor E., Willems R.J., Bonten M.J., Schmitt H., van Schaik W. Limited influence of hospital wastewater on the microbiome and resistome of wastewater in a community sewerage system. FEMS Microbiol. Ecol. 2018;94 doi: 10.1093/femsec/fiy087. - DOI - PubMed