

Phosphorus-Induced Lipid Class Alteration Revealed by Lipidomic and Transcriptomic Profiling in Oleaginous Microalga Nannochloropsis sp. PJ12
- PMID: 31484443
- PMCID: PMC6780086
- DOI: 10.3390/md17090519
Phosphorus-Induced Lipid Class Alteration Revealed by Lipidomic and Transcriptomic Profiling in Oleaginous Microalga Nannochloropsis sp. PJ12
Abstract
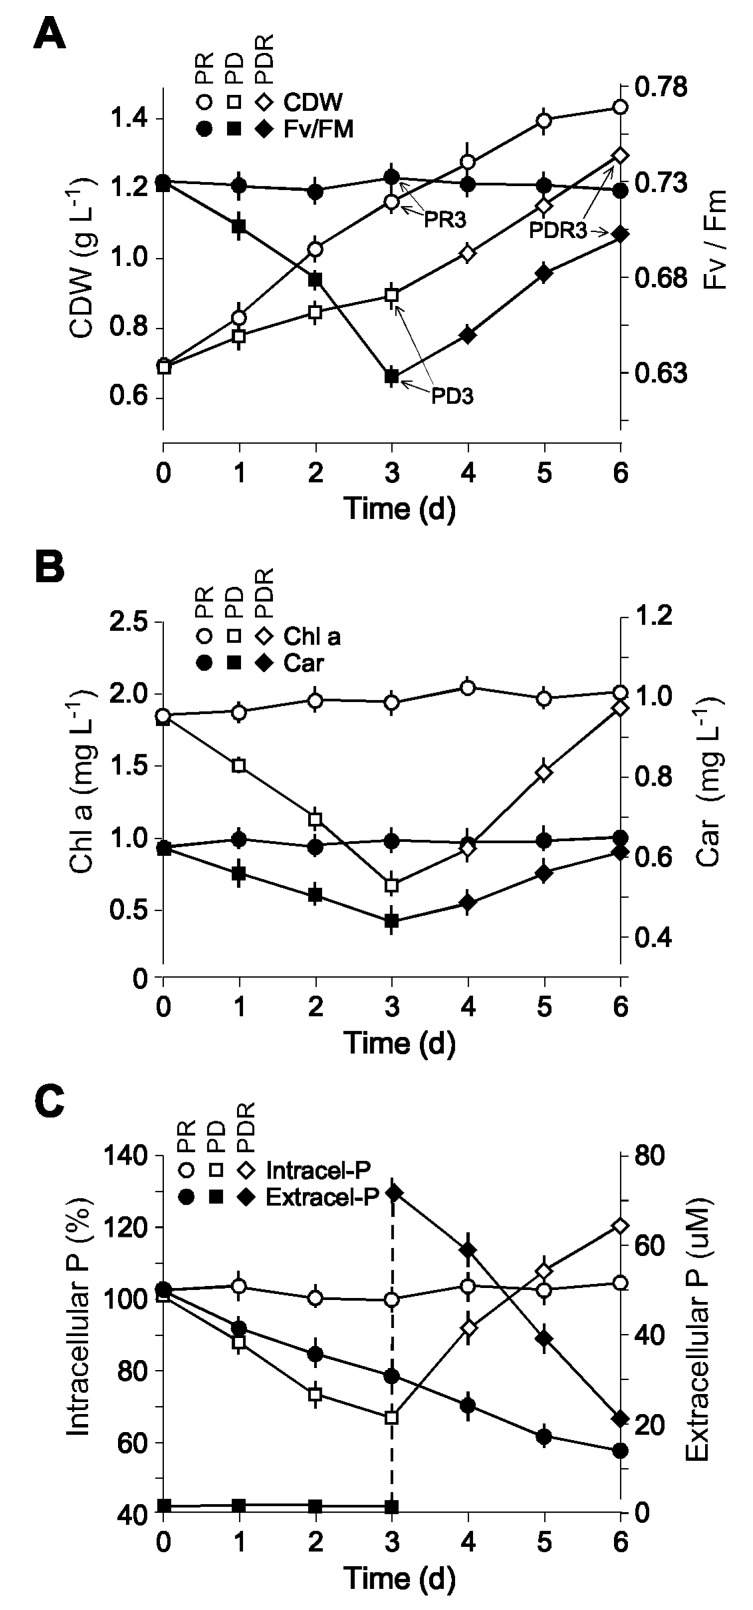
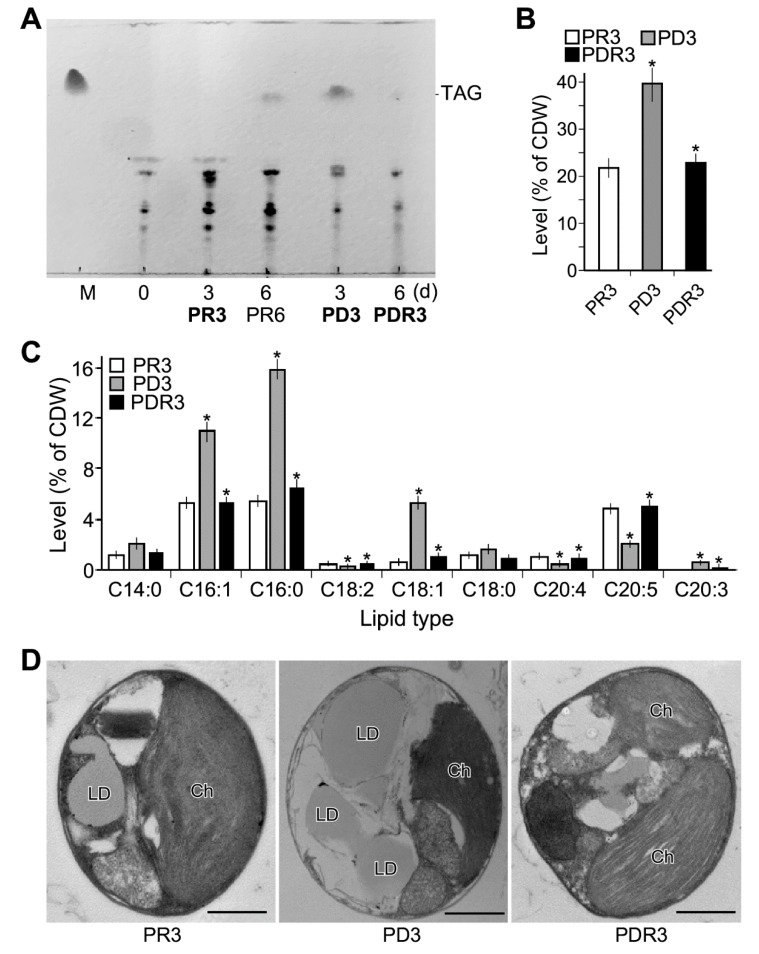
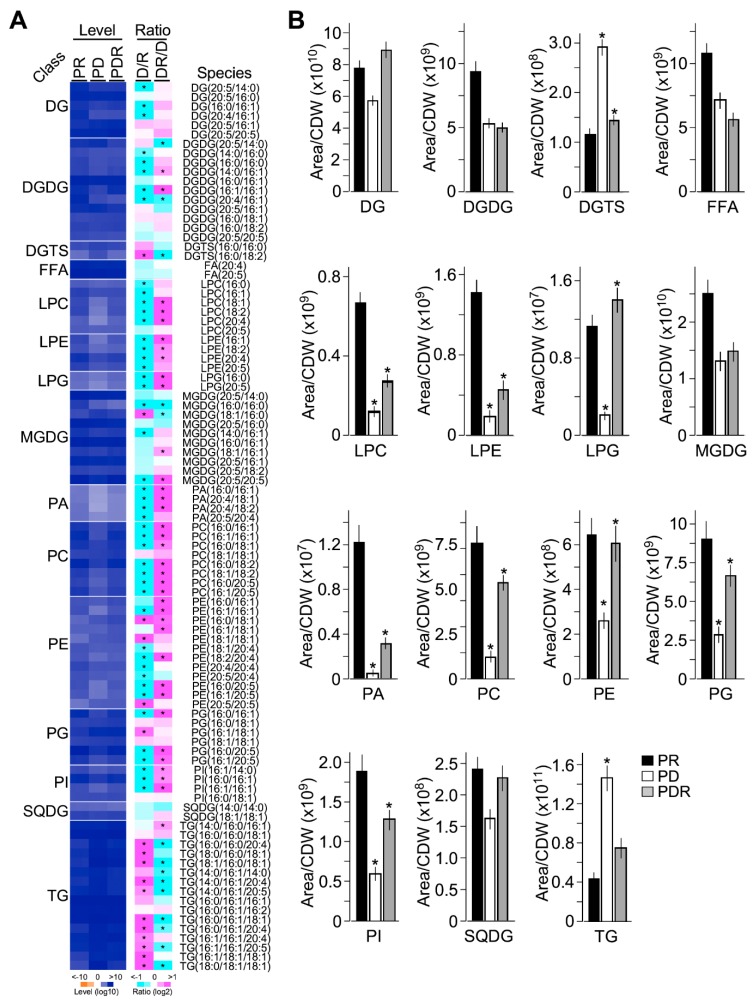
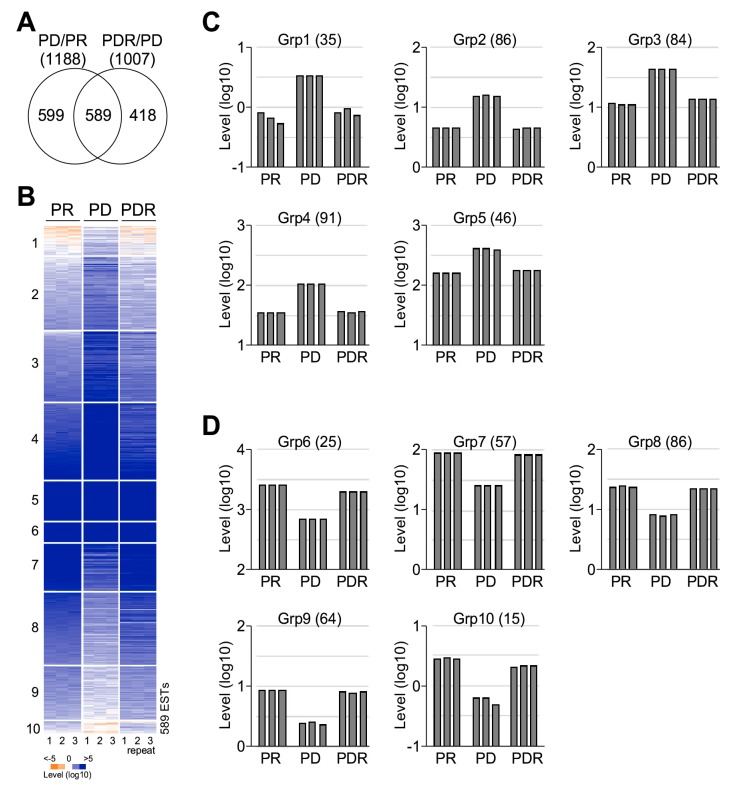
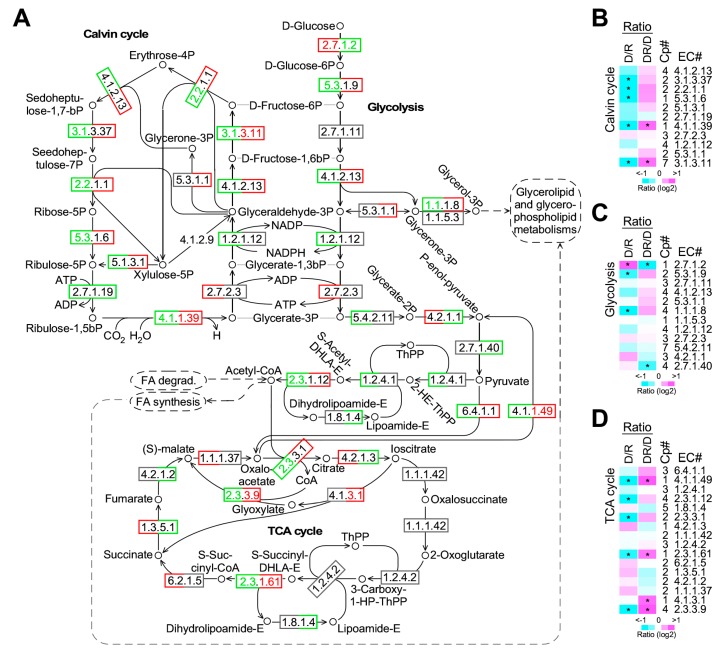
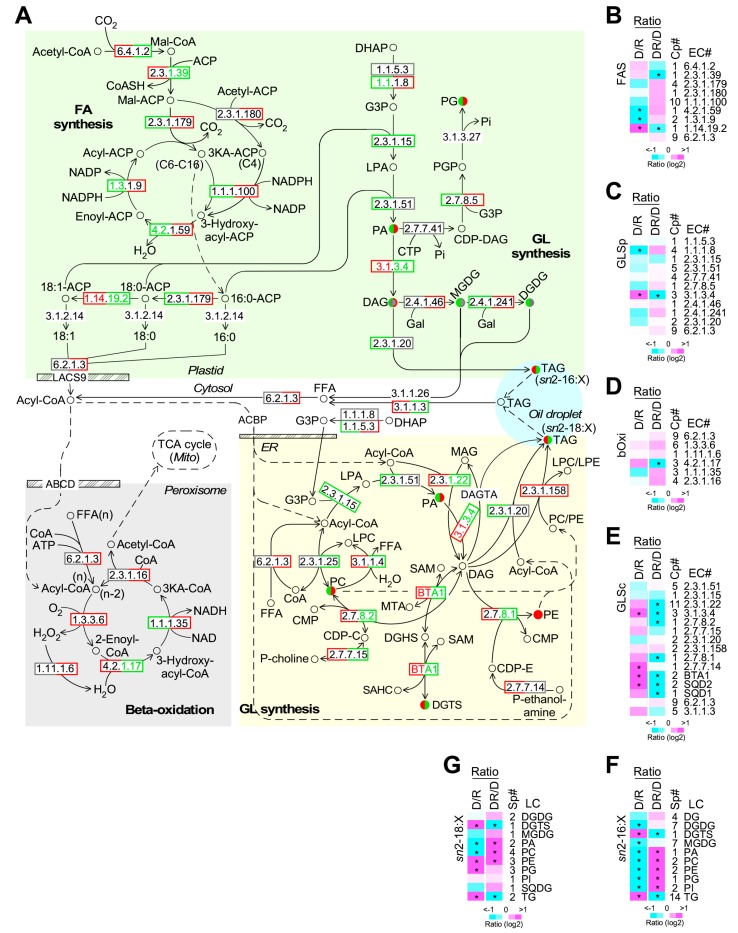
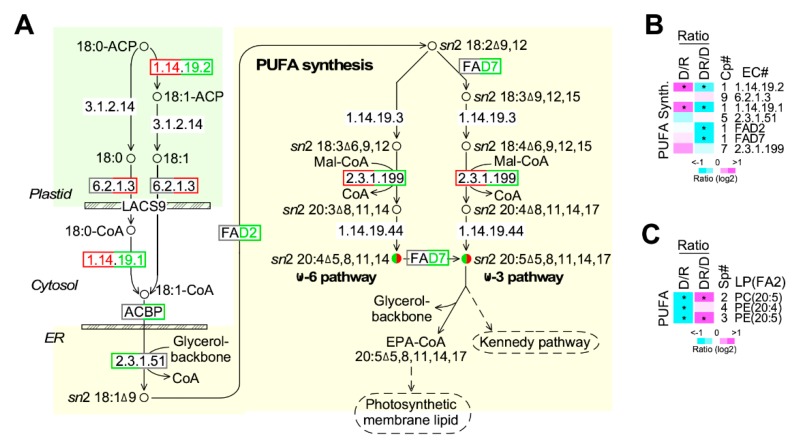
Phytoplankton are primary producers in the marine ecosystem, where phosphorus is often a limiting factor of their growth. Hence, they have evolved strategies to recycle phosphorus by replacing membrane phospholipids with phosphorus-free lipids. However, mechanisms for replacement of lipid classes remain poorly understood. To improve our understanding, we performed the lipidomic and transcriptomic profiling analyses of an oleaginous marine microalga Nannochloropsis sp. PJ12 in response to phosphorus depletion (PD) and replenishing. In this study, by using (liquid chromatography couple with tandem mass spectrometry) LC-MS/MS-based lipidomic analysis, we show that membrane phospholipid levels are significantly reduced upon PD, while phosphorus-free betaine lipid levels are increased. However, levels of phosphorus-free photosynthetic galactolipid and sulfolipid are not increased upon PD, consistent with the reduced photosynthetic activity. RNA-seq-based transcriptomic analysis indicates that enzymes involved in phospholipid recycling and phosphorus-free lipid synthesis are upregulated, supporting the lipidomic analysis. Furthermore, enzymes involved in FASII (type II fatty acid synthesis) elongation cycle upon PD are transcriptionally downregulated. EPA (eicosapentaenoic acid) level decrease upon PD is revealed by both GC-MS (gas chromatography coupled with mass spectrometry) and LC-MS/MS-based lipidomic analyses. PD-induced alteration is reversed after phosphorus replenishing. Taken together, our results suggest that the alteration of lipid classes upon environmental change of phosphorus is a result of remodeling rather than de novo synthesis in Nannochloropsis sp. PJ12.
Keywords: Nannochloropsis; lipid class; lipidomics; phosphate depletion; transcriptomics.
Conflict of interest statement
The authors declare no conflict of interest.
Figures
Similar articles
-
Transcriptomic and lipidomic analysis of an EPA-containing Nannochloropsis sp. PJ12 in response to nitrogen deprivation.Sci Rep. 2019 Mar 14;9(1):4540. doi: 10.1038/s41598-019-41169-2. Sci Rep. 2019. PMID: 30872742 Free PMC article.
-
Lipidomic Profiling of the Olive (Olea europaea L.) Fruit towards Its Valorisation as a Functional Food: In-Depth Identification of Triacylglycerols and Polar Lipids in Portuguese Olives.Molecules. 2019 Jul 13;24(14):2555. doi: 10.3390/molecules24142555. Molecules. 2019. PMID: 31337054 Free PMC article.
-
Proteomic and Transcriptomic Patterns during Lipid Remodeling in Nannochloropsis gaditana.Int J Mol Sci. 2020 Sep 22;21(18):6946. doi: 10.3390/ijms21186946. Int J Mol Sci. 2020. PMID: 32971781 Free PMC article.
-
Advanced genetic tools enable synthetic biology in the oleaginous microalgae Nannochloropsis sp.Plant Cell Rep. 2018 Oct;37(10):1383-1399. doi: 10.1007/s00299-018-2270-0. Epub 2018 Mar 6. Plant Cell Rep. 2018. PMID: 29511798 Review.
-
Lipidomic Approaches towards Deciphering Glycolipids from Microalgae as a Reservoir of Bioactive Lipids.Mar Drugs. 2016 May 19;14(5):101. doi: 10.3390/md14050101. Mar Drugs. 2016. PMID: 27213410 Free PMC article. Review.
Cited by
-
Assessment of Eicosapentaenoic Acid (EPA) Production from Filamentous Microalga Tribonema aequale: From Laboratory to Pilot-Scale Study.Mar Drugs. 2022 May 24;20(6):343. doi: 10.3390/md20060343. Mar Drugs. 2022. PMID: 35736146 Free PMC article.
-
Influence of Nitrogen-Modified Atmosphere Storage on Lipid Oxidation of Peanuts: From a Lipidomic Perspective.Foods. 2024 Jan 16;13(2):277. doi: 10.3390/foods13020277. Foods. 2024. PMID: 38254578 Free PMC article.
-
Lipid Droplets in Unicellular Photosynthetic Stramenopiles.Front Plant Sci. 2021 Apr 22;12:639276. doi: 10.3389/fpls.2021.639276. eCollection 2021. Front Plant Sci. 2021. PMID: 33968100 Free PMC article. Review.
-
Nannochloropsis as an Emerging Algal Chassis for Light-Driven Synthesis of Lipids and High-Value Products.Mar Drugs. 2024 Jan 24;22(2):54. doi: 10.3390/md22020054. Mar Drugs. 2024. PMID: 38393025 Free PMC article. Review.
-
Comprehensive Utilization of Marine Microalgae for Enhanced Co-Production of Multiple Compounds.Mar Drugs. 2020 Sep 16;18(9):467. doi: 10.3390/md18090467. Mar Drugs. 2020. PMID: 32948074 Free PMC article. Review.
References
-
- Dyhrman S.T., Jenkins B.D., Rynearson T.A., Saito M.A., Mercier M.L., Alexander H., Whitney A.P., Drzewianowski A., Bulygin V.V., Bertrand E.M., et al. The Transcriptome and Proteome of the Diatom Thalassiosira pseudonana Reveal a Diverse Phosphorus Stress Response. PLoS ONE. 2012;7:e33768. doi: 10.1371/journal.pone.0033768. - DOI - PMC - PubMed
MeSH terms
Substances
LinkOut - more resources
Full Text Sources
Molecular Biology Databases
Research Materials
Miscellaneous
