

Characterizing cardiac involvement in amyloidosis using cardiovascular magnetic resonance diffusion tensor imaging
- PMID: 31484544
- PMCID: PMC6727537
- DOI: 10.1186/s12968-019-0563-2
Characterizing cardiac involvement in amyloidosis using cardiovascular magnetic resonance diffusion tensor imaging
Abstract
Background: In-vivo cardiovascular magnetic resonance (CMR) diffusion tensor imaging (DTI) allows imaging of alterations of cardiac fiber architecture in diseased hearts. Cardiac amyloidosis (CA) causes myocardial infiltration of misfolded proteins with unknown consequences for myocardial microstructure. This study applied CMR DTI in CA to assess microstructural alterations and their consequences for myocardial function compared to healthy controls.
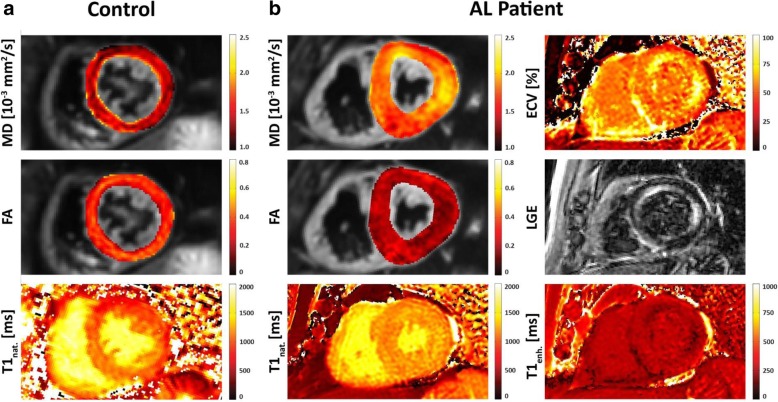
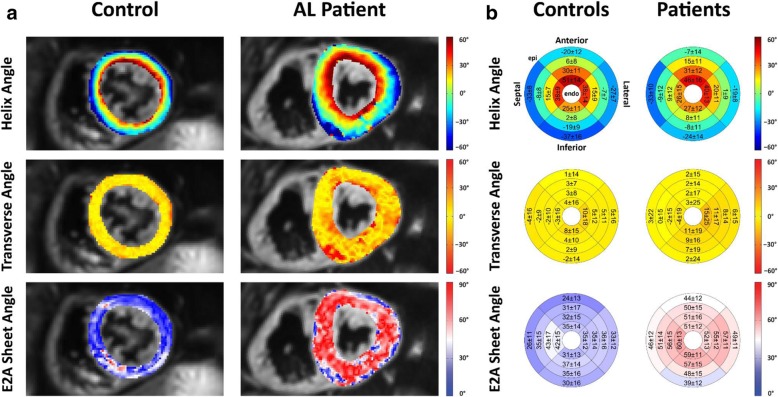
Methods: Ten patients with CA (8 AL, 2 ATTR) and ten healthy controls were studied using a diffusion-weighed second-order motion-compensated spin-echo sequence at 1.5 T. Additionally, left ventricular morphology, ejection fraction, strain and native T1 values were obtained in all subjects. In CA patients, T1 mapping was repeated after the administration of gadolinium for extracellular volume fraction (ECV) calculation. CMR DTI analysis was performed to yield the scalar diffusion metrics mean diffusivity (MD) and fractional anisotropy (FA) as well as the characteristics of myofiber orientation including helix, transverse and E2A sheet angle (HA, TA, E2A).
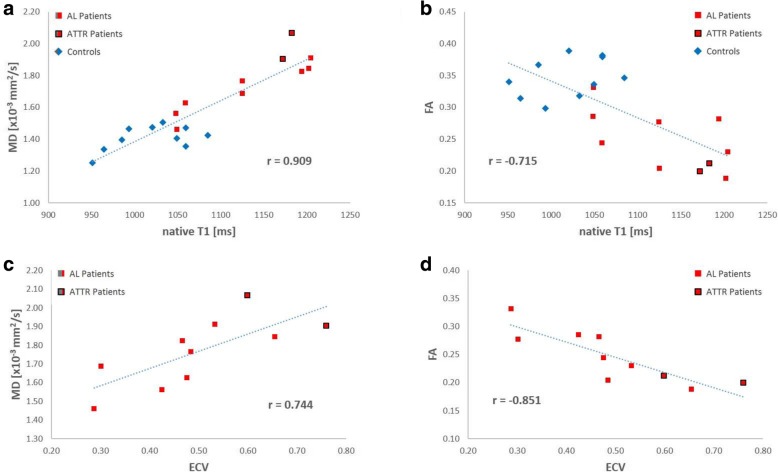
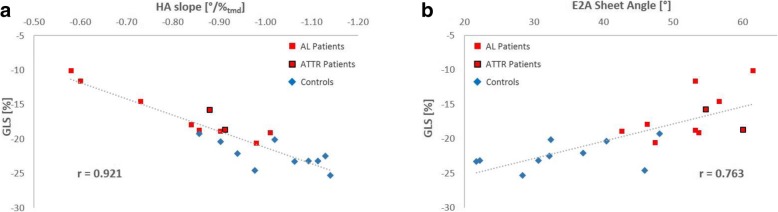
Results: MD and FA were found to be significantly different between CA patients and healthy controls (MD 1.77 ± 0.17 10- 3 vs 1.41 ± 0.07 10- 3 mm2/s, p < 0.001; FA 0.25 ± 0.04 vs 0.35 ± 0.03, p < 0.001). MD demonstrated an excellent correlation with native T1 (r = 0.908, p < 0.001) while FA showed a significant correlation with ECV in the CA population (r = - 0.851, p < 0.002). HA exhibited a more circumferential orientation of myofibers in CA patients, in conjunction with a higher TA standard deviation and a higher absolute E2A sheet angle. The transmural HA slope was found to be strongly correlated with the global longitudinal strain (r = 0.921, p < 0.001).
Conclusion: CMR DTI reveals significant alterations of scalar diffusion metrics in CA patients versus healthy controls. Elevated MD and lower FA values indicate myocardial disarray with higher diffusion in CA that correlates well with native T1 and ECV measures. In CA patients, CMR DTI showed pronounced circumferential orientation of the myofibers, which may provide the rationale for the reduction of global longitudinal strain that occurs in amyloidosis patients. Accordingly, CMR DTI captures specific features of amyloid infiltration, which provides a deeper understanding of the microstructural consequences of CA.
Keywords: Cardiac amyloidosis; Cardiovascular magnetic resonance imaging; Diffusion tensor imaging; Myocardial microstructure; Tissue characterization.
Conflict of interest statement
The authors declare that they have no competing interests.
Figures
References
Publication types
MeSH terms
Substances
LinkOut - more resources
Full Text Sources
Medical
Research Materials
