. 2019 Sep 4;18(1):150.
doi: 10.1186/s12934-019-1198-6.

Metabolic fluxes-oriented control of bioreactors: a novel approach to tune micro-aeration and substrate feeding in fermentations

Affiliations

Metabolic fluxes-oriented control of bioreactors: a novel approach to tune micro-aeration and substrate feeding in fermentations

Thiago José Barbosa Mesquita et al. Microb Cell Fact. .

Abstract

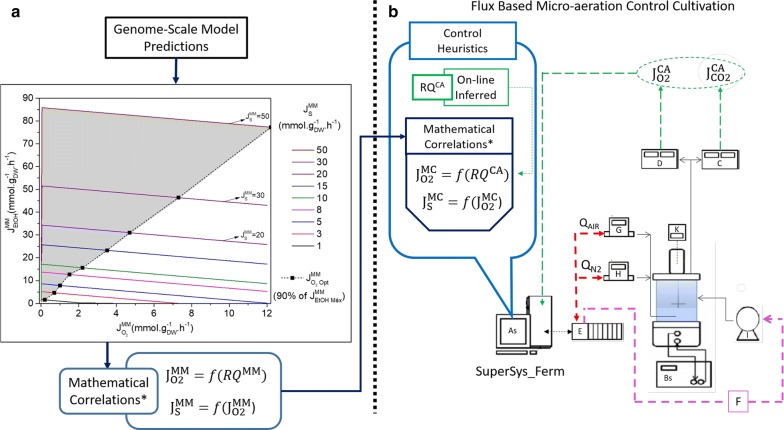
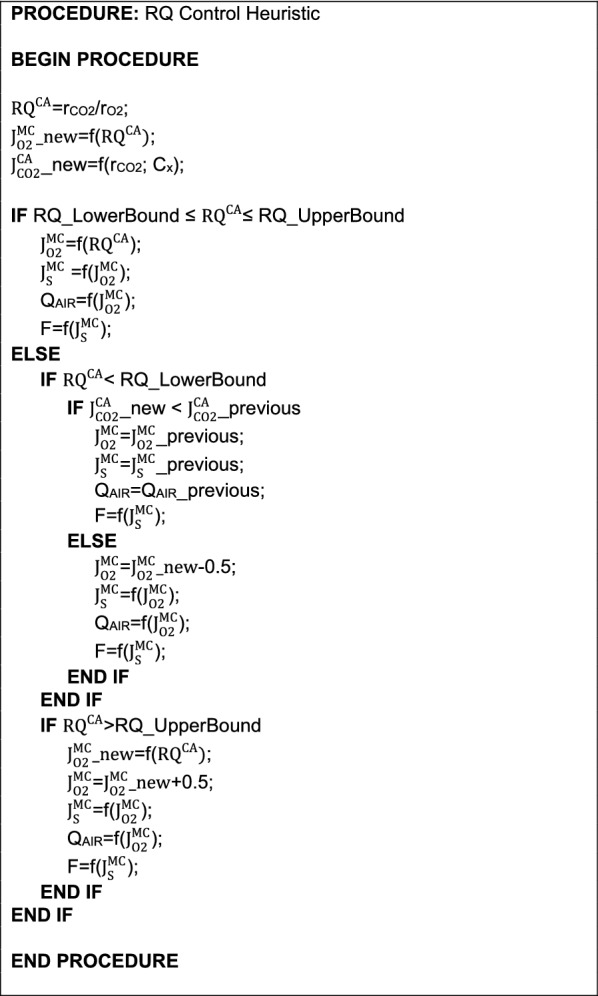
Background: Fine-tuning the aeration for cultivations when oxygen-limited conditions are demanded (such as the production of vaccines, isobutanol, 2-3 butanediol, acetone, and bioethanol) is still a challenge in the area of bioreactor automation and advanced control. In this work, an innovative control strategy based on metabolic fluxes was implemented and evaluated in a case study: micro-aerated ethanol fermentation.

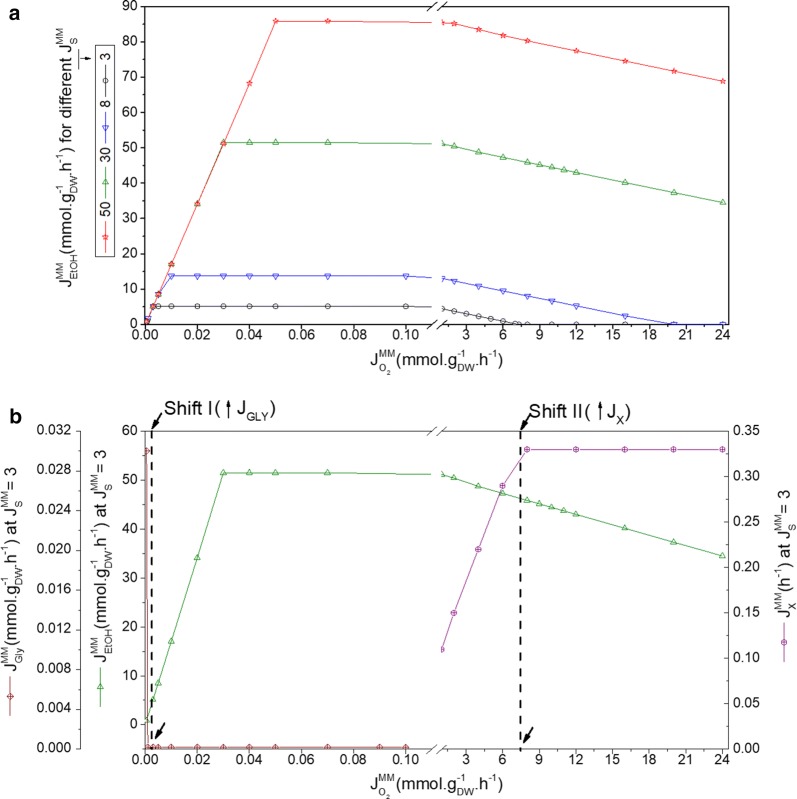
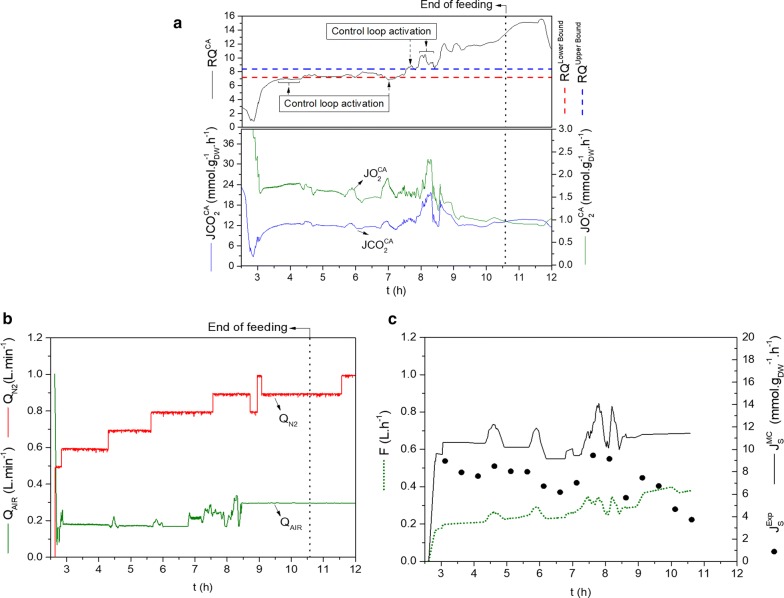
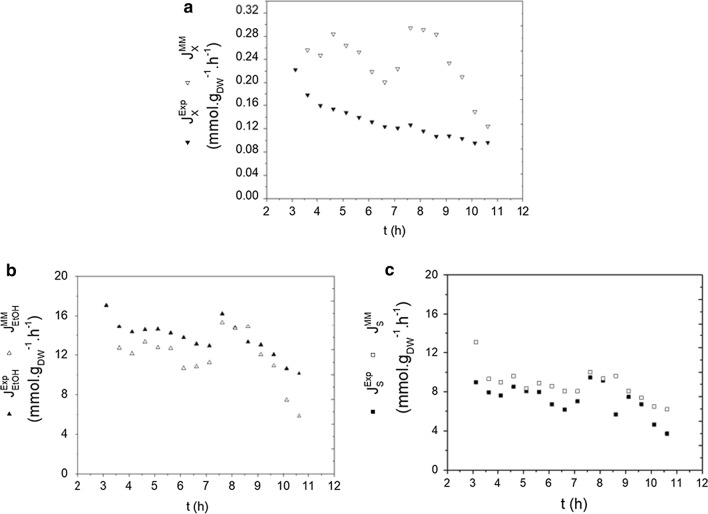
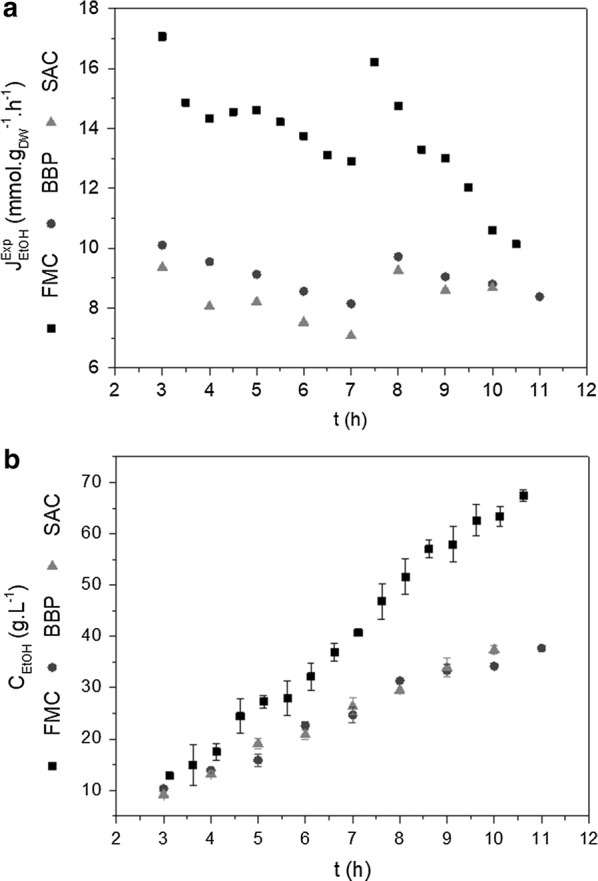
Results: The experiments were carried out in fed-batch mode, using commercial Saccharomyces cerevisiae, defined medium, and glucose as carbon source. Simulations of a genome-scale metabolic model for Saccharomyces cerevisiae were used to identify the range of oxygen and substrate fluxes that would maximize ethanol fluxes. Oxygen supply and feed flow rate were manipulated to control oxygen and substrate fluxes, as well as the respiratory quotient (RQ). The performance of the controlled cultivation was compared to two other fermentation strategies: a conventional "Brazilian fuel-ethanol plant" fermentation and a strictly anaerobic fermentation (with ultra-pure nitrogen used as the inlet gas). The cultivation carried out under the proposed control strategy showed the best average volumetric ethanol productivity (7.0 g L-1 h-1), with a final ethanol concentration of 87 g L-1 and yield of 0.46 gethanol g substrate -1 . The other fermentation strategies showed lower yields (close to 0.40 gethanol g substrate -1 ) and ethanol productivity around 4.0 g L-1 h-1.

Conclusion: The control system based on fluxes was successfully implemented. The proposed approach could also be adapted to control several bioprocesses that require restrict aeration.

Keywords: Alcoholic fermentation; Bioreactor advanced control; Metabolic flux control; Micro-aeration; Saccharomyces cerevisiae.


Conflict of interest statement

The authors declare that they have no competing interests.

Figures

Fig. 1
Fig. 1
Schematic representation of the proposed control strategy for the Flux-based Micro-aerated control fermentation (FMC). a Simulated ethanol fluxes using the genome-scale metabolic model (GSM) of S. cerevisiae iND750 for different glucose and oxygen fluxes as inputs. The gray shaded area in A represents the maximum GSM simulated JEtOHMM region. JO2MM—simulated oxygen flux; JEtOHMM—simulated ethanol flux; JSMM—simulated substrate flux. b FMC control framework, with RQ as the controlled variable, and both QAIR and F as manipulated variables. Fluxes: JSMC and JO2MC—mathematical correlation substrate and O2 flux; JO2CA and JO2CA—O2 and CO2 fluxes calculated on-line by the control algorithm; RQCA—respiratory quotient calculated on-line. Equipment: As-computational monitoring and supervision system SuperSys_Ferm; Bs—Bath; C—CO2 analyzer; D—O2 analyzer; E—cFP-FieldPoint; K—Impeller speed controller; G—Air flow controller; H—Nitrogen flow controller; I—feed pump. Dashed lines—information. Control loops: control of oxygen consumption (Air flow rate—QAIR, Eq. B2.3; Nitrogen flow rate—iQN2) (in red); control of substrate consumption (Feed flow rate—F, Eq. B2.1) (in lilac); Controlled variable (RQ) (in green). Some lines of acquisition and communication with the field point are omitted. All fluxes in mmol gDW−1 h−1. *Mathematical correlations in Results Metabolic Models Simulations and Correlations (Eqs. 1 and 2, respectively)
Fig. 2
Fig. 2
Metabolic shifts predicted by the GSM for different oxygen and substrate fluxes. a Metabolic fluxes predicted by the genome-scale metabolic model (GSM) of S. cerevisiae iND750 [33]. b An example of the metabolic shifts predicted by the GSM, for a glucose flux of 3 mmol gDW−1 h−1. Shift I: increase of JGlyMM and decrease of JEtOHMM; Shift II: increase of JXMM and decrease of JEtOHMM
Box 1.
Box 1.
Calculation procedures for experimental fluxes. The values for constants and other conditions are: yCO2,in = 0.04 * 10−2; Tin = 294.25 K; Pout = 1 atm; R = 0.08206*10−3 L atm mmol−1 K−1. The variables yCO2,out, yO2,out and Tout were measured on-line and accessed through the supervisory software. JsExp, JEtOHExp, JGlyExp, JXExp are expressed in mmol gDW−1 h−1 and were obtained from off-line data. Volume (V, in L) was estimated at-line after integration of feed flow rate and subtraction of medium withdrawals. Mass and mole data are expressed in g and mmol, respectively
Box 2.
Box 2.
Flux-based micro-aerated control (FMC): equations for updating fresh medium feeding and air flow rates. The values for constants and other conditions are: yCO2,N2 = 0.01*10−2; Tin = 294.25 K; Pout = 1 atm; R = 0.08206*10−3 L atm mmol−1 K−1. Qgas,out, yCO2,in, and yO2,in were estimated through mass balance. The variables yCO2,out, yO2,out and Tout were measured on-line and accessed through the supervisory software. JsMC, JO2MC, JO2CA, JCO2CA are expressed in mmol gDW−1 h−1. QN2, QAIR and F were manipulated and are expressed in L h−1. *Mathematical correlations in Results Metabolic Models Simulations and Correlations (Eqs. 1 and 2, respectively)
Box 3.
Box 3.
RQ control heuristics and framework
Fig. 3
Fig. 3
Overall performance of the flux-based Micro-aerated Control. a Respiratory quotient (RQ), oxygen flux (JO2CA), and carbon dioxide flux JCO2CA in FMC fermentation. The arrows indicate the activation of the RQ loop, which was deactivated when RQ returned to the set boundaries (lower boundary: red dashed line, upper boundary: blue dashed line) or when DOT 4.5%. b QN2 and QAIR flow rates during the feeding phase and up to the end of the cultivation. c Fresh medium feed flow rate and substrate flux JSCA in FMC fermentation
Fig. 4
Fig. 4
Simulated and experimental fluxes for FMC fermentation during the fed-batch phase. Metabolic fluxes of a biomass, b ethanol and c substrate
Fig. 5
Fig. 5
Experimental fluxes (a) and concentrations (b) of ethanol during the fed-batch phase for FMC, BBP, and SAC. a Experimental fluxes of ethanol JEtOHExp. b Concentrations of ethanol CEtOH. FMC flux-based micro-aeration control, BBP “Brazilian Bioethanol Plant”-type fermentation, SAC strictly anaerobic condition

References

    1. Shuler ML, Kargi F. Bioprocess engineering: basic concepts. 2. New Jersey: Prentice Hall; 2002.
    1. Lee SC, Hwang YB, Chang HN, Chang YK. Adaptive control of dissolved oxygen concentration in a bioreactor. Biotechnol Bioeng. 1991;37:597–607. doi: 10.1002/bit.260370702. - DOI - PubMed
    1. Mears L, Stocks SM, Albaek MO, Cassells B, Sin G, Gernaey KV. A novel model-based control strategy for aerobic filamentous fungal fed-batch fermentation processes. Biotechnol Bioeng. 2017;114:1459–1468. doi: 10.1002/bit.26274. - DOI - PubMed
    1. Mete T, Ozkan G, Hapoglu H, Alpbaz M. Control of dissolved oxygen concentration using neural network in a batch bioreactor. Comput Appl Eng Educ. 2012;20:619–628. doi: 10.1002/cae.20430. - DOI
    1. Carius L, Rumschinski P, Faulwasser T, Flockerzi D, Grammel H, Findeisen R. Model-based derivation, analysis and control of unstable microaerobic steady-states-considering Rhodospirillum rubrum as an example. Biotechnol Bioeng. 2014;111:734–747. doi: 10.1002/bit.25140. - DOI - PubMed

LinkOut - more resources