

Diffusion tensor imaging for characterizing tumor microstructure and improving diagnostic performance on breast MRI: a prospective observational study
- PMID: 31484577
- PMCID: PMC6727336
- DOI: 10.1186/s13058-019-1183-3
Diffusion tensor imaging for characterizing tumor microstructure and improving diagnostic performance on breast MRI: a prospective observational study
Abstract
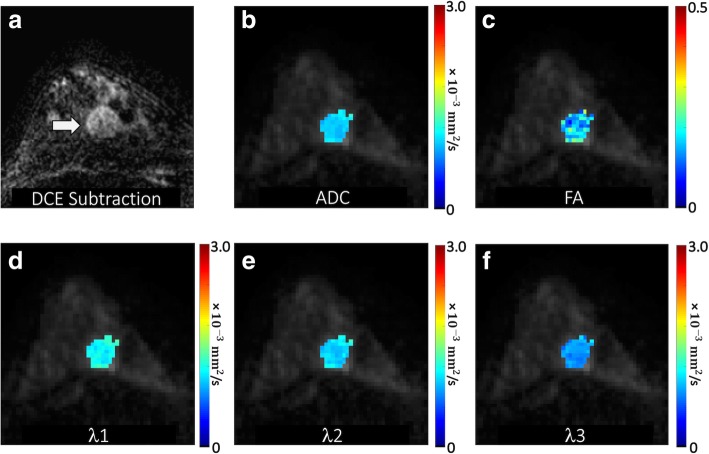
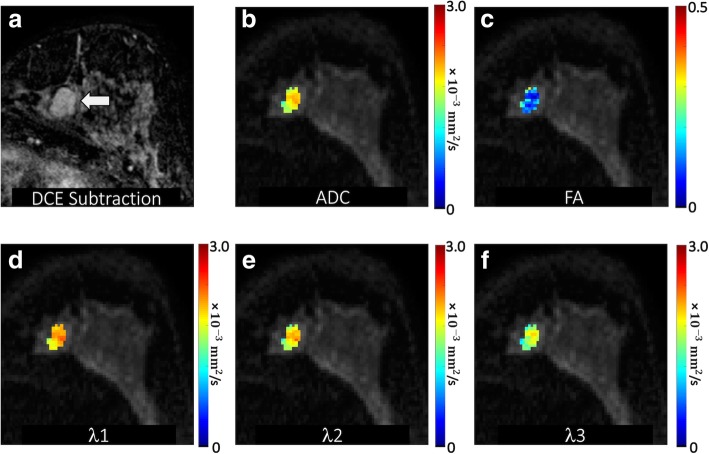
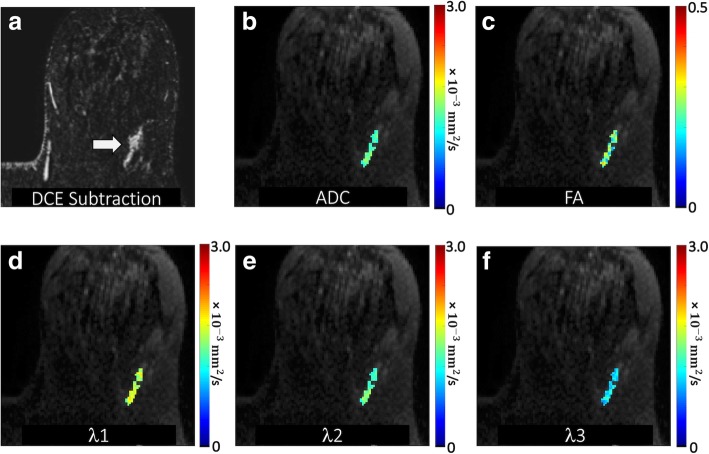
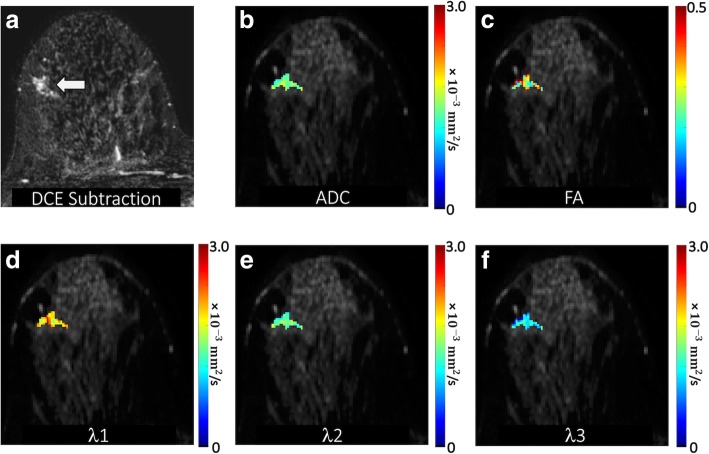
Background: Diffusion-weighted imaging (DWI) can increase breast MRI diagnostic specificity due to the tendency of malignancies to restrict diffusion. Diffusion tensor imaging (DTI) provides further information over conventional DWI regarding diffusion directionality and anisotropy. Our study evaluates DTI features of suspicious breast lesions detected on MRI to determine the added diagnostic value of DTI for breast imaging.
Methods: With IRB approval, we prospectively enrolled patients over a 3-year period who had suspicious (BI-RADS category 4 or 5) MRI-detected breast lesions with histopathological results. Patients underwent multiparametric 3 T MRI with dynamic contrast-enhanced (DCE) and DTI sequences. Clinical factors (age, menopausal status, breast density, clinical indication, background parenchymal enhancement) and DCE-MRI lesion parameters (size, type, presence of washout, BI-RADS category) were recorded prospectively by interpreting radiologists. DTI parameters (apparent diffusion coefficient [ADC], fractional anisotropy [FA], axial diffusivity [λ1], radial diffusivity [(λ2 + λ3)/2], and empirical difference [λ1 - λ3]) were measured retrospectively. Generalized estimating equations (GEE) and least absolute shrinkage and selection operator (LASSO) methods were used for univariate and multivariate logistic regression, respectively. Diagnostic performance was internally validated using the area under the curve (AUC) with bootstrap adjustment.
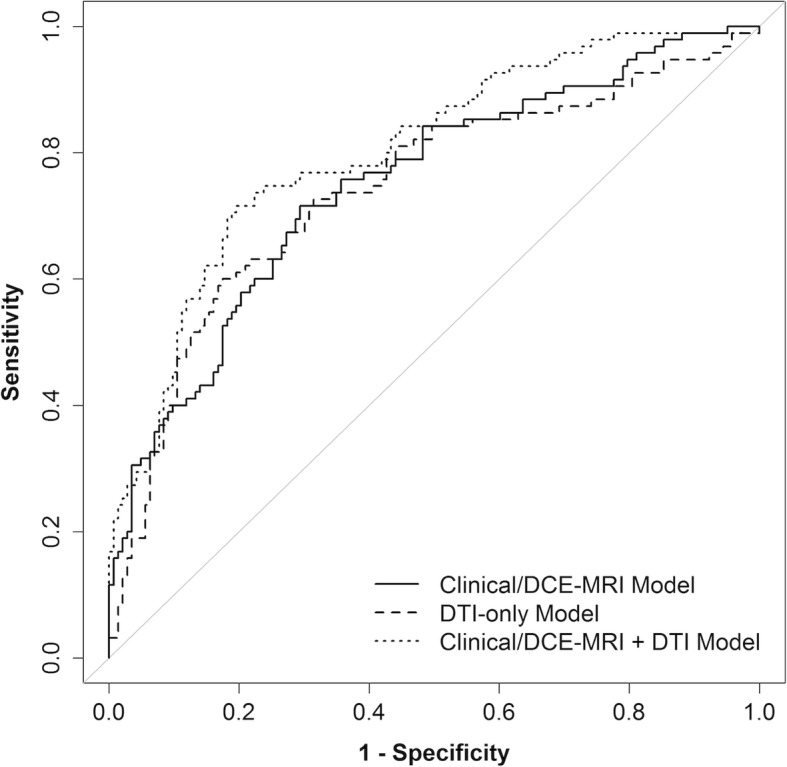
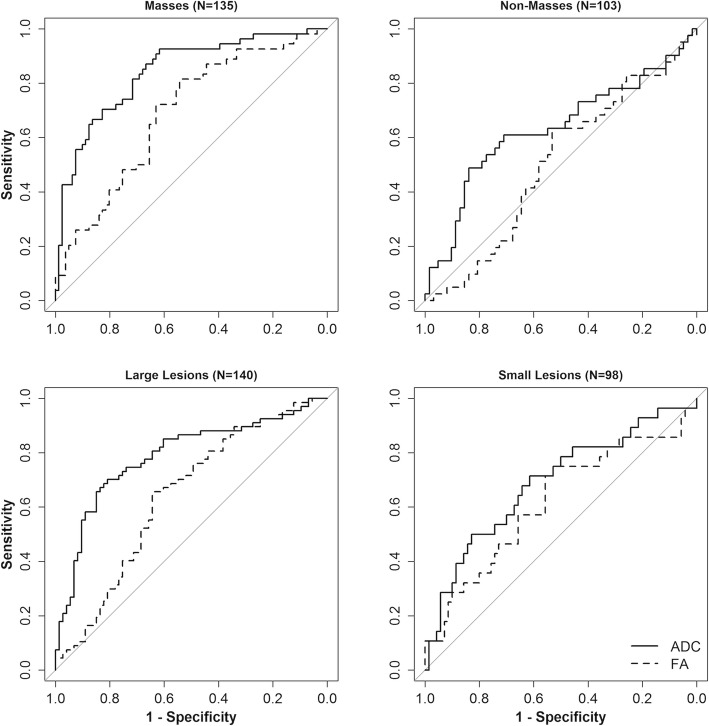
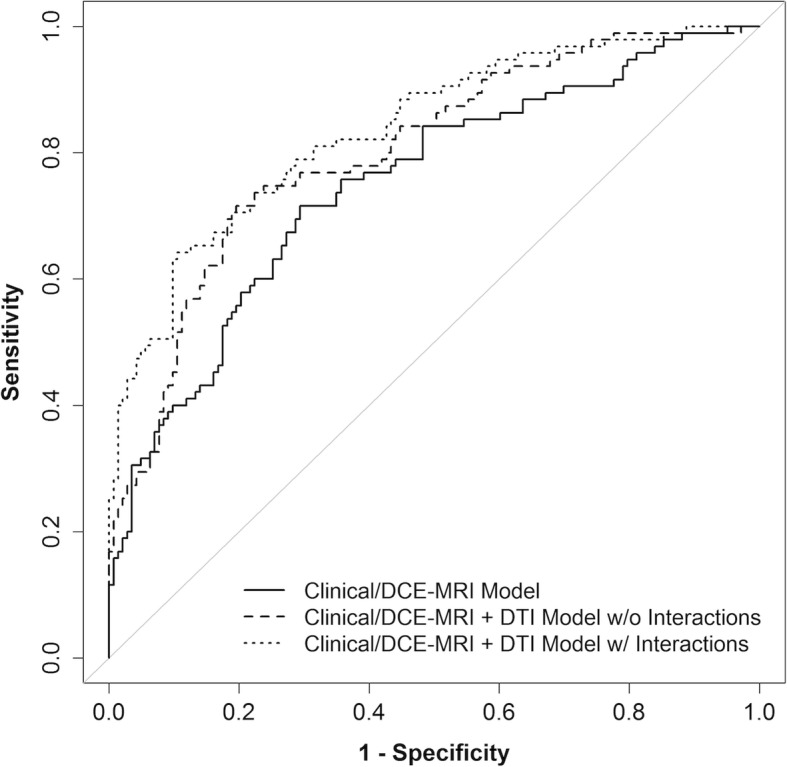
Results: The study included 238 suspicious breast lesions (95 malignant, 143 benign) in 194 women. In univariate analysis, lower ADC, axial diffusivity, and radial diffusivity were associated with malignancy (OR = 0.37-0.42 per 1-SD increase, p < 0.001 for each), as was higher FA (OR = 1.45, p = 0.007). In multivariate analysis, LASSO selected only ADC (OR = 0.41) as a predictor for a DTI-only model, while both ADC (OR = 0.41) and FA (OR = 0.88) were selected for a model combining clinical and imaging parameters. Post-hoc analysis revealed varying association of FA with malignancy depending on the lesion type. The combined model (AUC = 0.81) had a significantly better performance than Clinical/DCE-MRI-only (AUC = 0.76, p < 0.001) and DTI-only (AUC = 0.75, p = 0.002) models.
Conclusions: DTI significantly improves diagnostic performance in multivariate modeling. ADC is the most important diffusion parameter for distinguishing benign and malignant breast lesions, while anisotropy measures may help further characterize tumor microstructure and microenvironment.
Keywords: Apparent diffusion coefficient (ADC); Breast MRI; Diagnosis; Diffusion tensor imaging (DTI); Dynamic contrast-enhanced (DCE) MRI; False positives; Fractional anisotropy (FA); Suspicious lesions.
Conflict of interest statement
The authors disclose research grants and/or non-financial research support from GE Healthcare (SCP, HR, DSH), Philips Healthcare (SCP, HR, DSH), Toshiba America Medical Systems (DSH), and Siemens Medical Solutions USA (DSH) outside the submitted work. The other authors declare that they have no competing interests.
Figures
References
-
- Riedl CC, Luft N, Bernhart C, Weber M, Bernathova M, Tea MK, Rudas M, Singer CF, Helbich TH. Triple-modality screening trial for familial breast cancer underlines the importance of magnetic resonance imaging and questions the role of mammography and ultrasound regardless of patient mutation status, age, and breast density. J Clin Oncol. 2015;33(10):1128–1135. - PMC - PubMed
-
- Lehman CD, Isaacs C, Schnall MD, Pisano ED, Ascher SM, Weatherall PT, Bluemke DA, Bowen DJ, Marcom PK, Armstrong DK, et al. Cancer yield of mammography, MR, and US in high-risk women: prospective multi-institution breast cancer screening study. Radiology. 2007;244(2):381–388. - PubMed
-
- Kuhl C, Weigel S, Schrading S, Arand B, Bieling H, Konig R, Tombach B, Leutner C, Rieber-Brambs A, Nordhoff D, et al. Prospective multicenter cohort study to refine management recommendations for women at elevated familial risk of breast cancer: the EVA trial. J Clin Oncol. 2010;28(9):1450–1457. - PubMed
-
- Sardanelli F, Podo F, D’Agnolo G, Verdecchia A, Santaquilani M, Musumeci R, Trecate G, Manoukian S, Morassut S, de Giacomi C, et al. Multicenter comparative multimodality surveillance of women at genetic-familial high risk for breast cancer (HIBCRIT study): interim results. Radiology. 2007;242(3):698–715. - PubMed
-
- Berg WA, Zhang Z, Lehrer D, Jong RA, Pisano ED, Barr RG, Bohm-Velez M, Mahoney MC, Evans WP, 3rd, Larsen LH, et al. Detection of breast cancer with addition of annual screening ultrasound or a single screening MRI to mammography in women with elevated breast cancer risk. Jama. 2012;307(13):1394–1404. - PMC - PubMed
Publication types
MeSH terms
Substances
Grants and funding
LinkOut - more resources
Full Text Sources
Medical
