

Potential impact on prevalence of obesity in the UK of a 20% price increase in high sugar snacks: modelling study
- PMID: 31484641
- PMCID: PMC6724407
- DOI: 10.1136/bmj.l4786
Potential impact on prevalence of obesity in the UK of a 20% price increase in high sugar snacks: modelling study
Abstract
Objective: To estimate the potential impact on body mass index (BMI) and prevalence of obesity of a 20% price increase in high sugar snacks.
Design: Modelling study.
Setting: General adult population of the United Kingdom.
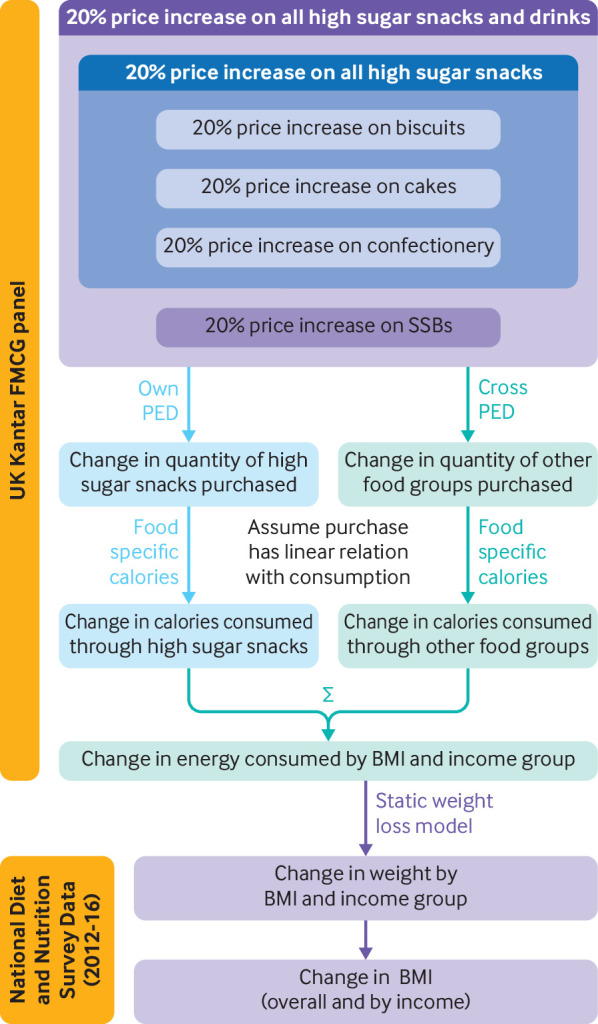
Participants: 36 324 households with data on product level household expenditure from UK Kantar FMCG (fast moving consumer goods) panel for January 2012 to December 2013. Data were used to estimate changes in energy (kcal, 1 kcal=4.18 kJ=0.00418 MJ) purchase associated with a 20% price increase in high sugar snacks. Data for 2544 adults from waves 5 to 8 of the National Diet and Nutrition Survey (2012-16) were used to estimate resulting changes in BMI and prevalence of obesity.
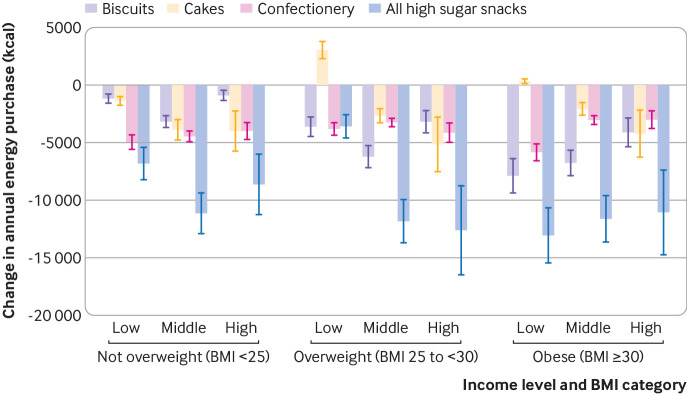
Main outcome measures: The effect on per person take home energy purchases of a 20% price increase for three categories of high sugar snacks: confectionery (including chocolate), biscuits, and cakes. Health outcomes resulting from the price increase were measured as changes in weight, BMI (not overweight (BMI <25), overweight (BMI ≥25 and <30), and obese (BMI ≥30)), and prevalence of obesity. Results were stratified by household income and BMI.
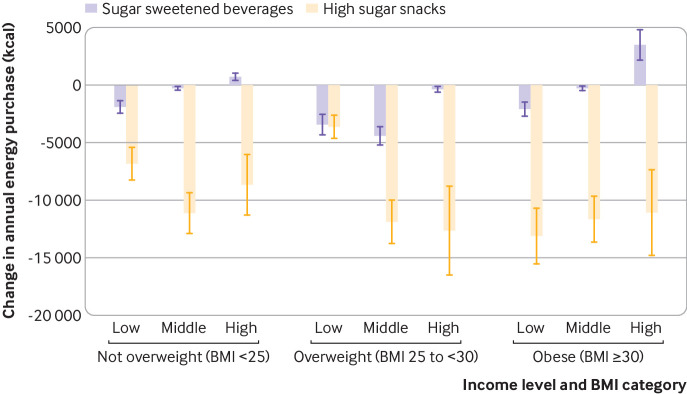
Results: For income groups combined, the average reduction in energy consumption for a 20% price increase in high sugar snacks was estimated to be 8.9×10³ kcal (95% confidence interval -13.1×10³ to -4.2×10³ kcal). Using a static weight loss model, BMI was estimated to decrease by 0.53 (95% confidence interval -1.01 to -0.06) on average across all categories and income groups. This change could reduce the UK prevalence of obesity by 2.7 percentage points (95% confidence interval -3.7 to -1.7 percentage points) after one year. The impact of a 20% price increase in high sugar snacks on energy purchase was largest in low income households classified as obese and smallest in high income households classified as not overweight.
Conclusions: Increasing the price of high sugar snacks by 20% could reduce energy intake, BMI, and prevalence of obesity. This finding was in a UK context and was double that modelled for a similar price increase in sugar sweetened beverages.
Published by the BMJ Publishing Group Limited. For permission to use (where not already granted under a licence) please go to http://group.bmj.com/group/rights-licensing/permissions.
Conflict of interest statement
Competing interests: All authors have completed the ICMJE uniform disclosure form at www.icmje.org/coi_disclosure.pdf and declare: support from the National Institute for Health Research Policy Research Programme (Policy Research Unit in Behaviour and Health (PR-UN-0409-10109 principal investigator TMM)); no financial relationships with any organisations that might have an interest in the submitted work in the previous three years; no other relationships or activities that could appear to have influenced the submitted work.
Figures
Comment in
-
Taxing confectionery, biscuits, and cakes to control obesity.BMJ. 2019 Sep 4;366:l5298. doi: 10.1136/bmj.l5298. BMJ. 2019. PMID: 31484653 No abstract available.
References
-
- World Health Organization. Obesity and Overweight 2018: www.who.int/news-room/fact-sheets/detail/obesity-and-overweight [Accessed 13 July 2019].
-
- World Health Organization. Global Health Observatory Data Repository. 2019: http://apps.who.int/gho/data/node.main.A900A?lang=en [Accessed 13 July 2019].
-
- Organisation for Economic Co-operation and Development Obesity Update. OECD Publishing, 2017.
-
- Baker C. Obesity Statistics - Briefing Paper #3336. 2018 House of Commons Library. London.
Publication types
MeSH terms
Substances
Grants and funding
LinkOut - more resources
Full Text Sources
Medical
Molecular Biology Databases