. 2019 Nov 15;79(22):5723-5733.
doi: 10.1158/0008-5472.CAN-19-0960. Epub 2019 Sep 4.

Deoxycytidine Release from Pancreatic Stellate Cells Promotes Gemcitabine Resistance

Affiliations

Deoxycytidine Release from Pancreatic Stellate Cells Promotes Gemcitabine Resistance

Simona Dalin et al. Cancer Res. .

Abstract

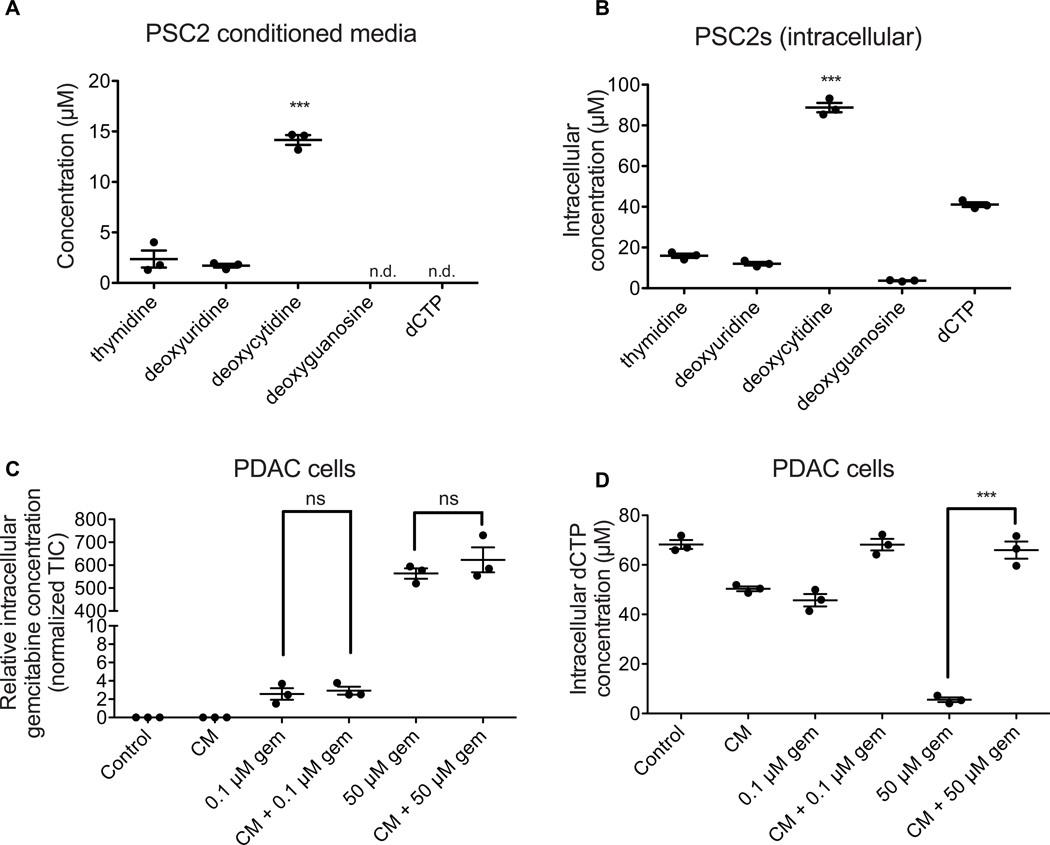
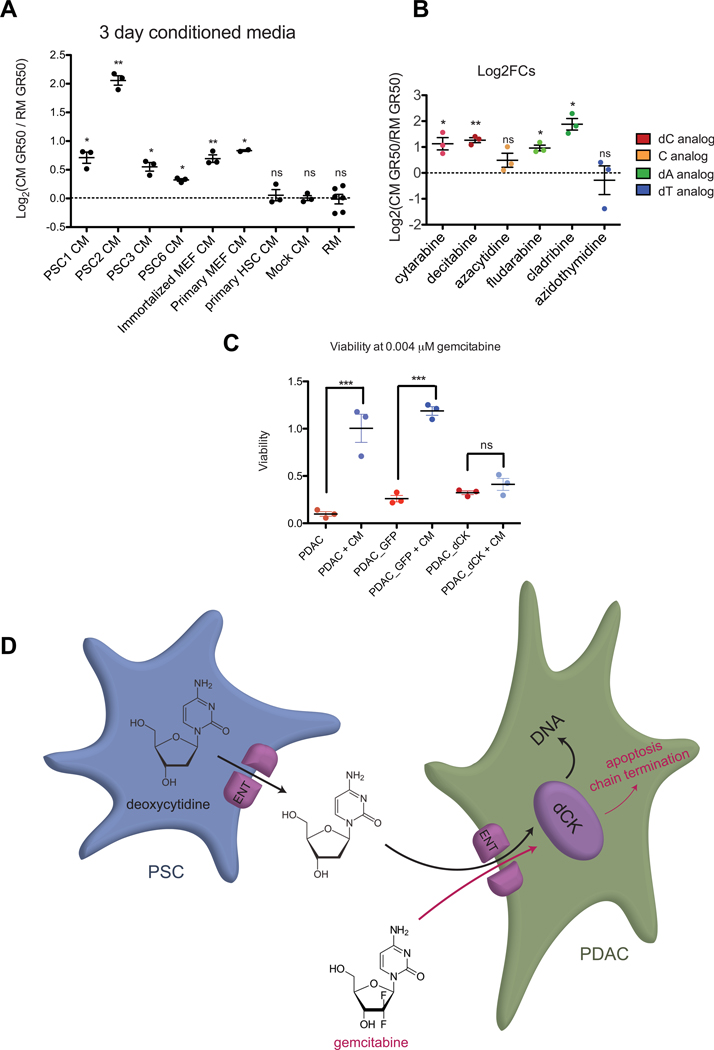
Pancreatic ductal adenocarcinoma (PDAC) is a leading cause of cancer deaths in the United States. The deoxynucleoside analogue gemcitabine is among the most effective therapies to treat PDAC, however, nearly all patients treated with gemcitabine either fail to respond or rapidly develop resistance. One hallmark of PDAC is a striking accumulation of stromal tissue surrounding the tumor, and this accumulation of stroma can contribute to therapy resistance. To better understand how stroma limits response to therapy, we investigated cell-extrinsic mechanisms of resistance to gemcitabine. Conditioned media from pancreatic stellate cells (PSC), as well as from other fibroblasts, protected PDAC cells from gemcitabine toxicity. The protective effect of PSC-conditioned media was mediated by secretion of deoxycytidine, but not other deoxynucleosides, through equilibrative nucleoside transporters. Deoxycytidine inhibited the processing of gemcitabine in PDAC cells, thus reducing the effect of gemcitabine and other nucleoside analogues on cancer cells. These results suggest that reducing deoxycytidine production in PSCs may increase the efficacy of nucleoside analog therapies. SIGNIFICANCE: This study provides important new insight into mechanisms that contribute to gemcitabine resistance in PDAC and suggests new avenues for improving gemcitabine efficacy.


Figures

Fig. 1.
Fig. 1.
PSC2s secrete a small metabolite that causes PDAC resistance to gemcitabine. (A) Schematic of generating conditioned media and testing its effect on gemcitabine toxicity. (B) Gemcitabine dose response curves on PDAC cells supplemented with the indicated percentage of PSC2 CM harvested after 3 days in culture. Three biological replicates are shown. (C) Log2 of the gemcitabine GR50 fold change induced by supplementing the indicated percentage of PSC2 CM produced for the indicated number of days. Data show three biological replicates ± SEM. (D) Log2 fold changes of gemcitabine GR50s on PDAC cells supplemented with 3-day PSC2 CM treated as indicated. Data show three biological replicates ± SEM. ns – not significant (one-way ANOVA).
Fig. 2.
Fig. 2.
Deoxycytidine is present in PSC2 CM and is sufficient to protect PDAC cells from gemcitabine toxicity. (A) Viability of PDAC cells treated with 0.02 μM gemcitabine and the indicated HPLC fraction of regular media (RM), 3-day 293T CM, or 3-day PSC2 CM. (B) A scatterplot of ion counts of 150 metabolites in fraction 4 of RM vs. 3-day PSC2 CM (top) and 3-day 293T CM vs. 3-day PSC2 CM (bottom). (C) Quantification of deoxycytidine in RM, 3 day 293T CM, and 3-day PSC2 CM. Data show three biological replicates ± SEM. *, P ≤ 0.05, ***, P ≤ 0.001 (one-way ANOVA with Bonferroni post-tests) (D) Dose response curves with the indicated nucleosides without (solid lines) or with (dashed lines) 0.025 μM gemcitabine. The viability of 20% 3-day PSC2 CM is also shown. Data show three biological replicates.
Fig. 3.
Fig. 3.
PSC2s produce and secrete deoxycytidine at higher levels than other nucleosides. (A) Absolute quantification of the indicated species in 3-day PSC2 CM. Data show 3 biological replicates ± SEM. Undetected species are indicated by “n.d.”. ***, P ≤ 0.001 (one-way ANOVA with Bonferroni post-tests) (B) Absolute quantification of the indicated species in PSC2 extracts after producing CM for 3 days. Data show 3 biological replicates ± SEM. ***, P ≤ 0.001 (one-way ANOVA with Bonferroni post-tests) (C) Relative quantification of gemcitabine within PDAC cells after the indicated treatment. Data show 3 biological replicates ± SEM. ns, not significant (one-way ANOVA with Bonferroni post-tests) (D) Absolute quantification of dCTP within PDAC cells after the indicated treatment. Data show 3 biological replicates ± SEM. ***, P ≤ 0.001 (two-sample T-test)
Fig. 4.
Fig. 4.
PSC2s secrete dC through ENTs. (A) The deoxycytidine concentration in 3-day CM from PSC2s treated with 6.67 μM of the indicated ENT inhibitors is shown. Data show 3 biological replicates ± SEM. **, P ≤ 0.01, ***, P ≤ 0.001 (one-way ANOVA with Bonferroni post-tests). (B) Gemcitabine dose response curves of PDAC cells supplemented with PSC2 conditioned media made in the presence of the indicated ENT inhibitor. Data show three biological replicates ± SEM. *, P ≤ 0.05, ***, P ≤ 0.001 (one-way ANOVA with Bonferroni post-tests).
Fig. 5.
Fig. 5.
Other PSCs and MEFs protect PDACs from gemcitabine toxicity, and CM is active against other nucleoside analogs. (A) The log2 fold change in gemcitabine GR50 after treatment with 3-day CM from the indicated cell line is plotted. Data show at least three biological replicates ± SEM. *, P ≤ 0.05, **, P ≤ 0.01, ns, not significant (two-tailed one sample t-test). (B) Log2 fold changes of GR50s of the indicated nucleoside analog drugs supplemented with 3-day PSC2 CM. Data show three biological replicates ± SEM. *, P ≤ 0.05, **, P ≤ 0.01 (two-tailed one sample t-test). (C) Viability of the indicated cell lines at 0.004 μM gemcitabine with or without CM supplementation. Data show three biological replicates ± SEM. ***, P ≤ 0.001, ns, not significant (one-way ANOVA with Bonferroni post-tests). (D) Diagram of proposed model. PSCs produce and secrete deoxycytidine through ENTs. Gemcitabine and deoxycytidine are transported into PDACs through ENTs and compete for phosphorylation by dCK.

References

    1. Kleeff J, Korc M, Apte M, La Vecchia C, Johnson CD, Biankin AV, et al., Pancreatic cancer. Nat. Rev. Dis. Prim 2, 1–23 (2016). - PubMed
    1. Rahib L, Smith BD, Aizenberg R, Rosenzweig AB, Fleshman JM, Matrisian LM, Projecting cancer incidence and deaths to 2030: The unexpected burden of thyroid, liver, and pancreas cancers in the united states. Cancer Res. 74, 2913–2921 (2014). - PubMed
    1. Institute NC, Surveillance, Epidemiology, and End Results (SEER) Program Populations (1969–2015). DCCPS, Surveill. Res. Progr (2017), (available at https://seer.cancer.gov).
    1. Jacobetz MA, Chan DS, Neesse A, Bapiro TE, Cook N, Frese KK, et al., Hyaluronan impairs vascular function and drug delivery in a mouse model of pancreatic cancer. Gut. 62, 112–120 (2013). - PMC - PubMed
    1. Olive KP, a Jacobetz M, Davidson CJ, Gopinathan A, McIntyre D, Honess D, et al., Inhibition of Hedgehog Signaling Enhances Delivery of Chemotherapy in a Mouse Model of Pancreatic Cancer. Science (80-. ). 324, 1457–1461 (2009). - PMC - PubMed

Publication types

MeSH terms