Review
. 2019 Sep 4;83(4):e00014-19.
doi: 10.1128/MMBR.00014-19. Print 2019 Nov 20.

Pasteurella multocida: Genotypes and Genomics

Affiliations
Review

Pasteurella multocida: Genotypes and Genomics

Zhong Peng et al. Microbiol Mol Biol Rev. .

Abstract

Pasteurella multocida is a highly versatile pathogen capable of causing infections in a wide range of domestic and wild animals as well as in humans and nonhuman primates. Despite over 135 years of research, the molecular basis for the myriad manifestations of P. multocida pathogenesis and the determinants of P. multocida phylogeny remain poorly defined. The current availability of multiple P. multocida genome sequences now makes it possible to delve into the underlying genetic mechanisms of P. multocida fitness and virulence. Using whole-genome sequences, the genotypes, including the capsular genotypes, lipopolysaccharide (LPS) genotypes, and multilocus sequence types, as well as virulence factor-encoding genes of P. multocida isolates from different clinical presentations can be characterized rapidly and accurately. Putative genetic factors that contribute to virulence, fitness, host specificity, and disease predilection can also be identified through comparative genome analysis of different P. multocida isolates. However, although some knowledge about genotypes, fitness, and pathogenesis has been gained from the recent whole-genome sequencing and comparative analysis studies of P. multocida, there is still a long way to go before we fully understand the pathogenic mechanisms of this important zoonotic pathogen. The quality of several available genome sequences is low, as they are assemblies with relatively low coverage, and genomes of P. multocida isolates from some uncommon host species are still limited or lacking. Here, we review recent advances, as well as continuing knowledge gaps, in our understanding of determinants contributing to virulence, fitness, host specificity, disease predilection, and phylogeny of P. multocida.

Keywords: Pasteurella multocida; comparative genomic analysis; disease predilection; fitness; host specificity; phylogeny; virulence; whole-genome sequencing.


Figures

FIG 1
FIG 1
Genetic organization of the LPS outer core biosynthesis loci found in 16 LPS serotype strains of Pasteurella multocida. (A) Phylogenetic tree of 16 P. multocida strains with different LPS serotypes, constructed based on the DNA sequences of the LPS outer core biosynthetic genes. The gene organizations of the corresponding P. multocida LPS outer core loci with different LPS serotypes are shown. (B) Comparative analysis of the LPS outer core-encoding loci among different LPS serotypes. Shown are synteny plots of the corresponding LPS serotypes in panel A, visualized by EasyFig 2.2.3 (155). Arrows (cyan) denote the genes and their direction within the locus. Color-coded shading denotes the BLASTn identity of the regions between genomes. The relative position and size (base pairs) of each genotype-specific PCR amplicon are shown as bars above each LPS outer core biosynthesis locus.
FIG 2
FIG 2
Distribution of the main virulence genes found among P. multocida isolates of different genotypes and/or from different host species. Shown is the phylogenetic relationship of 49 P. multocida genome sequences from 12 avian isolates, 17 bovine isolates, 14 swine isolates, and 6 leporine isolates (left dendrogram). Also shown is a heat map of virulence genes (center columns) found among the P. multocida isolates of different genotypes (left column) or from different host species (color-coded in the key). A BLAST score ratio (BSR) analysis was performed on these virulence genes. The presence of a virulence gene in a genome was determined based upon the BSR analysis with a normalized ratio of ≥0.8 (156).
FIG 3
FIG 3
Heat map showing the capsular:LPS:RIRDC MLST genotypes of P. multocida strains from different host species. Genotyping was performed by using the whole-genome sequences of 170 P. multocida strains for which host information is available in the NCBI database (as of 31 December 2018). Blocks in shaded color denote the scaled distributions of each genotype among P. multocida isolates from a specific host species.
FIG 4
FIG 4
Comparisons among P. multocida genomes. Shown are results from comparative analyses of the 176 sequenced P. multocida genomes in the NCBI database (as of 31 December 2018). (A) Line charts illustrating whole-genome sizes, average percent G+C content, and numbers of predicted genes and encoded putative proteins. (B) Pie chart showing the host sources (top left), capsular genotypes (top right), LPS genotypes (bottom left), and RIRDC MLST genotypes (bottom right) of the 176 sequenced P. multocida genomes in the NCBI database (as of 31 December 2018).
FIG 5
FIG 5
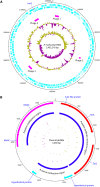
Circle maps of P. multocida HN06 genomes. (A) Circle map of the P. multocida HN06 chromosomal genome (2,402,218 bp) generated using DNA Plotter (157). From the outside ring to the inside ring, circle 1 shows the DNA base position (base pairs), circle 2 (cyan) shows the protein-coding regions transcribed clockwise, circle 3 (cyan) shows the protein-coding regions transcribed anticlockwise, circle 4 (pink) shows predicted prophages, circle 5 shows the G+C content, and circle 6 shows the GC skew. (B) Circle map of the P. multocida HN06 plasmid genome (5,360 bp) generated using DNA Plotter. From the outside ring to the inside ring, circle 1 shows the DNA base position (base pairs); circle 2 (arrows in different colors) shows the protein-coding regions (cyan arrows, putative proteins involved in plasmid replication; purple arrows, putative proteins involved in plasmid mobilization; red arrows, putative proteins involved in antibiotic resistance); circle 3 (blue) shows areas involved in plasmid replication, plasmid mobilization, and antibiotic resistance; circle 4 shows the G+C content; and circle 5 shows the GC skew.
FIG 6
FIG 6
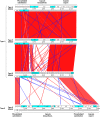
Comparative analysis of capsule-encoding loci among different capsule types visualized by ACT. Shown are Artemis plots (158) of the genomes of type A (HB03), type F (HN07), type D (HN07), and type B (HN04) strains. Arrows (cyan) denote the genes and their direction within the locus. Color-coding denotes the BLASTn identity of these regions between genomes. The red lines (oriented in the same direction) and/or blue lines (oriented in the reverse direction) between the genomes represent DNA-DNA similarities (BLASTn matches) between the two sequences.
FIG 7
FIG 7
Genetic organization and colinearity of the tad locus among selected Pasteurella multocida strains. Shown are synteny plots for the tad loci of P. multocida strains HN06, HB03, PM70, and 36950, visualized by using EasyFig 2.2.3 (155). Cyan arrows denote the genes and their direction within the loci; gray arrows denote genes with frameshifts.
FIG 8
FIG 8
Genome of a toxigenic Pasteurella multocida strain HN06 phage carrying the PMT-encoding gene. Shown is a circular map of the P. multocida strain HN06 carrying an intact toxA gene-containing prophage, generated by using DNA Plotter (157). From the outside to the inside rings, circle 1 shows the DNA base position (base pairs), circle 2 (arrows in different colors) shows the protein-coding regions, circle 3 shows the G+C content, and circle 4 shows the GC skew.
FIG 9
FIG 9
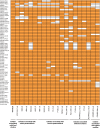
Heat map showing the presence of putative OMP-encoding genes among P. multocida isolates associated with different diseases in different hosts. Conserved genes (shown in orange) were determined using BLASTn with an identity of ≥80% plus alignment coverage of ≥80% and an E value of 1e−6 as the cutoff.
FIG 10
FIG 10
Colinearity of the representative genome sequences of selected isolates of different serogroups/genotypes from swine. Shown are genome alignments for P. multocida strains HB03 (type A), HN03 (type B), HN05 (type D), and HN07 (type F), generated using the progressiveMauve program (159). Rectangles of similar colors show colinear blocks of genes. In the HN04 and HN05 panels, the top colored blocks labeled “+” indicate genes oriented in the same direction as in the HB03 genome, while blocks labeled “−” indicate genes oriented in the reverse direction. Areas of low identity within the colinear blocks are shown by a reduced height of shading.
FIG 11
FIG 11
Colinearity of toxigenic versus nontoxigenic Pasteurella multocida strains. Shown are genome sequence alignments of toxigenic P. multocida strain HN06 (top) and nontoxigenic strain HN05 (bottom), generated using the progressiveMauve program (159). Rectangles of similar colors show colinear blocks of genes. In the HN05 panel, the top colored blocks labeled “+” indicate genes oriented in the same direction as in the HN06 genome, while blocks labeled “−” indicate genes oriented in the opposite direction. Areas of low identity within the colinear blocks are shown by reduced shading.
FIG 12
FIG 12
Comparative genomics of toxigenic and selected nontoxigenic strains of Pasteurella multocida from swine. Shown are circular maps of genome sequences of P. multocida isolates from swine, generated using the BRIG package (160). Alignments include a toxigenic strain (HN06) and nontoxigenic strains (3480, NTCC10322, ATCC 43137, HN05, HN07, PM8-1, HN04, SH01, SH02, SH03, SH04, and SH05). DNA identities between each of the genome sequences are shown. The functions of the regions displaying low identities between different genome sequences are marked as bars at the outermost circle. Most genes within the areas marked by the black bar encode hypothetical proteins.
FIG 13
FIG 13
Colinearity of representative genomes of Pasteurella multocida subspecies. Shown are genome alignments of P. multocida subsp. multocida (C48-1), P. multocida subsp. gallicida (P1059), and P. multocida subsp. septica (HB02), using the progressiveMauve program (159). Rectangles of similar colors show colinear blocks of genes. In the panels for strains C48-1 and HB02, the top colored blocks labeled “+” indicate genes oriented in the same direction as in the P1059 genome, while blocks labeled “−” indicate genes oriented in the opposite direction. Areas of low identity within the colinear blocks are shown by reduced shading.
FIG 14
FIG 14
Comparative sequence analysis of ICEhin1056 and ICEpmcn07. Shown is a synteny plot of ICEhin1056 and ICEpmcn07, visualized by using EasyFig 2.2.3 (155). Arrows represent genes and their orientations within the genomic islands. Blocks with different color gradients show DNA identities between the two sequences. Arrows with the indicated colors refer to genes involved in different functions.
FIG 15
FIG 15
Comparative genomics of sequenced Pasteurella plasmids. The genome sequences that were compared using the BRIG package (160) included the plasmids listed in Table 4. DNA identities between each of the genome sequences are shown. The functions of the regions displaying low identities between different genome sequences are marked as bars at the outermost circle.
FIG 16
FIG 16
Phylogenetic relationship tree of selected P. multocida isolates with different serotypes/genotypes from different host species. The tree was generated using single nucleotide variants across the whole-genome sequences of 82 P. multocida strains (accession numbers are given in Table S2 in the supplemental material). Strains of different capsular serotypes/genotypes are located on branches and denoted by different colors (red, type A; dark green, type B; blue, type D; light green, type F). Strains from different hosts are marked in different colors (blue, avian isolates; purple, bovine isolates; orange, porcine isolates; dark green, leporine isolates). The outmost ring gives the LPS:MLST genotypes of each clade. The stars denote bootstrap values within the range of 0.103 to 1.000.

References

    1. Pasteur L. 1880. De l’attenuation du virus du cholera des poules. C R Acad Sci 91:673–680.
    1. Wilkie IW, Harper M, Boyce JD, Adler B. 2012. Pasteurella multocida: diseases and pathogenesis. Curr Top Microbiol Immunol 361:1–22. doi:10.1007/82_2012_216. - DOI - PubMed
    1. Wilson BA, Ho M. 2013. Pasteurella multocida: from zoonosis to cellular microbiology. Clin Microbiol Rev 26:631–655. doi:10.1128/CMR.00024-13. - DOI - PMC - PubMed
    1. Boyce JD, Harper M, Wilkie IW, Adler B. 2010. Pasteurella, p 325–346. In Gyles CL, Prescott JF, Songer JG, Thoen CO (ed), Pathogenesis of bacterial infections in animals, 4th ed Wiley-Blackwell, Ames, IA.
    1. Mutters R, Ihm P, Pohl S, Frederiksen W, Mannheim W. 1985. Reclassification of the genus Pasteurella Trevisan 1887 on the basis of deoxyribonucliec acid homology, with proposals for the new species Pasteurella dagmatis, Pasteurella canis, Pasteurella stomatis, Pasteurella anatis, and Pasteurella langaa. Int J Syst Bacteriol 35:309–322. doi:10.1099/00207713-35-3-309. - DOI

Publication types

Substances

LinkOut - more resources