. 2019 Oct 18;294(42):15480-15494.
doi: 10.1074/jbc.RA119.008318. Epub 2019 Sep 4.

The SH3 domains of the protein kinases ITK and LCK compete for adjacent sites on T cell-specific adapter protein

Affiliations

The SH3 domains of the protein kinases ITK and LCK compete for adjacent sites on T cell-specific adapter protein

Thorny Cesilie Bie Andersen et al. J Biol Chem. .

Abstract

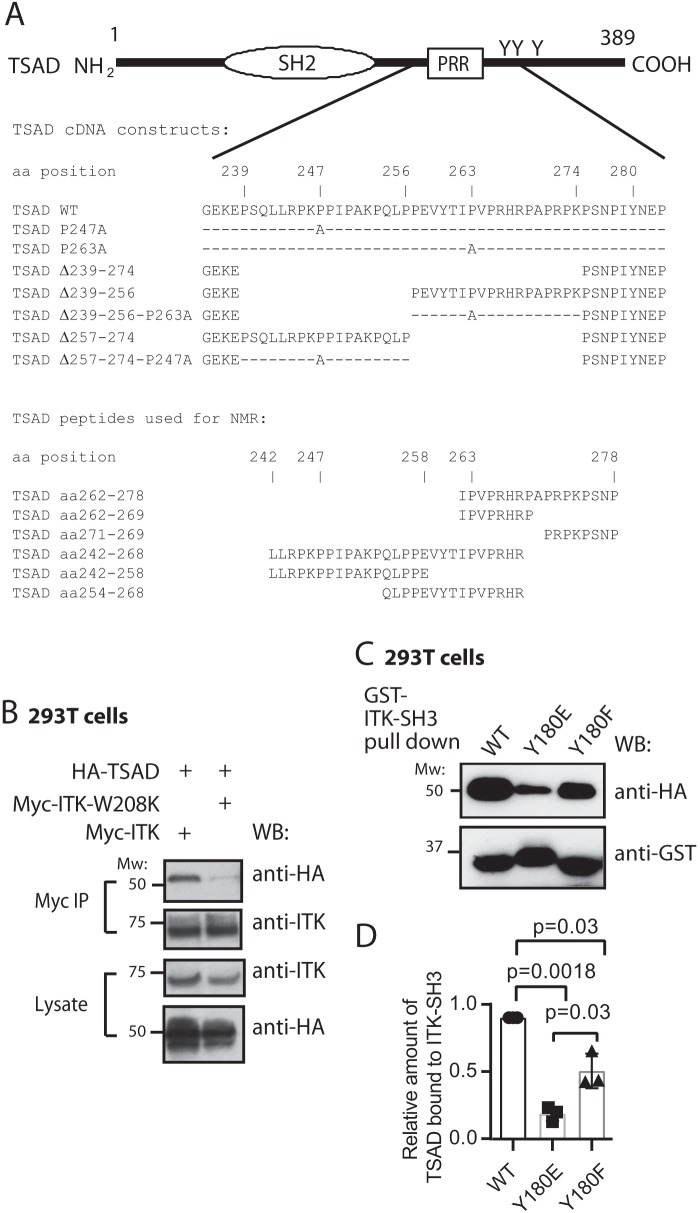
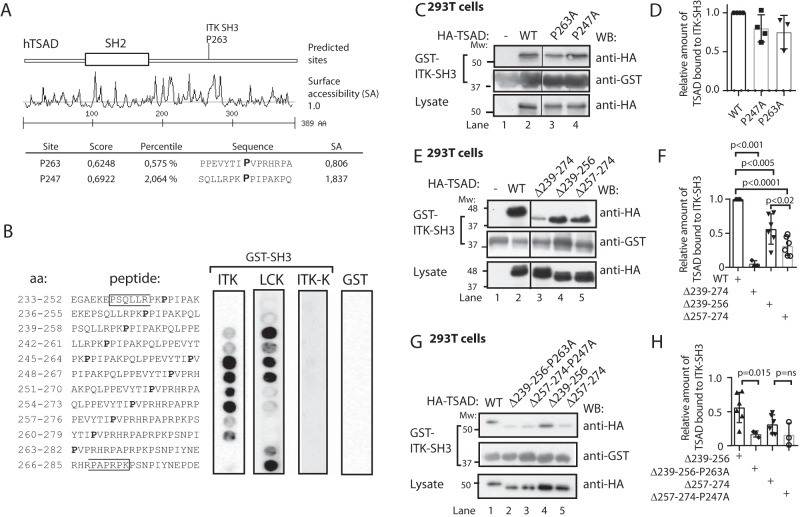
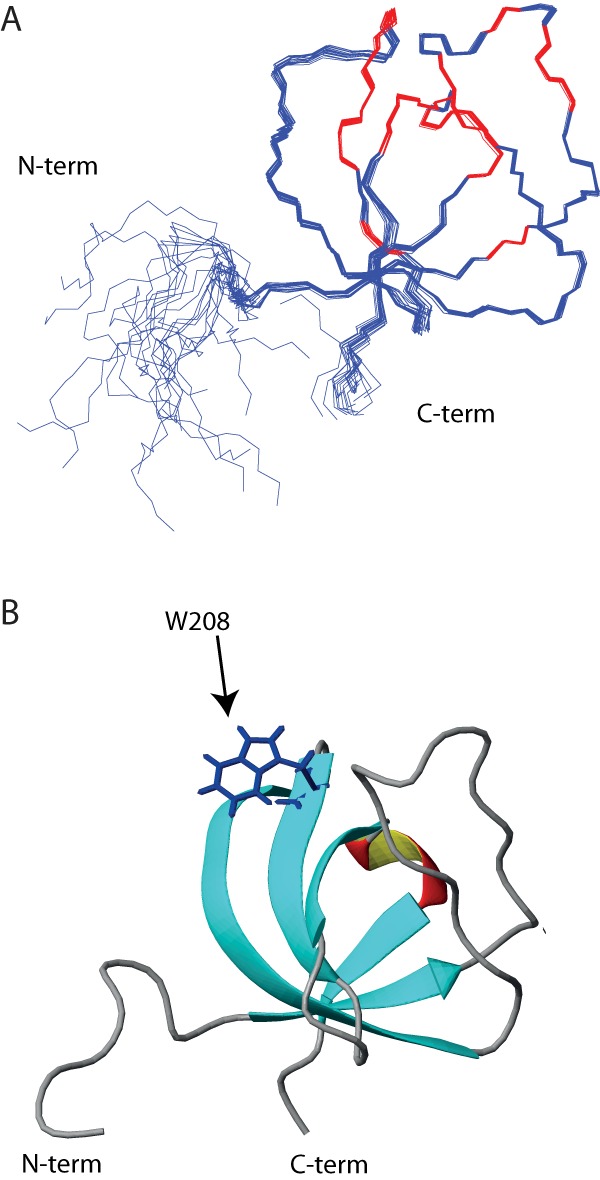
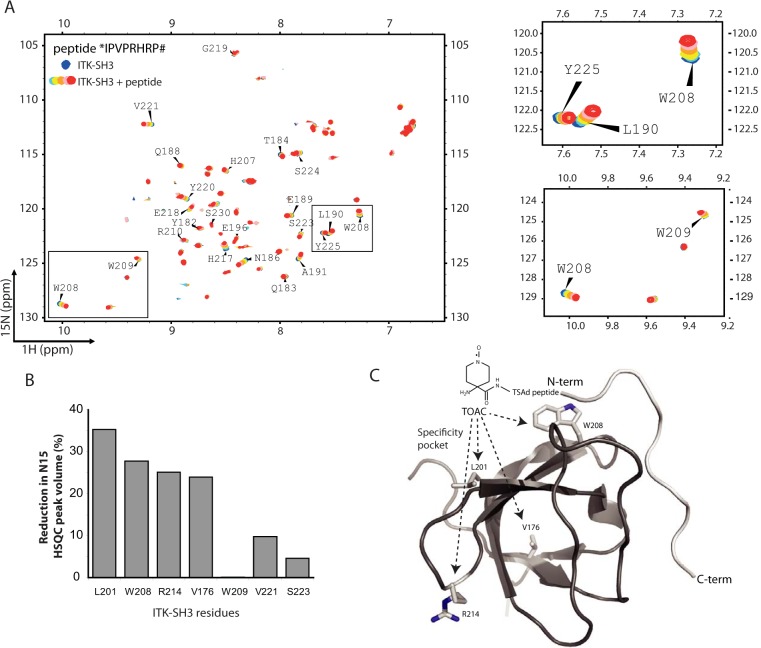
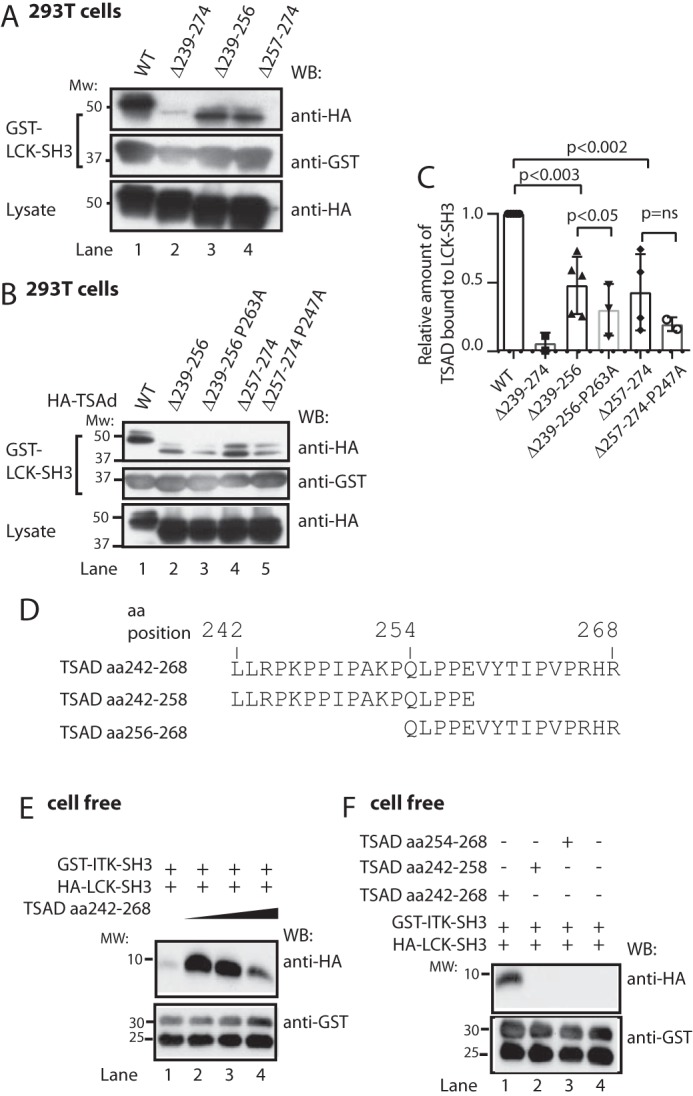
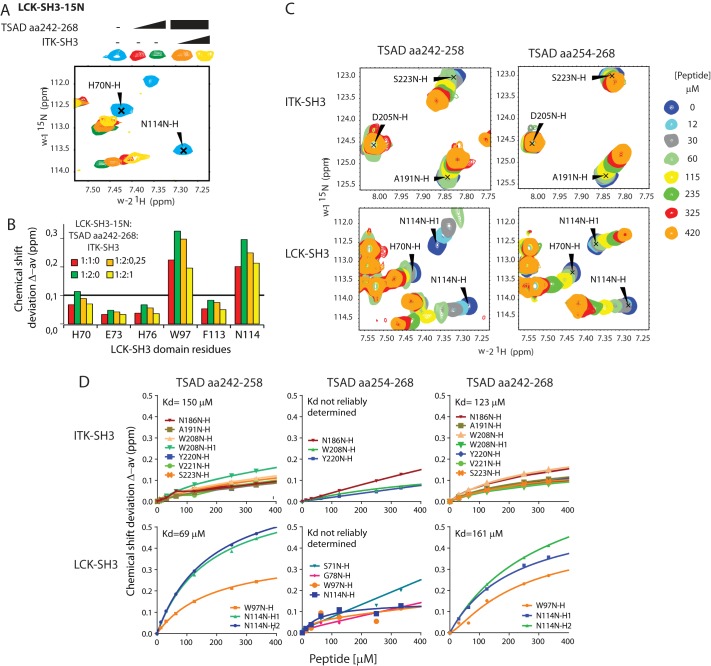
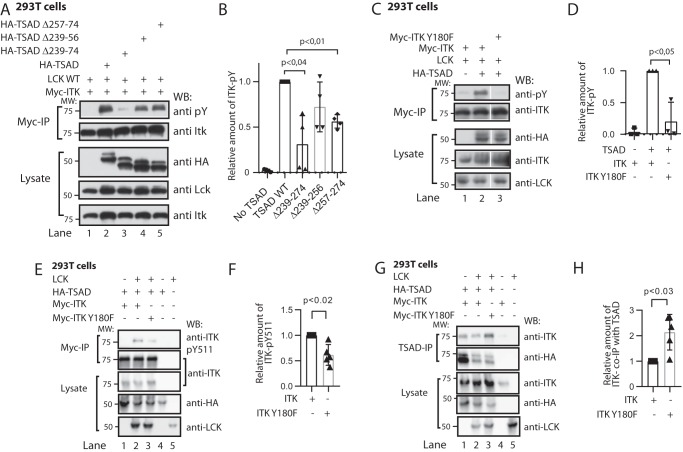
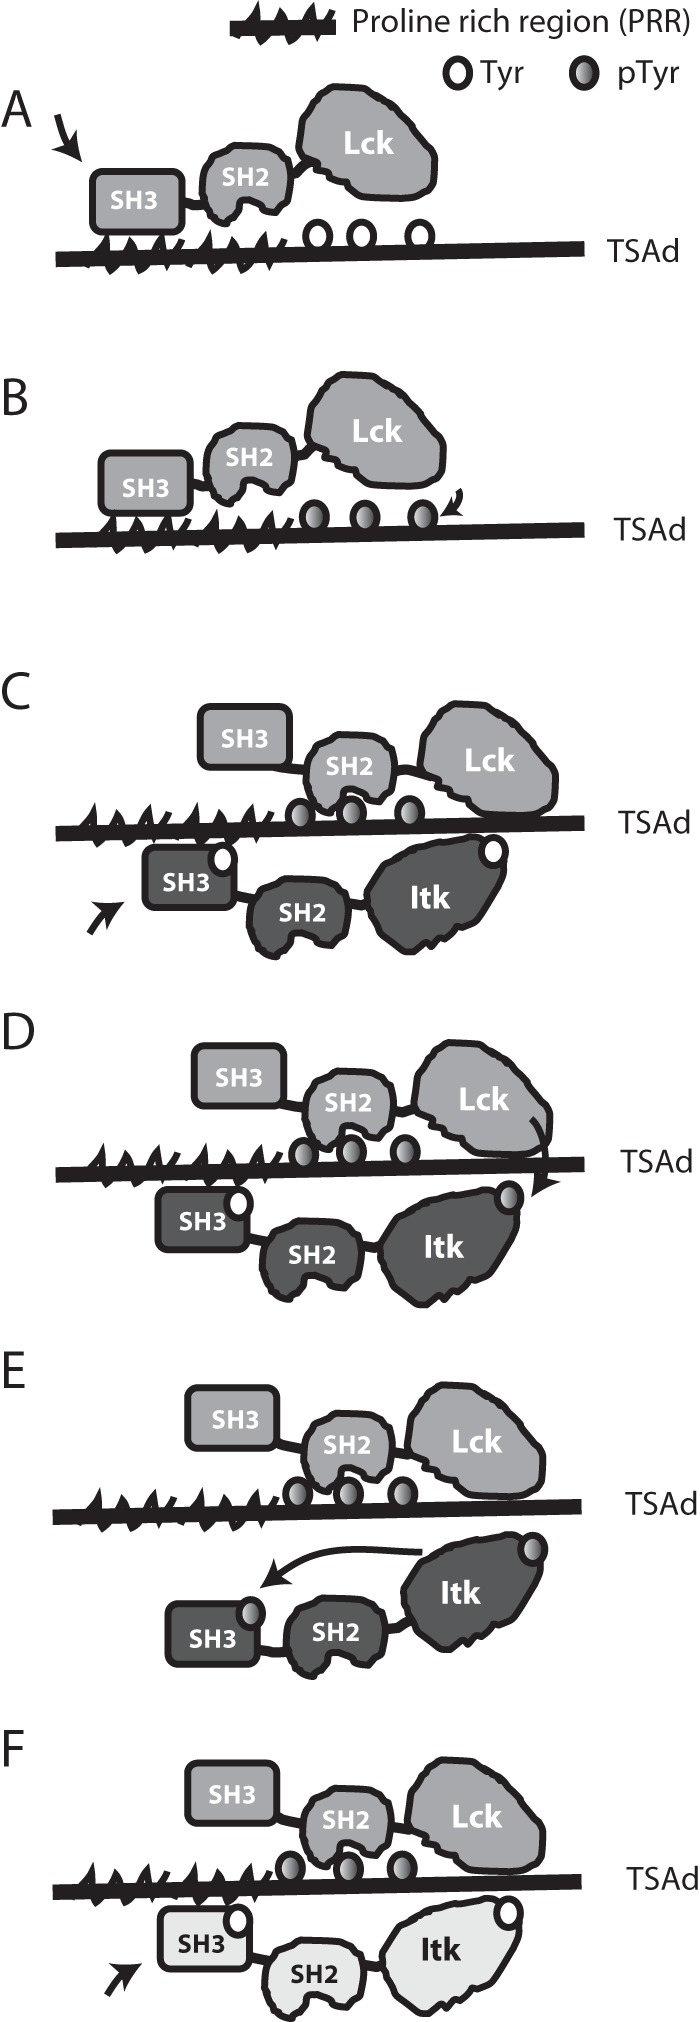
T-cell activation requires stimulation of specific intracellular signaling pathways in which protein-tyrosine kinases, phosphatases, and adapter proteins interact to transmit signals from the T-cell receptor to the nucleus. Interactions of LCK proto-oncogene, SRC family tyrosine kinase (LCK), and the IL-2-inducible T cell kinase (ITK) with the T cell-specific adapter protein (TSAD) promotes LCK-mediated phosphorylation and thereby ITK activation. Both ITK and LCK interact with TSAD's proline-rich region (PRR) through their Src homology 3 (SH3) domains. Whereas LCK may also interact with TSAD through its SH2 domain, ITK interacts with TSAD only through its SH3 domain. To begin to understand on a molecular level how the LCK SH3 and ITK SH3 domains interact with TSAD in human HEK293T cells, here we combined biochemical analyses with NMR spectroscopy. We found that the ITK and LCK SH3 domains potentially have adjacent and overlapping binding sites within the TSAD PRR amino acids (aa) 239-274. Pulldown experiments and NMR spectroscopy revealed that both domains may bind to TSAD aa 239-256 and aa 257-274. Co-immunoprecipitation experiments further revealed that both domains may also bind simultaneously to TSAD aa 242-268. Accordingly, NMR spectroscopy indicated that the SH3 domains may compete for these two adjacent binding sites. We propose that once the associations of ITK and LCK with TSAD promote the ITK and LCK interaction, the interactions among TSAD, ITK, and LCK are dynamically altered by ITK phosphorylation status.

Keywords: IL-2-inducible T cell kinase (ITK); LCK proto-oncogene SRC family tyrosine kinase; NMR; SH2D2A; Src homology 3 domain (SH3 domain); T cell-specific adapter protein (TSAD); T-cell; adaptor protein; cell signaling; immunity; nuclear magnetic resonance; protein kinase; protein phosphorylation; protein structure; protein-protein interaction; tyrosine-protein kinase.


Conflict of interest statement

The authors declare that they have no conflicts of interest with the contents of this article

Figures

Figure 1.
Figure 1.
Nonphosphorylated ITK SH3 domain is required for ITK binding to TSAD. A, schematic drawing of TSAD including the SH2 domain, the PRR and the three C-terminal tyrosines. The core sequences encoded by the TSAD cDNA constructs and the TSAD peptides used for transfection of cells and for NMR experiments, respectively, in this paper are also indicated. B, co-immunoprecipitation experiment showing the dependence of ITK-TSAD interaction on the SH3 domain of ITK. 293T cells were transfected with the indicated cDNA plasmids. Myc-tagged ITK proteins were immunoprecipitated from the cell lysates, followed by immunoblotting with the indicated antibodies. The result is one representative of two experiments. C and D, ITK SH3 domains mutated for Tyr180 display reduced interaction with TSAD. C, pulldown experiment using ITK SH3 domains with the indicated mutations was performed using lysates of 293T cells transiently transfected with HA-tagged WT and mutated TSAD cDNA. Pulled down proteins were immunoblotted with the indicated antibodies. D, the graph represents relative amount of TSAD interacting with ITK SH3 in the experiment shown in C. Signals were quantified by ImageJ analysis (n = 3, mean ± S.D. (error bars)).
Figure 2.
Figure 2.
LCK SH3 and ITK SH3 bind to overlapping peptides in TSAD PRR. A, Scansite prediction of ITK SH3-binding sites on TSAD. B, peptide array mapping of LCK SH3- and ITK SH3-binding sites on TSAD. The amino acid sequence of the peptide in each of the spots is given to the left. The right panels show the results of probing the arrays with the indicated recombinant proteins GST-ITK SH3, GST-LCK SH3, GST-ITK SH3 mutated (W208K or ITK-K), or GST alone, respectively. Results from 12 of the 14 tested peptides are shown. Pro247 and Pro263 are indicated in boldface type. The brackets define the borders of TSAD aa 239–274. C and D, mutations of the predicted prolines to alanines fail to abolish binding of ITK SH3 to TSAD. The pulldown experiment was performed using GST-ITK SH3 and lysates of 293T cells transiently transfected with HA-tagged WT and mutated TSAD cDNA. Pulled down protein and lysate were immunoblotted with the indicated antibodies. D, the graph represents the relative amount of TSAD interacting with ITK SH3 in the experiment shown in C. Signals were quantified by ImageJ analysis (n = 3, mean ± S.D. (error bars)). E and F, deletion of either the Pro247 (aa 239–256) or the Pro263 (aa 257–274) region reduces binding of ITK SH3 to TSAD. The pulldown experiment was performed as in C. F, the graph represents ImageJ analysis as in D of the data shown in E (n = 3 or 6, mean ± S.D.). G and H, additional mutation of Pro263 further reduces binding of ITK SH3 to TSAD 257–274. The pulldown experiment was performed as in C. H, the graph represents ImageJ analysis as in D of data shown in G. The relative amount of TSAD interacting with ITK SH3 WT in each experiment is set to 1 (not shown) (n = 3, mean ± S.D.).
Figure 3.
Figure 3.
The human ITK SH3 domain solution structure. A, backbone trace of the 20 structures comprising the lowest-energy NMR ensemble is shown. Red color indicates residues affected by ligand binding. B, ribbon representation of one of the ITK SH3 domain structures shown in A. The tryptophan at position 208, which is critical for polyproline ligand binding, is indicated.
Figure 4.
Figure 4.
The human ITK SH3 domain binds to TSAD aa 262–269 in a class I orientation. A, 1H-15N HSQC of human 20 μm ITK SH3 domain without (blue) and with increasing amounts (200 μm to 1 mm, light blue to green-red) of TSAD aa 262–269 (*IPVPRHRP#) added. Chemical shift changes are observed indicating binding of the peptide to the ITK SH3 domain. B, TOAC experiment. HSQC experiments using TSAD aa 262–269 with an N-terminal TOAC aa were performed with and without a reducing agent (ascorbate) added to the solution to remove the effect of the TOAC aa. TOAC aa causes broadening of peaks in the NMR spectrum representing neighboring aa. The graph shows the percentage reduction in peak volume of the four most affected aa (Leu201, Trp208, Arg214, and Val176) in addition to three aa (Trp209, Val221 and Ser223) that the titration experiments had identified to be affected by peptide binding. C, three-dimensional structure of human ITK SH3 domain with the TOAC-labeled TSAD peptide aa 262–269 (light gray) docked onto the SH3 domain using constraints given by the aa most affected by the peptide titration. The N and C termini of the TSAD peptide are labeled N-term and C-term, respectively. The location of Leu201, Trp208, Arg214, and Val176 (resonances most affected by TOAC) are shown on the SH3 structure.
Figure 5.
Figure 5.
LCK SH3 and ITK SH3 may bind simultaneously to TSAD aa 242–268. A–C, LCK SH3 interacts with both TSAD aa 239–256 and aa 257–274. Additional mutation of Pro247 or Pro263 further reduces binding. A and B, pulldown experiment in 293T cells using the same TSAD constructs as in Fig. 2, E and G, respectively. Pulled down proteins and lysates were probed with the indicated antibodies. C, the graph represents ImageJ analysis of data shown in A and B (n = 3, mean ± S.D. (error bars)). D, sequences of custom synthesized TSAD peptides aa 242–268, 242–256, and 254–268. E, in vitro pulldown experiment using a 10 μm concentration of each SH3 domain and increasing amounts of TSAD aa 242–268 (10, 20, and 40 μm) in a total volume of 100 μl. The GST-ITK SH3 domain was added while attached to glutathione SepharoseTM beads. To eliminate bead loss, a 4-fold amount of GST-glutathione SepharoseTM beads was added to the mixture, as is evidenced from the bottom panel. F, in vitro pulldown experiment performed as in D, using a 10 μm concentration of each SH3 domain, and a 10 μm concentration of the indicated TSAD peptides. WB, Western blot.
Figure 6.
Figure 6.
ITK SH3 competes with LCK SH3 for binding to TSAD aa 242–268. A, chemical shift deviations of selected residues in HSQC titration experiments performed with 15N-labeled LCK SH3 (initially 0.25 mm) in the presence of increasing concentration of TSAD aa 242–268 (0.25 mm (red) and 0.5 mm (green)) followed by increasing amounts of nonlabeled ITK SH3 (orange, yellow). B, chemical shift deviations of selected LCK residues from the HSQC experiment depicted in A (at 1:2:0.25, concentrations of LCK SH3, TSAD peptide, and ITK SH3 were 0.2, 0.4, and 0.04 mm respectively, whereas at 1:2:1, the corresponding concentrations were 0.1, 0.2, and 0.1 mm). C, chemical shift deviations of selected residues in HSQC titration experiments performed with 15N-labeled LCK SH3 and ITK SH3 added to the same NMR tube in the presence of increasing concentration of TSAD aa 242–258 or TSAD aa 254–268 peptide. D, titration curves for the indicated peptides based on HSQC shifts of selected amino acid signals from the indicated SH3 domains.
Figure 7.
Figure 7.
Association followed by dissociation of ITK to TSAD PRR is required for maximal phosphorylation of ITK in the presence of LCK. A, immunoprecipitation experiment showing phosphorylation of ITK in the absence or presence of intact or mutated TSAD molecules. 293T cells were transfected with the indicated cDNA plasmids. Myc-tagged ITK proteins were immunoprecipitated from the cell lysates, and the level of phosphorylation was assessed by immunoblotting. The result is one representative of two experiments. B, the graph shows quantitation of signal densities using ImageJ of the experiment shown in A (n = 4, mean ± S.D. (error bars)). C and D, immunoprecipitation experiments as in A, including also a Myc-ITK-Y180F mutant (n = 3, mean ± S.D.). E–G, immunoprecipitation experiments in 293T cells expressing the indicated plasmids immunoblotted with the indicated antibodies. F, graph shows quantitation of signal densities using ImageJ of the experiment shown in E and shows the relative amount of pTyr511 signal where the pTyr511 signal in ITK is set to 1 (n = 5, mean ± S.D.). H, the graph shows quantitation of signal densities using ImageJ of the experiment shown in G and shows the relative amount of ITK co-immunoprecipitated with TSAD (n = 5, mean ± S.D.).
Figure 8.
Figure 8.
Schematic representation of TSAD-ITK-LCK interactions and their putative sequence. A, open LCK binds to TSAD PRR and becomes activated. B, active LCK phosphorylates the three TSAD C-terminal tyrosines. C, the LCK SH2 domain binds to TSAD pTyr, allowing LCK SH3 to detach from TSAD PRR. ITK binds to TSAD PRR. D, active LCK phosphorylates ITK Tyr511. E, active ITK pTyr511 autophosphorylates ITK Tyr180. ITK pTyr180 does not bind to TSAD PRR. F, active LCK remains bound to TSAD pTyr. Next, the ITK molecule (indicated in a different color) binds to TSAD PRR, and the process starts over from D.

Similar articles

Cited by

References

    1. Koretzky G. A., and Myung P. S. (2001) Positive and negative regulation of T-cell activation by adaptor proteins. Nat. Rev. Immunol. 1, 95–107 10.1038/35100523 - DOI - PubMed
    1. Mustelin T., and Taskén K. (2003) Positive and negative regulation of T-cell activation through kinases and phosphatases. Biochem. J. 371, 15–27 10.1042/bj20021637 - DOI - PMC - PubMed
    1. Felices M., Falk M., Kosaka Y., and Berg L. J. (2007) Tec kinases in T cell and mast cell signaling. Adv. Immunol. 93, 145–184 10.1016/S0065-2776(06)93004-1 - DOI - PubMed
    1. Spurkland A., Brinchmann J. E., Markussen G., Pedeutour F., Munthe E., Lea T., Vartdal F., and Aasheim H. C. (1998) Molecular cloning of a T cell-specific adapter protein (TSAD) containing an Src homology (SH) 2 domain and putative SH3 and phosphotyrosine binding sites. J. Biol. Chem. 273, 4539–4546 10.1074/jbc.273.8.4539 - DOI - PubMed
    1. Granum S., Sundvold-Gjerstad V., Dai K. Z., Kolltveit K. M., Hildebrand K., Huitfeldt H. S., Lea T., and Spurkland A. (2006) Structure function analysis of SH2D2A isoforms expressed in T cells reveals a crucial role for the proline rich region encoded by SH2D2A exon 7. BMC. Immunol. 7, 15 10.1186/1471-2172-7-15 - DOI - PMC - PubMed

Publication types

MeSH terms

Substances

LinkOut - more resources