. 2019 Oct 1;203(7):1715-1729.
doi: 10.4049/jimmunol.1900549. Epub 2019 Sep 4.

Targeting Antigens to CD180 but Not CD40 Programs Immature and Mature B Cell Subsets to Become Efficient APCs

Affiliations

Targeting Antigens to CD180 but Not CD40 Programs Immature and Mature B Cell Subsets to Become Efficient APCs

Kelsey Roe et al. J Immunol. .

Abstract

Targeting Ags to the CD180 receptor activates both B cells and dendritic cells (DCs) to become potent APCs. After inoculating mice with Ag conjugated to an anti-CD180 Ab, B cell receptors were rapidly internalized. Remarkably, all B cell subsets, including even transitional 1 B cells, were programed to process, present Ag, and stimulate Ag-specific CD4+ T cells. Within 24-48 hours, Ag-specific B cells were detectable at T-B borders in the spleen; there, they proliferated in a T cell-dependent manner and induced the maturation of T follicular helper (TFH) cells. Remarkably, immature B cells were sufficient for the maturation of TFH cells after CD180 targeting: TFH cells were induced in BAFFR-/- mice (with only transitional 1 B cells) and not in μMT mice (lacking all B cells) following CD180 targeting. Unlike CD180 targeting, CD40 targeting only induced DCs but not B cells to become APCs and thus failed to efficiently induce TFH cell maturation, resulting in slower and lower-affinity IgG Ab responses. CD180 targeting induces a unique program in Ag-specific B cells and to our knowledge, is a novel strategy to induce Ag presentation in both DCs and B cells, especially immature B cells and thus has the potential to produce a broad range of Ab specificities. This study highlights the ability of immature B cells to present Ag to and induce the maturation of cognate TFH cells, providing insights toward vaccination of mature B cell-deficient individuals and implications in treating autoimmune disorders.


Figures

Figure 1.
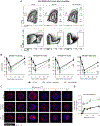
Figure 1.. The Ag-specific BCR is internalized rapidly following targeting to CD180.
B1-8hi mice were inoculated with 50μg NP-Iso, NP-Iso + αCD180 or NP-αCD180. Three, six or 25 h later, spleens were harvested and processed for flow cytometry. (A) Representative flow plots of total live, single, B220+ cells three h after inoculation. The top panel demonstrates the gating strategy we used to identify different splenic B cell subsets. After gating out debris, doublets and dead cells, B220+ B cell subsets were evaluated using CD21 and CD24 expression. Transitional (T)1 B cells were defined as CD24hi, CD21lo; T2 as CD24hi, CD21mid; follicular (FO) as CD24mid, CD21mid; marginal zone (MZ) as CD24hi, CD21hi. The bottom panel demonstrates the change in NP-BCR expression following inoculation. (B) NP-BCRhi expressing cells per spleen following inoculation in different B220+ splenic B cell subsets. Data is the mean ± SEM combined of two to three experiments per time point with n=4-8 per group. (C,D) In vitro internalization assay in the NP-specific BCR expressing K46 B cell line. Cells were incubated with fluorescently conjugated NP conjugates and internalization was evaluated using the ImageStream flow cytometer and Ideas software. Data is representative of three individual experiments. * p<0.05 and ** p<0.01 NP-Iso vs. NP-αCD180. † p<0.05, ‡ p<0.01 NP-Iso + αCD180 vs. NP-αCD180 by Kruskal-Wallis test with Dunn’s multiple comparison test (B) or 2-way ANOVA with Tukey’s multiple comparison test (D).
Figure 2.
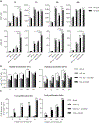
Figure 2.. Targeting Ags to CD180 results in Ag processing and presentation by B cells.
(A) B1-8hi mice were inoculated with 50μg NP-Iso, NP-Iso + αCD180 or NP-αCD180. 24 h later, the expression of MHC II and CD86 was evaluated on NP-BCR and NP-BCR+ splenic B cells by flow cytometry. Data is the mean ± SEM representative of two independent experiments with n=3-4 per group. (B) B10.A mice were inoculated with 35μg HEL-Iso, HEL-Iso + αCD180 or HEL-αCD180. Three or 24 h later HEL-peptide bound-MHC II I-Ak, represented as peptide bound MHC II over total MHC II expression (HEL-I-Ak/I-Ak MFI) was evaluated on splenic B cell subsets and conventional (c)DCs by flow cytometry. cDCs were defined as B220, CD3, NK1.1, CD11b−/lo, CD11chi. Data is the mean ± SEM representative of two independent experiments per time point with n=3-4 per group. (C) C57BL/6 mice were inoculated with 35μg OVA-Iso, OVA-Iso + αCD180 or OVA-αCD180. Three or 24 h later DCs were isolated from spleen by positive bead selection, B cells were isolated by negative bead enrichment and B cell subsets were sorted by FACS. 1×10⁵ APCs were co-cultured with 1×10^5 CFSE-labeled OT-II T cells. Three days later, T cell proliferation was evaluated as CFSE dilution by flow cytometry. Data is the mean ± SEM combined of three experiments per time point with n=1 (Mock, OVA-Iso) or n=6 (OVA-Iso + αCD180 and OVA-αCD180). * p<0.05, ** p<0.01, ***p<0.001, ****p<0.0001 by 2-way ANOVA with Sidak’s multiple comparison test (A), Kruskal-Wallis test with Dunn’s multiple comparison test (B) or Mann-Whitney test (C).
Figure 3.
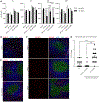
Figure 3.. CD180 Ag targeting induces Ag-specific B cells to migrate to the T-B border region of the spleen.
(A) B1-8hi mice were inoculated with 50μg NP-Iso, NP-Iso + αCD180 or NP-αCD180. 24 h later, the expression of CXCR5 was evaluated on NP-BCR and NP-BCR+ splenic B cells by flow cytometry. Data is the mean ± SEM representative of two independent experiments with n=3-4 per group. * p<0.05, ** p<0.01, ***p<0.001, ****p<0.0001 by 2-way ANOVA with Sidak’s multiple comparison test. (B-E) B cells, enriched from B1-8hi mice, were transferred into WT mice, which were rested overnight and then inoculated with 50μg NP-Iso + αCD180 or NP-αCD180. Spleens were isolated from uninoculated mice (Day 0) or inoculated mice every day for three days. Spleens were cryopreserved, sectioned and stained for NP-BCR, B220, CD3 and Ly6G. Images were acquired by confocal microscopy at 20x objective and are representative of 5 images taken from two sections and two mice per group. (D) Total NP-specific B cells were counted at the border region between the B220 expressing B cell follicle and the CD3 expressing T cell zone from a total of 20 images from 4 sections representing 2 different mice per group.
Figure 4.
Figure 4.. CD180 targeting induces rapid, T cell-dependent Ag-specific B cell proliferation.
Splenic B cells were isolated from B1-8hi (Ly5.1+) mice, labeled with CFSE and transferred into C57BL/6 mice. The next day the mice were inoculated with 50μg NP-Iso, NP-Iso + αCD180 or NP-αCD180 and spleens were harvested three days later for analysis by flow cytometry. (A) Representative flow plots of B220+, Ly5.1+ cells, and data (mean ± SEM) of CFSE diluted, NP-BCR+ cells per spleen. (B) Representative flow plots of B220+, Ly5.1+ cells showing their CD21, CD24 along the axes and either CFSE or NP-BCR expression as a heat map overlay. (C) Total B220+, Ly5.1+ B cell subsets from the spleen. (D) C57BL/6 mice were inoculated with anti-CD4 or an isotype control Ab 5h before B cell adoptive transfer and 24h before NP-Ab inoculation (as above). Three days later B220+, Ly5.1+, NP-BCR+, CFSE diluted cells were examined in the spleen by flow cytometry. Data is mean ± SEM combined from two independent experiments, n=5 per group. * p<0.05, ** p<0.01 by Kruskal-Wallis test with Dunn’s multiple comparison test.
Figure 5.
Figure 5.. CD180 targeting induces rapid TFH cell maturation.
(A) C57BL/6 (WT) mice were inoculated with 25μg OVA-Iso + αCD180 or OVA-αCD180; 3d later OVA-tetramer-specific cells were isolated from splenocytes by magnetic bead enrichment. Total B220, CD11c, CD11b, CD3+, CD8, CD4+, CD44+, tetramer+ cells per spleen were analyzed by flow cytometry. (B,C) WT, BAFFR−/− and μMT mice were inoculated with 25μg OVA-αCD180 and TFH cells were analyzed by flow cytometry 3d later following OVA-tetramer enrichment. (B) Representative flow plots of CXCR5 and PD-1 expression on the CD44+, tetramer+ populations. (C) Total Tetramer+, CXCR5+, PD-1+ TFH cells per spleen (left) and TFH cells as a % of CD44+ Tetramer+ cells (right). Data is mean ± SEM combined from three independent experiments (A,C). n=6 (Mock), 9 (OVA-Iso + αCD180, OVA-αCD180 in BAFFR−/−, OVA-αCD180 in μMT) or 12(OVA-αCD180 in WT) per group. * p<0.05, ** p<0.01 by Kruskal-Wallis test with Dunn’s multiple comparison test. TFH: T follicular helper cell.
Figure 6.
Figure 6.. B cell proliferation differs as a result of CD40 vs. CD180 targeting.
Splenic B cells were isolated from B1-8hi (Ly5.1+) mice, labeled with CFSE and transferred into C57BL/6 mice. The next day the mice were inoculated with 50μg NP-Iso, NP-αCD40 or NP-αCD180 and spleens were harvested three days later for analysis by flow cytometry. (A) Representative flow plots of B220+, Ly5.1+ cells showing their CD21, CD24 expression along the axes and CFSE expression as a heatmap overlay. (B) Splenic B cell subsets as a percent of total B220+, Ly5.1+ cells. Data is mean ± SEM combined from two experiments, n=6 per group. (C) Representative flow plots of B220+, Ly5.1+ cells showing their CD21, CD24 along the axes and NP-BCR expression as a heat map overlay. (D) CFSE diluted NP-BCR (left) or NP-BCR+ (right) B220+, Ly5.1+ cells per spleen. (E) Division index of NP-BCR (left) or NP-BCR+ (right) cells. Data (D,F) is mean ± SEM combined from three experiments, n=9 per group. * p<0.05, *** p<0.001 by Kruskal-Wallis test with Dunn’s multiple comparison test (B), or Mann-Whitney test (D,E).
Figure 7.
Figure 7.. CD40 targeting does not recapitulate key events following CD180 targeting.
(A,B) C57BL/6 mice were inoculated with 35μg OVA-αCD40 or OVA-αCD180; 24h later DCs were isolated from spleen by positive bead selection, B cells were isolated by negative bead enrichment and B cell subsets were sorted by FACS. 1×10⁵ APCs were co-cultured with 1×10⁵ CFSE-labeled OT-II T cells. Three days later, T cell proliferation was evaluated as CFSE dilution by flow cytometry. The division index (B, left) is the average number of divisions that a cell has undergone. Data is the mean ± SEM combined of three experiments with n=4 (OVA-αCD40) or n=6 (OVA-αCD180). (C) C57BL/6 mice were inoculated with 25μg OVA-αCD40 or OVA-αCD180; 3d later OVA-tetramer-specific cells were isolated from splenocytes by magnetic bead enrichment. Total CD44+, Tetramer+ (left) and Tetramer+, CXCR5+, PD-1+ TFH cells (right) were analyzed by flow cytometry. Data is mean ± SEM combined from three independent experiments, n=12 per group. (D,E) C57BL/6 mice were inoculated with 50μg NP-Iso, NP-αCD40 or NP-αCD180. Once a week, mice were bled and NP-specific IgG (D, left) and the ratio of high affinity NP-specific IgG (NP2) to total NP-specific IgG (NP20) (D, right) was quantitated by ELISA. Nine weeks after inoculation, spleens and bone marrow were harvested and NP-specific IgG secreting antibody secreting cells (ASCs) were evaluated by ELISPOT (E). Data is mean ± SEM combined from two independent experiments, n=8 per group. * p<0.05, ** p<0.01, ***p<0.001 by Mann-Whitney test (A, B, C, D right), Kruskal-Wallis test with Dunn’s multiple comparison test (E) or 2-way ANOVA with Sidak’s multiple comparison test (F left).
Figure 8.
Figure 8.. Comparing CD180 vs. CD40 targeting.
(1) Upon interaction with a CD180 targeting construct, cognate T1 and FO B cells internalize, process and present Ag on MHCII along with concomitant CD86 expression. FO B cells also downregulate CXCR5 and migrate to the T-B border. It is unclear whether T1 B cells also migrate towards the T cell zone. (2) Once at the T-B border, CD180 targeted activated cognate B cells require cognate interactions and begin to proliferate. (3) These clonal offspring seed germinal centers. (4) Cognate T cells that interact with CD180 targeted B cells, either mature or immature, expand and rapidly mature into TFH with upregulation of CXCR5 and PD-1. (5) The end result of these interactions is the production of high affinity Ag-specific IgG and long-lived plasma cells. (6) Non-cognate B cells that interact with the Ag-αCD180 are capable of processing and presenting Ag. However, they do not receive a signal through the BCR and therefore do not downregulate CXCR5 and therefore do not travel to the T-B border. These cells undergo limited proliferation due to CD180 signaling. (7) By contrast, CD40 targeted cognate B cells do not present Ag and are not programmed to seek out cognate T cell interactions. There is limited evidence of Ag-specific B cell proliferation and (8) CD40 targeted B cells do not interact with cognate T cells, thus by day 3 TFH cell maturation is not evident. (9) The result of CD40 targeting is the production of moderate affinity Ag-specific IgG and short-lived plasma cells which may form independently of germinal centers. (10) Non-cognate B cells, however, robustly proliferate due to CD40 signaling.

Similar articles

Cited by

References

    1. Chappell CP, Giltiay NV, Draves KE, Chen C, Hayden-Ledbetter MS, Shlomchik MJ, Kaplan DH, and Clark EA. 2014. Targeting Antigens through Blood Dendritic Cell Antigen 2 on Plasmacytoid Dendritic Cells Promotes Immunologic Tolerance. J. Immunol. 192: 5789–5801. - PMC - PubMed
    1. Chaplin JW, Chappell CP, and Clark EA. 2013. Targeting antigens to CD180 rapidly induces antigen-specific IgG, affinity maturation, and immunological memory. J. Exp. Med. 210: 2135–2146. - PMC - PubMed
    1. Sasaki Y, Casola S, Kutok JL, Rajewsky K, and Schmidt-Supprian M. 2004. TNF Family Member B Cell-Activating Factor (BAFF) Receptor-Dependent and -Independent Roles for BAFF in B Cell Physiology. J. Immunol. 173: 2245–2252. - PubMed
    1. Giordano D, Draves KE, Young LB, Roe K, Bryan MA, Dresch C, Richner JM, Diamond MS, Jr MG, and Clark EA. 2017. Protection of mice deficient in mature B cells from West Nile virus infection by passive and active immunization. PLOS Pathog. 13: e1006743. - PMC - PubMed
    1. Schultz TE, and Blumenthal A. 2016. The RP105/MD-1 complex: molecular signaling mechanisms and pathophysiological implications. J. Leukoc. Biol. jlb.2VMR1215-582R. - PubMed

Publication types

MeSH terms