. 2019 Sep 17;116(38):19031-19036.
doi: 10.1073/pnas.1905298116. Epub 2019 Sep 4.

Extreme heterogeneity in sex chromosome differentiation and dosage compensation in livebearers

Affiliations

Extreme heterogeneity in sex chromosome differentiation and dosage compensation in livebearers

Iulia Darolti et al. Proc Natl Acad Sci U S A. .

Abstract

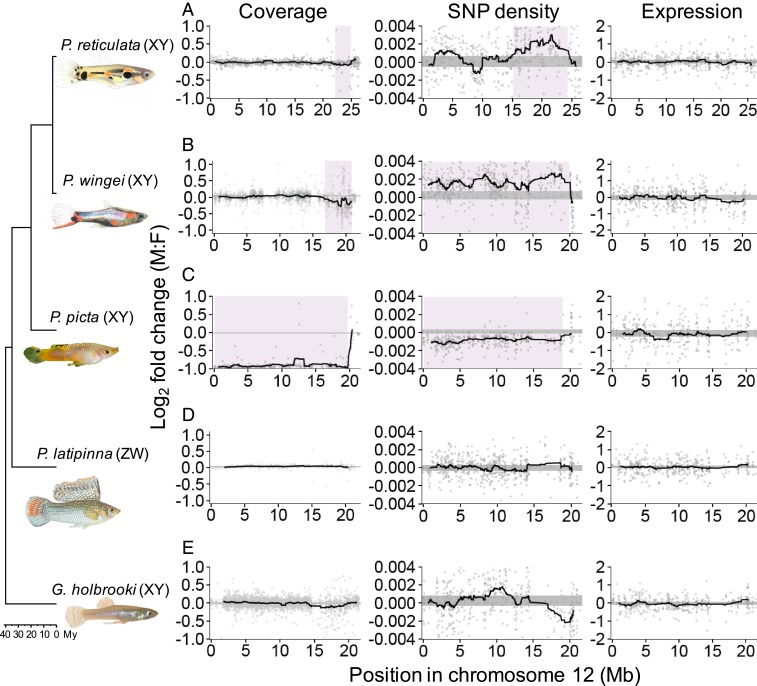
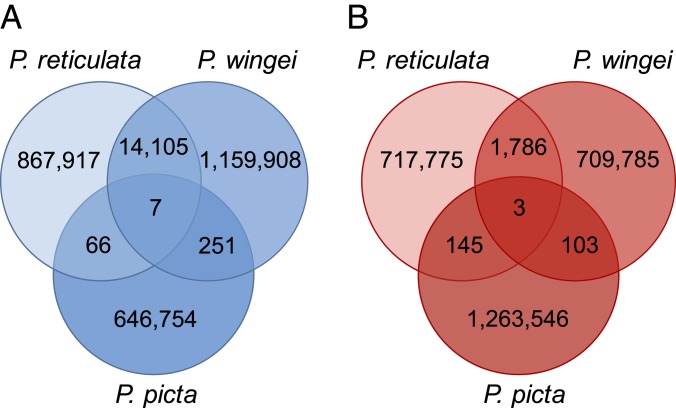
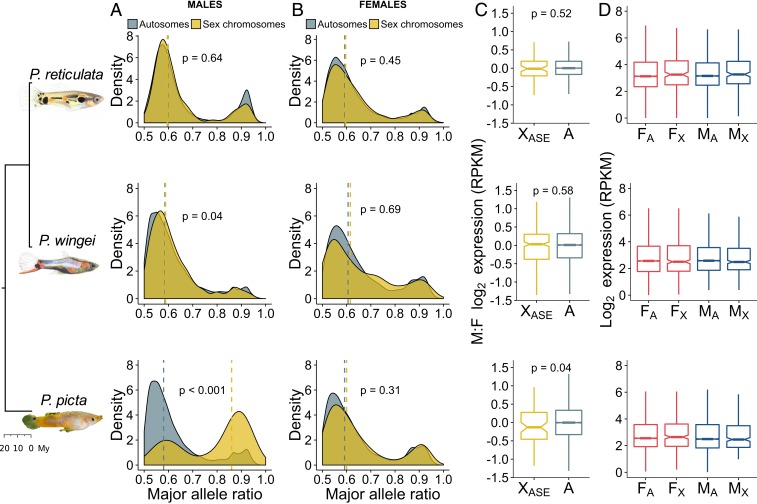
Once recombination is halted between the X and Y chromosomes, sex chromosomes begin to differentiate and transition to heteromorphism. While there is a remarkable variation across clades in the degree of sex chromosome divergence, far less is known about the variation in sex chromosome differentiation within clades. Here, we combined whole-genome and transcriptome sequencing data to characterize the structure and conservation of sex chromosome systems across Poeciliidae, the livebearing clade that includes guppies. We found that the Poecilia reticulata XY system is much older than previously thought, being shared not only with its sister species, Poecilia wingei, but also with Poecilia picta, which diverged roughly 20 million years ago. Despite the shared ancestry, we uncovered an extreme heterogeneity across these species in the proportion of the sex chromosome with suppressed recombination, and the degree of Y chromosome decay. The sex chromosomes in P. reticulata and P. wingei are largely homomorphic, with recombination in the former persisting over a substantial fraction. However, the sex chromosomes in P. picta are completely nonrecombining and strikingly heteromorphic. Remarkably, the profound degradation of the ancestral Y chromosome in P. picta is counterbalanced by the evolution of functional chromosome-wide dosage compensation in this species, which has not been previously observed in teleost fish. Our results offer important insight into the initial stages of sex chromosome evolution and dosage compensation.

Keywords: Y degeneration; dosage compensation; poeciliids; recombination.


Conflict of interest statement

The authors declare no conflict of interest.

Figures

Fig. 1.
Fig. 1.
Differences between the sexes in coverage, SNP density, and expression across the guppy sex chromosome (P. reticulata chromosome 12) and syntenic regions in each of the target species. X. hellerii chromosome 8 is syntenic, and inverted, to the guppy sex chromosome. We used X. hellerii as the reference genome for our target chromosomal reconstructions. For consistency and direct comparison to P. reticulata, we used the P. reticulata numbering and chromosome orientation. Moving average plots show male-to-female differences in sliding windows across the chromosome in P. reticulata (A), P. wingei (B), P. picta (C), P. latipinna (D), and G. holbrooki (E). The 95% confidence intervals based on bootsrapping autosomal estimates are shown by the horizontal gray-shaded areas. Highlighted in purple are the nonrecombining regions of the P. reticulata, P. wingei, and P. picta sex chromosomes, identified through a significant deviation from the 95% confidence intervals.
Fig. 2.
Fig. 2.
Number of shared k-mers across P. reticulata, P. wingei, and P. picta. Species-specific and shared male-unique k-mer (Y-mer) counts (A) and female-unique k-mer counts (B) are shown.
Fig. 3.
Fig. 3.
Patterns of gene expression and ASE. Density plots show the distribution of the major allele frequency of autosomal (gray) and sex chromosome (yellow) genes in males (A) and females (B) of each species. Vertical dotted lines indicate median values, and P values are based on Wilcoxon rank sum tests. (C) Boxplots show differences in log2 expression between the sexes (male/female) for autosomal genes (gray) and sex chromosome genes with an ASE pattern in males (yellow). P values are based on Wilcoxon rank sum tests. (D) Boxplots show average male (blue) and female (red) log2 expression for autosomes (A) and the nonrecombining region of the sex chromosomes (X) in each species. F, female; M, male.

References

    1. Bachtrog D., et al. , Are all sex chromosomes created equal? Trends Genet. 27, 350–357 (2011). - PubMed
    1. Bachtrog D., et al. , Sex determination: Why so many ways of doing it? PLoS Biol. 12, e1001899 (2014). - PMC - PubMed
    1. Muller H. J., Genetic variability, twin hybrids and constant hybrids, in a case of balanced lethal factors. Genetics 3, 422–499 (1918). - PMC - PubMed
    1. Ohno S., Sex Chromosomes and Sex-Linked Genes (Springer, New York, 1967).
    1. Bachtrog D., Y-chromosome evolution: Emerging insights into processes of Y-chromosome degeneration. Nat. Rev. Genet. 14, 113–124 (2013). - PMC - PubMed

Publication types

LinkOut - more resources