Meta-Analysis
. 2019 Sep 4;9(9):2863-2878.
doi: 10.1534/g3.119.400448.

A Prospective Analysis of Genetic Variants Associated with Human Lifespan

Affiliations
Meta-Analysis

A Prospective Analysis of Genetic Variants Associated with Human Lifespan

Kevin M Wright et al. G3 (Bethesda). .

Abstract

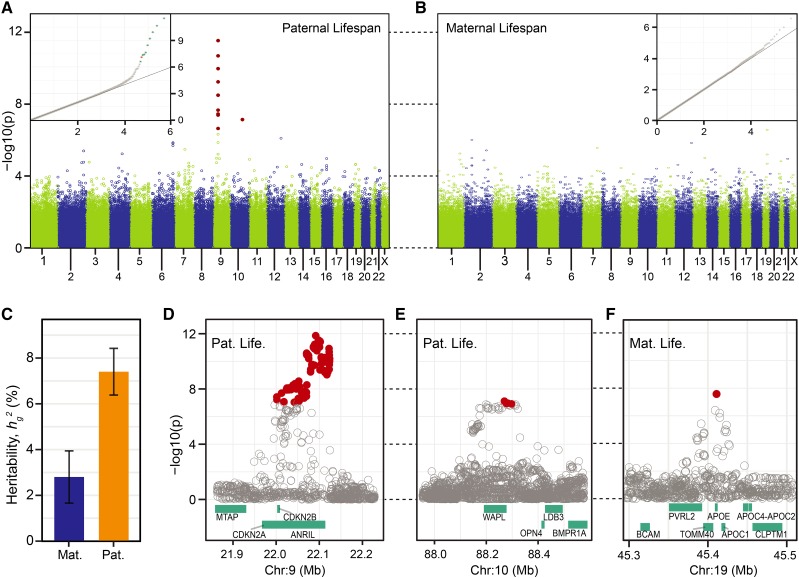
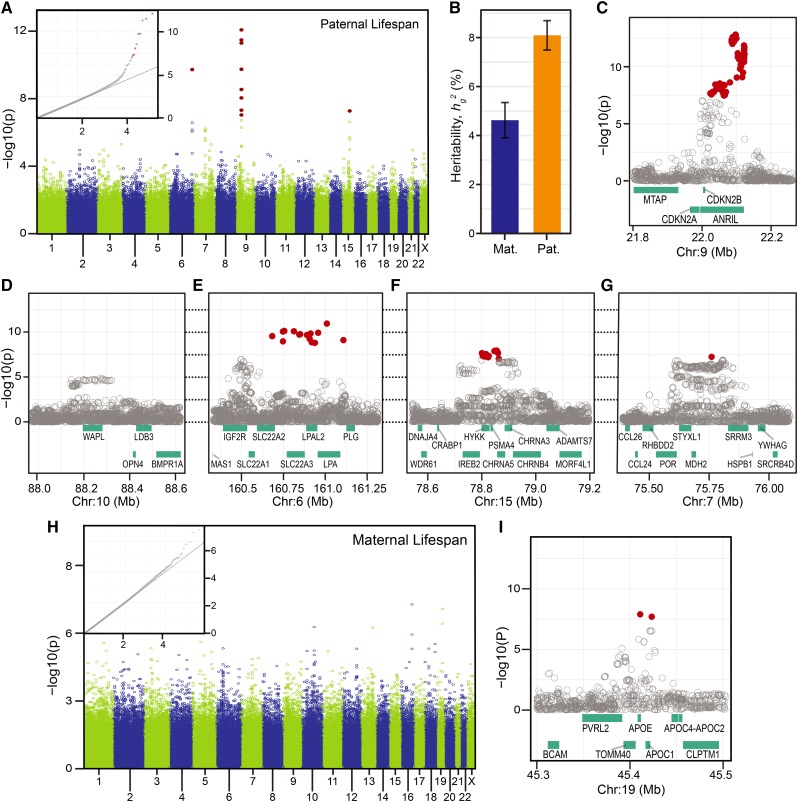
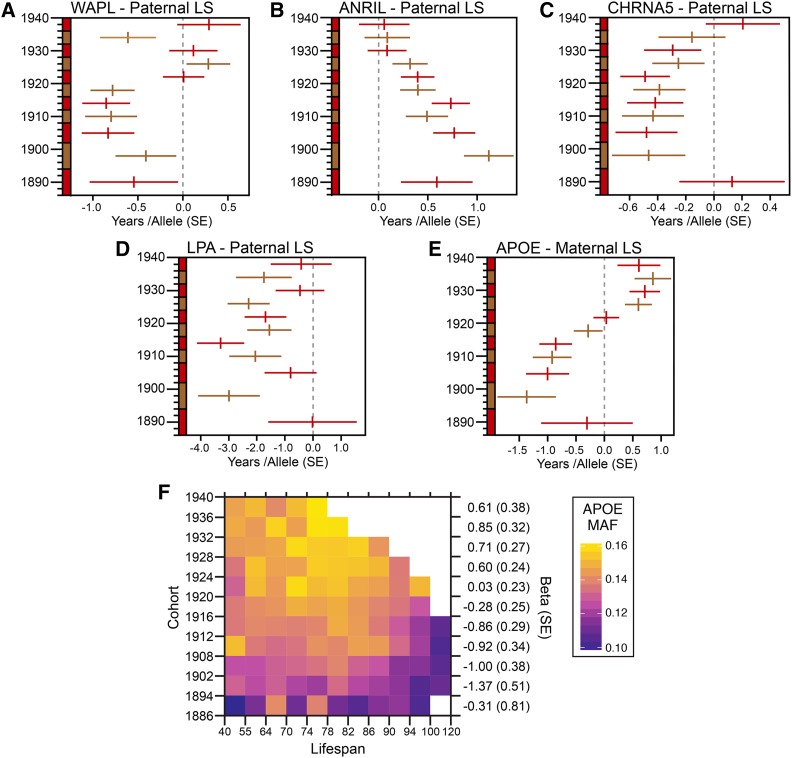
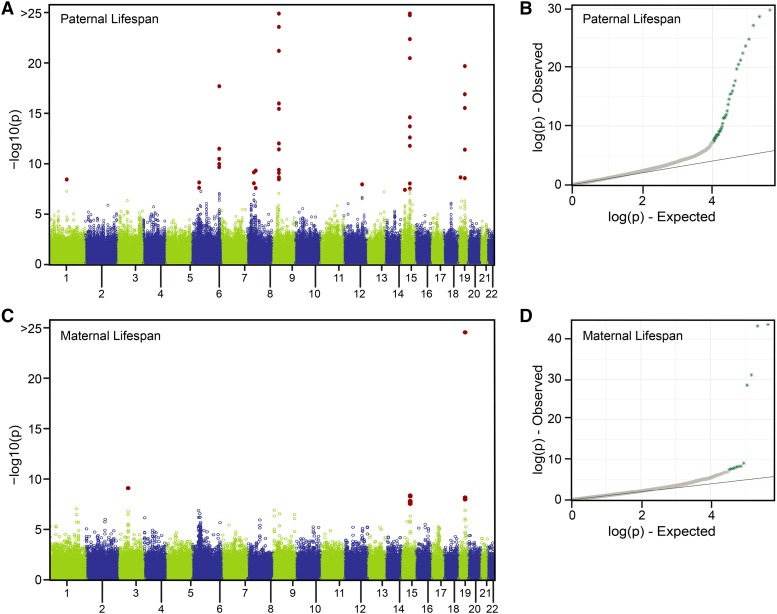
We present a massive investigation into the genetic basis of human lifespan. Beginning with a genome-wide association (GWA) study using a de-identified snapshot of the unique AncestryDNA database - more than 300,000 genotyped individuals linked to pedigrees of over 400,000,000 people - we mapped six genome-wide significant loci associated with parental lifespan. We compared these results to a GWA analysis of the traditional lifespan proxy trait, age, and found only one locus, APOE, to be associated with both age and lifespan. By combining the AncestryDNA results with those of an independent UK Biobank dataset, we conducted a meta-analysis of more than 650,000 individuals and identified fifteen parental lifespan-associated loci. Beyond just those significant loci, our genome-wide set of polymorphisms accounts for up to 8% of the variance in human lifespan; this value represents a large fraction of the heritability estimated from phenotypic correlations between relatives.

Keywords: GWAS; human; lifespan.


Figures

Figure 1
Figure 1
(A) Distribution of parental lifespan values from the 1886-1918 birth cohort. Median values noted with colored vertical lines. (B) Cumulative number of genotyped individuals with complete lifespan data. Birth cohort span from 1886 to year on x axis. Vertical gray line denotes the 1918 cohort. (C) Estimated number of long-lived individuals assumed to be censored as fraction of annual cohort size. (D) Estimated number of long-lived individuals assumed to be censored as a fraction of cumulative cohort size. In all figure panels, paternal individuals are denoted with blue, maternal individuals with orange, and overlapping values are dark orange.
Figure 2
Figure 2
(A) Pairwise correlation between ancestral admixture proportions of genotyped individuals from analysis of paternal lifespan, 1886-1918 birth cohort. (B) Linear regression coefficient (+/−SE) for admixture population and paternal or maternal lifespan. The dashed line at zero represents the mean lifespan for all individuals in the analysis. (C) Population structure, measured with principal component analysis, of individuals from analysis of paternal lifespan, 1886-1918 birth cohort. Each circle is a single individual, colored according to percent composition of Sub-Saharan Africa and Native American / East Asian admixture populations. (D) Population structure within individuals of European descent, after filtering Sub-Saharan Africa, Native American/East Asian groups. Colors depict individuals with majority ethnicity assignment in one of nine European populations.
Figure 3
Figure 3
Manhattan plot of GWA results of (A) paternal and (B) maternal lifespan, cohort 1886-1918. Each circle is a single genotyped SNP, solid red circles denote SNPs with Bonferroni corrected P values less than 0.05. Inset: Q-Q plot with expected (x-axis) vs. observed (y-axis) –log10 P values. Non-gray points denote SNPs with Bonferroni corrected P values less than 0.05. Association analysis of candidate loci with imputed data: (C) Heritability of lifespan, estimate (+/−SE) with genome-wide panel of SNPs. (D) Chrm9: ANRIL, paternal lifespan (E) Chrm10: WAPL, paternal lifespan (F) Chrm19: APOE, maternal lifespan. Solid red circle are SNPs with Bonferroni corrected P values less than 0.05. Cyan bars: hg19 gene models.
Figure 4
Figure 4
Manhattan plot of association test statistics from analyses of (A) paternal and (H) maternal lifespan, cohort 1886-1940. (B) Heritability of lifespan, estimate (+/−SE) with genotyped variants. Association analyses with imputed genotypes at candidate loci: (C) ANRIL, (D) WAPL, (E) LPA, (F) CHRNA3/5, (G) SRRM3, (I) APOE. Annotation details are the same as in Figure 3.
Figure 5
Figure 5
(A-E) Forest plots of allelic effect in years (+/−SE) of lead SNP at each candidate locus in 1886-1940 birth cohorts. Alternating red and brown lines mark successive cohorts. (F) Heat map of APOE minor allele frequency in the 1886-1940 birth cohorts, binned into lifespan phenotype classes spanning 40 – 120 years. White squares are missing data- birth cohort, phenotype combinations less than 500 individuals.
Figure 6
Figure 6
AncestryDNA-UKB meta-analysis results for maternal and paternal lifespan. Manhattan plots (A,C) where each circle shows the P value association test statistic for each genotyped SNP and solid red circles denote SNPs with Bonferroni corrected P values less than 0.05. QQ plots (B, D) of association test statistics, aquamarine colored points denote SNPs with Bonferroni corrected P values less than 0.05.

Similar articles

Cited by

References

    1. Aberg K. A., Shabalin A. A., Chan R. F., Zhao M., Kumar G. et al. , 2018. Convergence of Evidence from a Methylome-Wide CpG-SNP Association Study and GWAS of Major Depressive Disorder. Translational Psychiatry 8(1): 162. 10.1038/s41398-018-0205-8 - DOI - PMC - PubMed
    1. Backlund E., Rowe G., Lynch J., Wolfson M. C., Kaplan G. A. et al. , 2007. Income inequality and mortality: a multilevel prospective study of 521 248 individuals in 50 US states. Int. J. Epidemiol. 36: 590–596. 10.1093/ije/dym012 - DOI - PubMed
    1. Ball C., Barber M., Byrnes J., Callaway J., Chahine K. et al. , 2013. Ethnicity Estimate White Paper. https://www.ancestry.com/dna/resource/whitePaper/AncestryDNA-Ethnicity-W....
    1. Ball C., Barber M., Byrnes J., Carbonetto P., Chahine K. et al. , 2016. Ancestry DNA Matching White Paper. https://www.ancestry.com/corporate/sites/default/files/AncestryDNA-Match....
    1. Beekman M., Blanché H., Perola M., Hervonen A., Bezrukov V. et al. , 2013. Genome-Wide Linkage Analysis for Human Longevity: Genetics of Healthy Aging Study. Aging Cell 12: 184–193. 10.1111/acel.12039 - DOI - PMC - PubMed

Publication types

LinkOut - more resources