. 2019 Sep 5;4(17):e130949.
doi: 10.1172/jci.insight.130949.

Suboptimal hydration remodels metabolism, promotes degenerative diseases, and shortens life

Affiliations

Suboptimal hydration remodels metabolism, promotes degenerative diseases, and shortens life

Michele D Allen et al. JCI Insight. .

Abstract

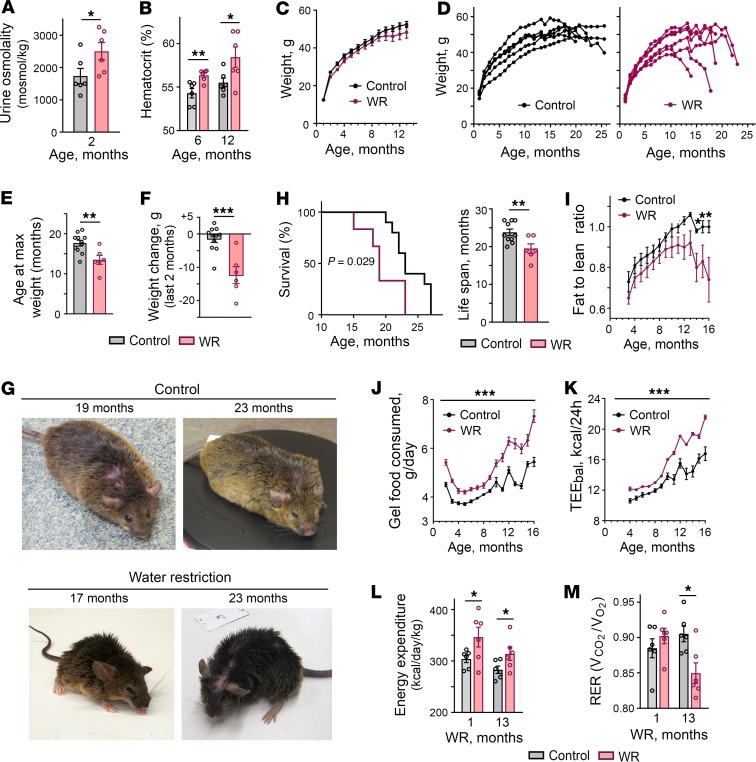
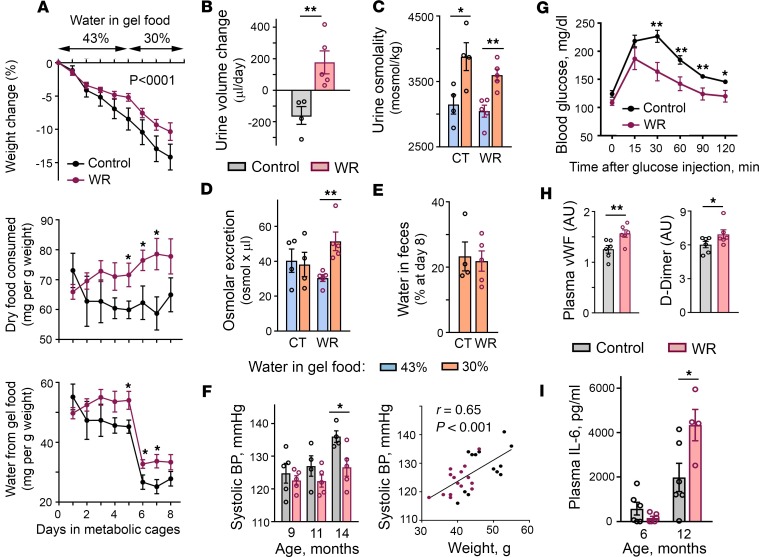
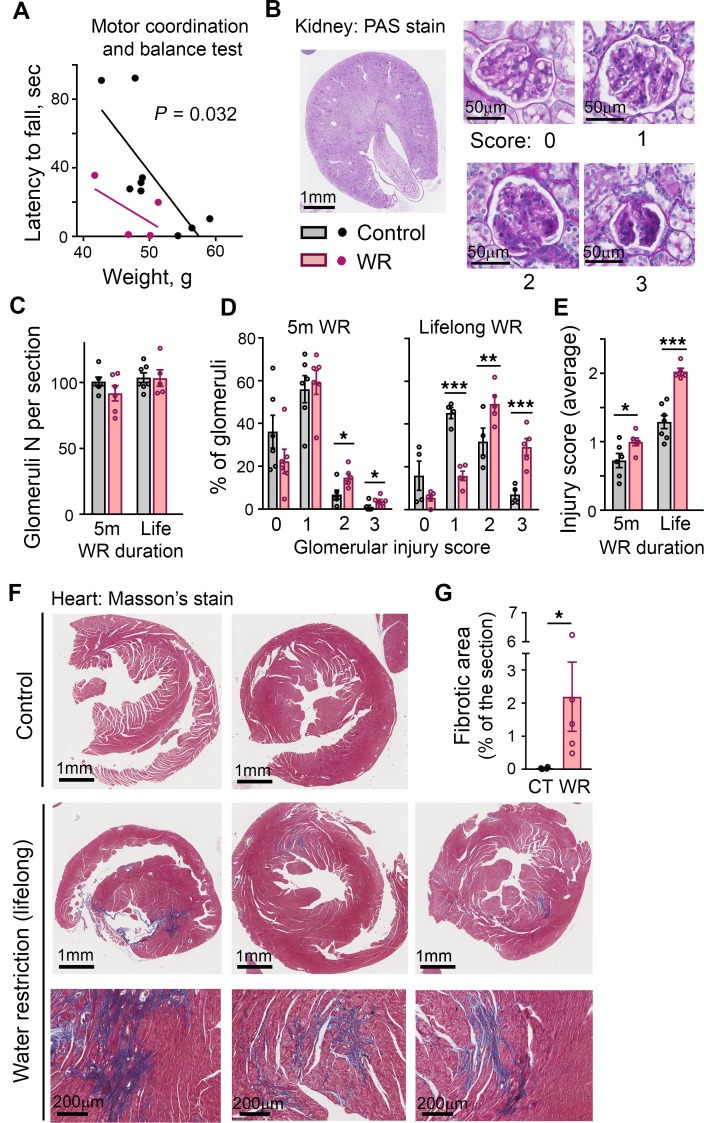
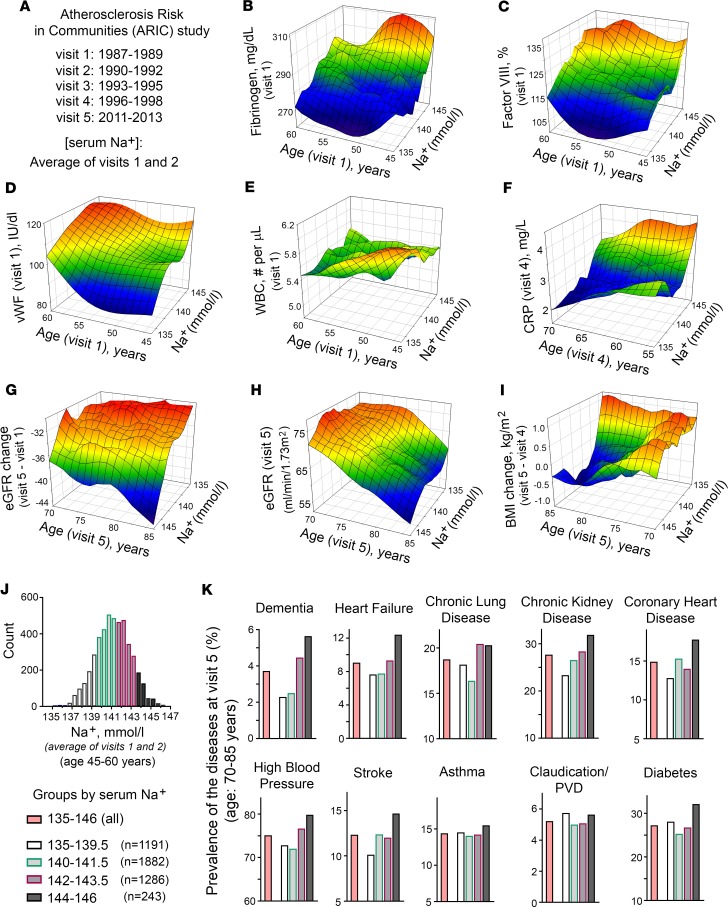
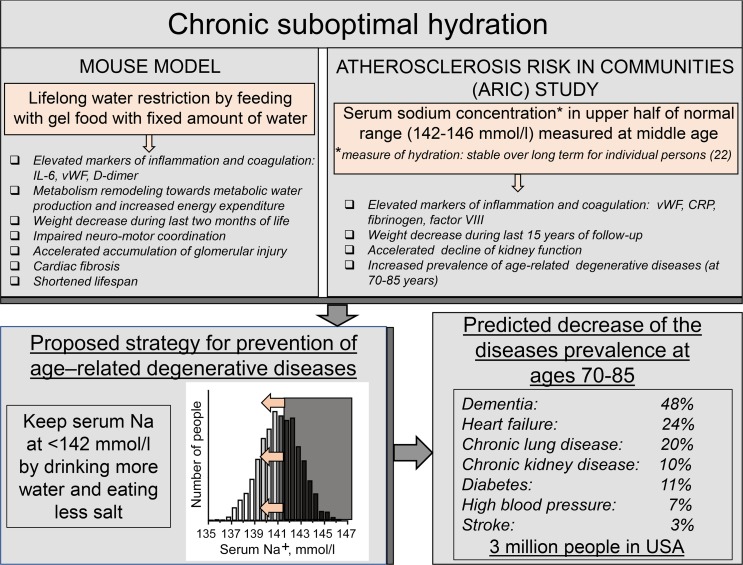
With increased life expectancy worldwide, there is an urgent need for improving preventive measures that delay the development of age-related degenerative diseases. Here, we report evidence from mouse and human studies that this goal can be achieved by maintaining optimal hydration throughout life. We demonstrate that restricting the amount of drinking water shortens mouse lifespan with no major warning signs up to 14 months of life, followed by sharp deterioration. Mechanistically, water restriction yields stable metabolism remodeling toward metabolic water production with greater food intake and energy expenditure, an elevation of markers of inflammation and coagulation, accelerated decline of neuromuscular coordination, renal glomerular injury, and the development of cardiac fibrosis. In humans, analysis of data from the Atherosclerosis Risk in Communities (ARIC) study revealed that hydration level, assessed at middle age by serum sodium concentration, is associated with markers of coagulation and inflammation and predicts the development of many age-related degenerative diseases 24 years later. The analysis estimates that improving hydration throughout life may greatly decrease the prevalence of degenerative diseases, with the most profound effect on dementia, heart failure (HF), and chronic lung disease (CLD), translating to the development of these diseases in 3 million fewer people in the United States alone.

Keywords: Aging; Epidemiology.


Conflict of interest statement

Conflict of interest: The authors have declared that no conflict of interest exists.

Figures

Figure 1
Figure 1. Mild lifelong water restriction shortens mouse lifespan accompanied by metabolic remodeling toward increased food intake and energy expenditure.
Mice were water restricted throughout their entire lives by feeding them with gel food made from 30% of water and 70% of dry food without access to any additional water. (A and B) Water restriction results in chronic decrease in hydration level. (A) Water-restricted (WR) mice have elevated urine osmolality. (B) WR mice have elevated hematocrit. (CF) Aging of WR mice is accompanied by a sharp decrease in weight during the last several weeks of life. (C) Control and WR mice grow at the same rate during the first year of life. (D) Representative growth curves showing sharp weight decrease of WR mice. (E) WR mice stop gaining weight at an earlier age. Data are plotted as age at maximum weight (mean ± SEM).**P < 0.01 by unpaired, 2-tailed t test. (F) Weight change during the last 2 months of life (mean ± SEM. ***P < 0.001 by unpaired, 2-tailed t test. (G) Representative pictures. WR mice are shown after they lost weight. They looked similar to control mice before the weight loss started. (H) WR mice have shortened life span. Left panel: the Kaplan-Meier survival curves (P = 0.029, log-ranked Kaplan-Meier survival analysis). Right panel: average life span (t test, unpaired 2-tailed, P = 0.039; Control: n = 11, WR: n = 6). (I) Attenuation of weight gain followed by weight loss is caused by decrease in body fat mass. Body composition analysis: fat-to-lean mass ratio (mean ± SEM, *P < 0.05 relative to water restriction by unpaired, 2-tailed t test). See Supplemental Figure 1 for fat and lean mass. (JM) Water restriction increases energy expenditure. (J) WR mice consume more food. Daily food consumed per mouse is plotted as mean (of 30 days) ± SEM. *P < 0.001 relative to water restriction by unpaired, 2-tailed t test). (K) Estimation of energy expenditure by calculations of energy balance (TEEbal): caloric intake minus change in body energy stores. See Methods for details. WR mice have increased TEEbal through whole period of water restriction. (L and M) Characterization of energy expenditure by measurement of gas exchange and heat production in calorimetric chambers. (L) Higher heat production in WR mice is consistent with increased energy expenditure detected by energy balance calculations shown on panel K (mean ± SEM, n = 6). *P < 0.05; **P < 0.01 by unpaired, 2-tailed t test). (M) Respiratory exchange rate (RER) decreases in WR mice after 13 months of water restriction consistent with higher proportion of metabolic utilization of lipids.
Figure 2
Figure 2. Effects of mild chronic water restriction on renal water conservation mechanisms and markers of inflammation and coagulation.
(AE) One-year water restriction does not worsen renal water conservation ability and remodels metabolism toward metabolic water formation. Mice were exposed to water restriction for 1 year and then provided with free access to water for 1 month. Efficiency of water balance regulation was assessed by exposing water-restricted (WR) mice and control mice (CT) to a short period of limited water availability performed in metabolic cages. Mice were given gel food containing 43% of water for 5 days, followed by a reduction to 30% water. No additional water was provided. (A) Time courses of food and water consumption and of weight changes. Top row: Both chronically WR mice and CT mice are losing weight with WR group at slightly lower rate. (P < 0.0001, test for the slopes difference). Middle and bottom rows: Upon reduction of water availability, CT mice decrease whereas WR mice increase food intake. (B) Despite decreased water consumption, WR mice increase urine volume indicating a fast switch of metabolism to metabolic water production. (C) Increased urine osmolality shows preserved kidney concentrating ability. (D) WR mice increase osmolar excretion consistent with metabolic water production from excess of consumed food. (E) Similar water content in feces indicates that this water preservation mechanism is not changed in WR mice. (F) Blood pressure (BP) measurements. Left panel: WR mice have lower BP (mean ± SEM). *P < 0.05 by unpaired, 2-tailed t test. Right panel: Analysis of correlation between BP and weight. All measurements for both groups and all time points are combined (n = 27). Significant correlation indicates that weight rather than water restriction determines BP variability (Pearson’s correlation coefficient = 0.65, P = 0.0002). (G) WR mice demonstrate faster glucose clearance in glucose tolerance test performed at age 16 months (mean ± SEM; Control: n = 5; WR: n = 4). **P < 0.01; *P < 0.05 by unpaired, 2-tailed t test. See Supplemental Figure 2 for mouse weights. (H) Increased levels of markers of inflammation and coagulation in chronically WR mice. Levels of vWF and D-Dimer are slightly elevated in WR mice at age 5 months. Quantification by densitometry (mean ± SEM). *P < 0.05; **P < 0.01 by unpaired, 2-tailed t test. See Supplemental Figure 3 for Western blot images. (I) Plasma IL-6 level increases faster with age in WR mice (mean ± SEM). *P < 0.05 by unpaired, 2-tailed t test.
Figure 3
Figure 3. Accelerated impairment of neuromuscular coordination, accumulation of renal glomeruli injuries, and development of cardiac fibrosis in chronically water-restricted (WR) mice.
(A) WR mice have impaired motor coordination assessed by Rota Rod test at age 14 months. Data are presented as latency to fall versus weight (P = 0.032, ANCOVA for differences between regression lines elevations). (BE) Renal deterioration is accelerated in WR mice. (B) Representative images of periodic acid-Schiff–stained mid-kidney cross-section and examples of glomeruli for each scoring category used to quantify degree of glomerular injury, from 0 (no injury) to 3 (globally sclerotic glomeruli). The analysis is done after 5 months of water restriction and at the end of lifespan. (C) Number of glomeruli does not change throughout life both in control and WR mice. (D) Proportion of total glomeruli per injury score category. (E) Mean glomeruli injury score. Accumulation of glomerular injury is accelerated in WR mice (mean ± SEM). *P < 0.05; **P < 0.01; ***P < 0.001 by unpaired, 2-tailed t test. (F and G) Water restriction promotes cardiac fibrosis. (F) Images of Masson’s trichrome stain of the heart sections at the end of lifespan. Blue color identifies collagen fibers. Bottom panels: magnifications of fibrotic areas in the heart of WR mice. (G) Quantification of fibrotic areas as percent of total section areas (mean ± SEM). *P < 0.05 by unpaired, 2-tailed t test.
Figure 4
Figure 4. Hydration status assessed by serum sodium concentration at middle age is associated with markers of inflammation and coagulation and predicts development of age-related degenerative diseases 24 years later: Atherosclerosis Risk in Communities (ARIC) study.
(A) Overview of ARIC study. ARIC is a prospective epidemiologic study that recruited 45- to 64-year-old participants (15,792 total) in 1987–1989 and followed them for 24 years. The follow-up included 4 additional visits and telephone interviews. Current analysis included participants who had all analyzed variables available, had average serum sodium concentration from visits 1 and 2 within reference range of 135–146 mmol/L and average glucose concentration at visits 1 and 2 lower than 126 mg/dL. In all, 4,602 participants remained for the analysis. (BF) 3D mesh plots, visualizing continuous variables as functions of serum sodium concentration and age observed in the ARIC study participants. See Table 1 for results of formal linear regression analyses and Supplemental Figure 4 for distributions of the variables. Participants with higher serum sodium levels (B and C) had increased level of acute-phase proteins fibrinogen and factor VIII at visit 1, (D) had higher level of vWF at visit 1, (E) did not change white blood cell count (WBC), (F) had higher level of C-reactive protein (CRP) at visit 4, (G and H) showed faster decline in estimated glomerular filtration rate (eGFR) with age, and (I) lost weight during last 15 years of follow-up (between visits 5 and 4). (J and K) Prevalence of diseases in ARIC study participants at visit 5 depending on average serum sodium concentration measured at visits 1 and 2. (J) Distribution histogram of average serum sodium concentration on visits 1 and 2 in ARIC study participants included in the analysis. Participants are divided into 4 groups based on their serum sodium concentrations. (K) Prevalence of the diseases in the groups with different serum sodium concentrations. Higher sodium is associated with higher prevalence of many chronic diseases with highest prevalence in the 143–146 mmol/L group for all diseases except asthma and peripheral vascular disease (PVD) and with a sharp increase at 142 mmol/L for dementia, heart failure, and chronic lung diseases. See Table 1 and Supplemental Table 2 for results of formal logistic regression analyses.
Figure 5
Figure 5. Study results overview, proposed strategy for decreasing risk of age-related degenerative diseases, and predicted implications for disease prevalence.
Striking similarity between outcomes of lifelong water restriction in mouse model and of chronic hypohydration assessed by serum sodium concentration in humans suggest that chronic hypohydration promotes development of age-related degenerative diseases. Estimations based on the results from the Atherosclerosis Risk in Communities (ARIC) study predict that improving hydration and shifting serum sodium below 142 mmol/L has a potential to greatly reduce prevalence of the degenerative diseases.

References

    1. Prince MJ, et al. The burden of disease in older people and implications for health policy and practice. Lancet. 2015;385(9967):549–562. doi: 10.1016/S0140-6736(14)61347-7. - DOI - PubMed
    1. Jéquier E, Constant F. Water as an essential nutrient: the physiological basis of hydration. Eur J Clin Nutr. 2010;64(2):115–123. - PubMed
    1. Bankir L, Bichet DG, Morgenthaler NG. Vasopressin: physiology, assessment and osmosensation. J Intern Med. 2017;282(4):284–297. doi: 10.1111/joim.12645. - DOI - PubMed
    1. Bourque CW. Central mechanisms of osmosensation and systemic osmoregulation. Nat Rev Neurosci. 2008;9(7):519–531. doi: 10.1038/nrn2400. - DOI - PubMed
    1. Popkin BM, D’Anci KE, Rosenberg IH. Water, hydration, and health. Nutr Rev. 2010;68(8):439–458. doi: 10.1111/j.1753-4887.2010.00304.x. - DOI - PMC - PubMed

Publication types

MeSH terms