. 2019 Sep 4;10(1):3981.
doi: 10.1038/s41467-019-11662-3.

CD36 inhibits β-catenin/c-myc-mediated glycolysis through ubiquitination of GPC4 to repress colorectal tumorigenesis

Affiliations

CD36 inhibits β-catenin/c-myc-mediated glycolysis through ubiquitination of GPC4 to repress colorectal tumorigenesis

Yuan Fang et al. Nat Commun. .

Abstract

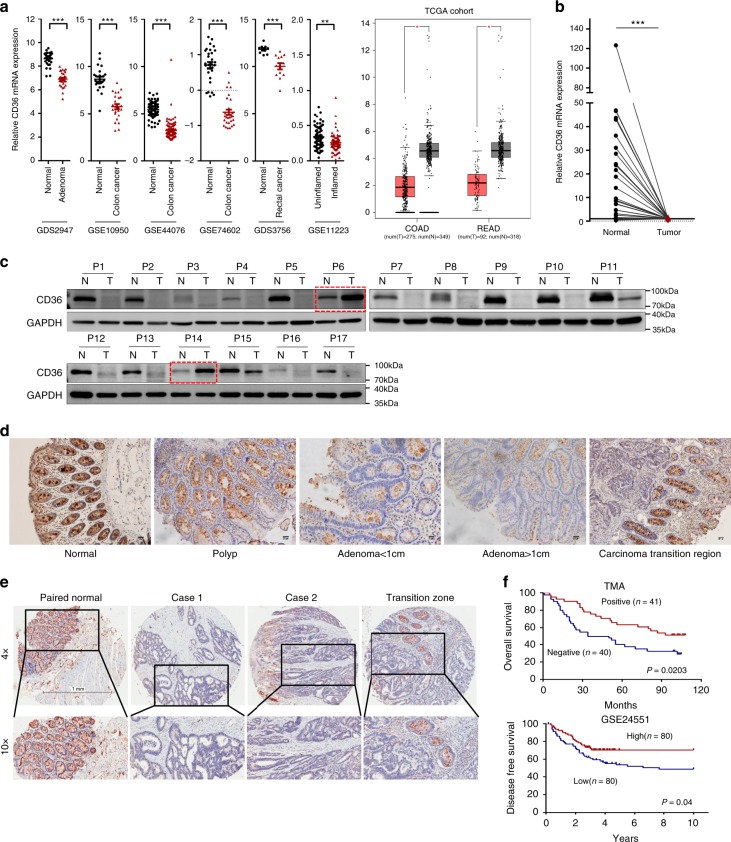
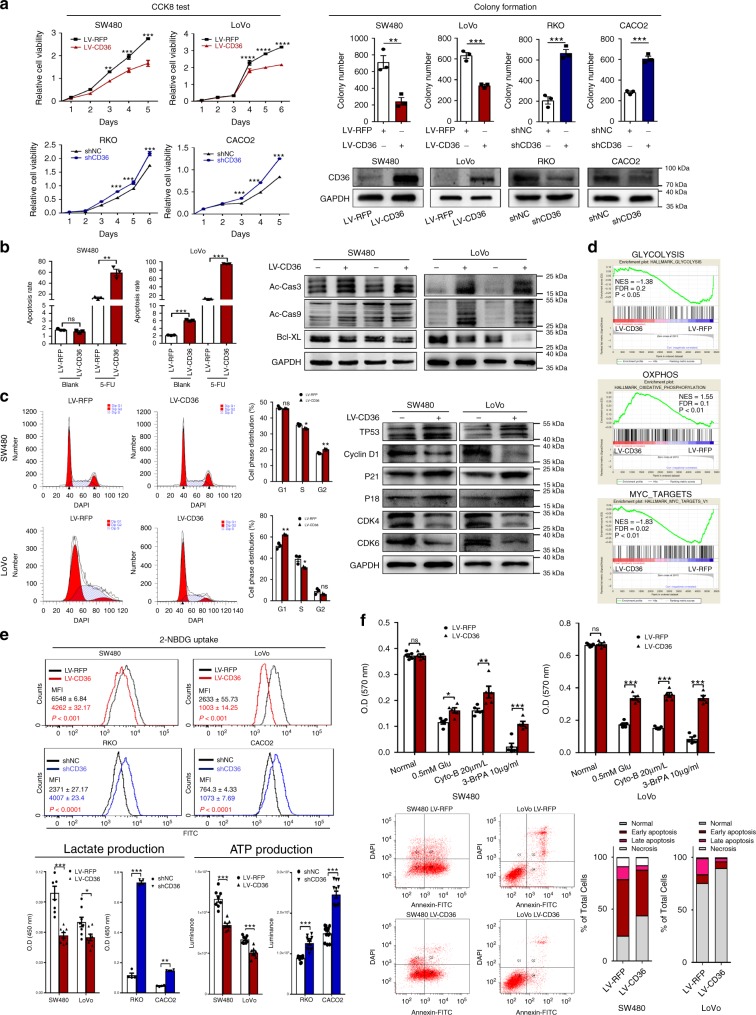
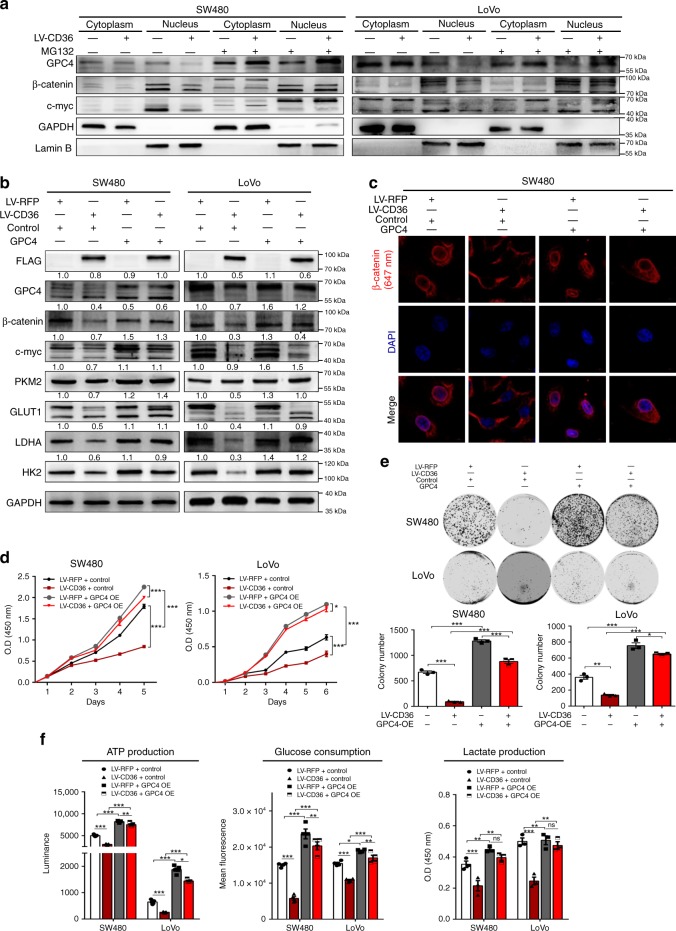
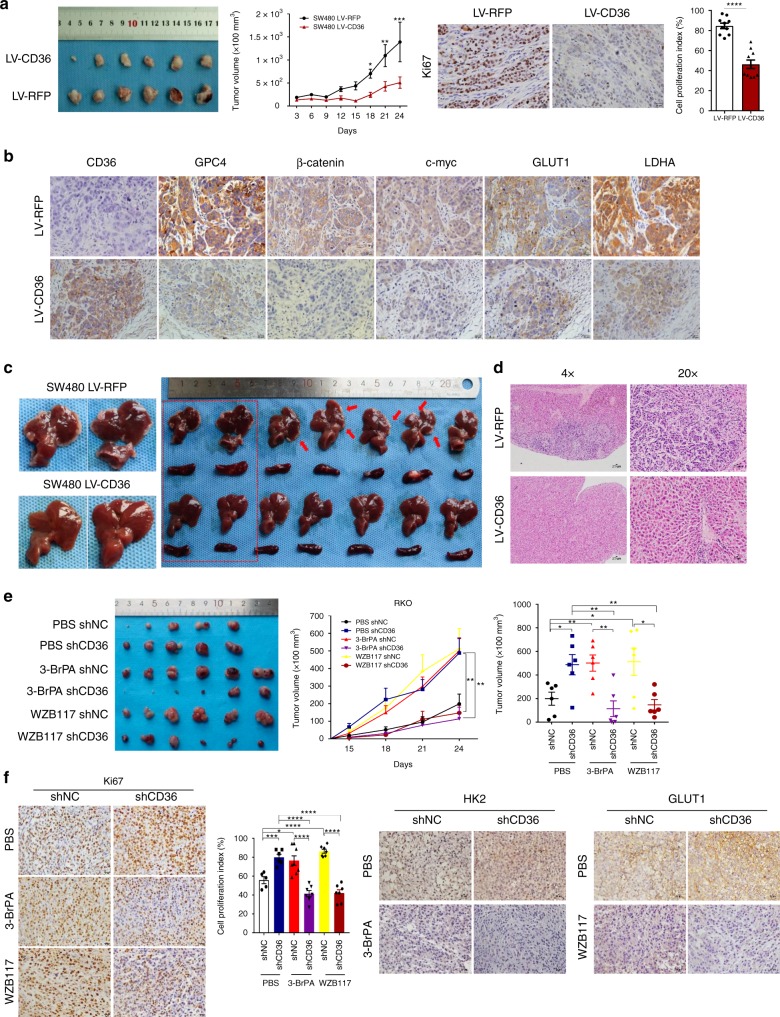
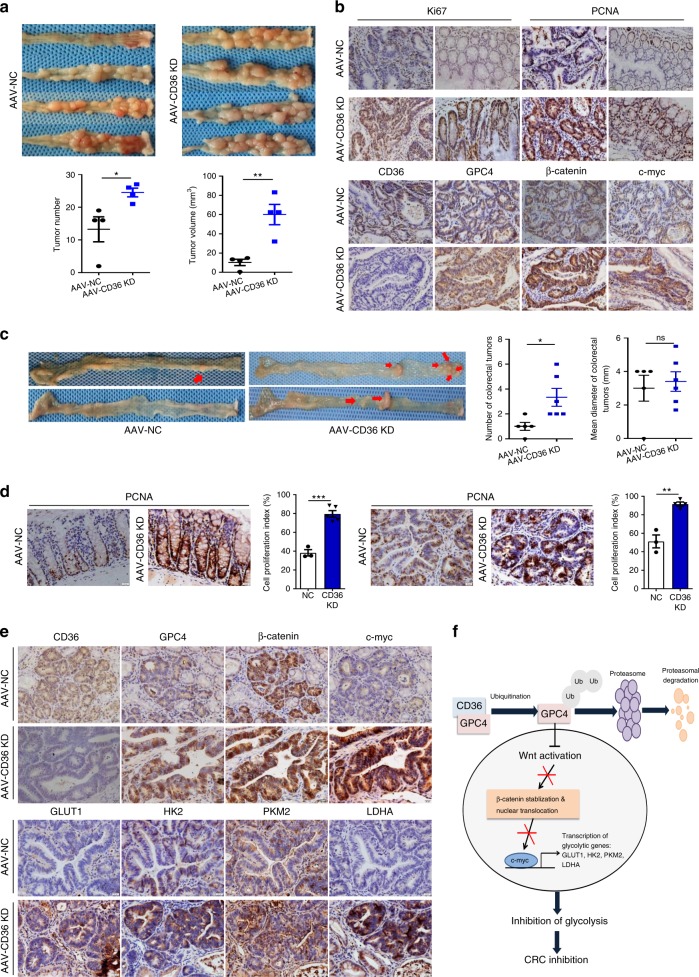
The diverse expression pattern of CD36 reflects its multiple cellular functions. However, the roles of CD36 in colorectal cancer (CRC) remain unknown. Here, we discover that CD36 expression is progressively decreased from adenomas to carcinomas. CD36 loss predicts poor survival of CRC patients. In CRC cells, CD36 acts as a tumor suppressor and inhibits aerobic glycolysis in vitro and in vivo. Mechanically, CD36-Glypcian 4 (GPC4) interaction could promote the proteasome-dependent ubiquitination of GPC4, followed by inhibition of β-catenin/c-myc signaling and suppression of downstream glycolytic target genes GLUT1, HK2, PKM2 and LDHA. Moreover, disruption of CD36 in inflammation-induced CRC model as well as ApcMin/+ mice model significantly increased colorectal tumorigenesis. Our results reveal a CD36-GPC4-β-catenin-c-myc signaling axis that regulates glycolysis in CRC development and may provide an intervention strategy for CRC prevention.


Conflict of interest statement

The authors declare no competing interests.

Figures

Fig. 1
Fig. 1
CD36 in the development of CRC. a Gene chip data were obtained and compared from 6 GEO datasets and TCGA cohorts. COAD colon adenocarcinoma, READ rectal adenocarcinoma. Results are shown as mean ± SEM, **P< .01, ***P< .001, based on Student’s t-test. b qRT-PCR analysis of mRNA expression in paired CRC tissues. Results are shown as mean ± SEM (n = 35), ***P< .001, based on paired Student’s t-test. c Western blots of CD36 protein in 17 pairs of CRC tissues, GAPDH was loaded as a control. d Immunohistochemistry (IHC) of CD36 in colon tissues with different stages of lesions, Scale bar, 50 μm (20×). e Representative images of CD36 staining on tissue microarray (inserts show ×2.5 magnification), Scale bar, 1 mm. f Kaplan–Meier survival curves of TMA (n = 81) and GSE24551 (n = 160) analysis. Source data are provided as a Source Data file
Fig. 2
Fig. 2
CD36 plays anti-carcinogenic roles via repressing glycolysis. a CCK8 assays and colony formation assays, transfection efficiency was determined by western blot. b Cell apoptosis under normal conditions and 5-Fu treatment and western blots of apoptosis markers. c Cell cycle analysis and western blots of cell cycle markers. d Gene-set enrichment analysis (GSEA) of the protein profiles between SW480 LV-CD36 and SW480 LV-RFP cell lines. e 2-NBDG uptake, lactate production and ATP production. f Cell viability was measured by MTT assays (up) under different culture conditions. Cell apoptosis of SW480 and LoVo cells (LV-RFP vs. LV-CD36) with low glucose conditions (down). Each experiment was performed at least triplicate and results are presented as mean ± SEM. Student’s t-test, one-way ANOVA or two-way ANOVA was used to analyze the data (*P < .05, **P < .01, ***P< .001, ****P < .0001). Source data are provided as a Source Data file
Fig. 3
Fig. 3
CD36 inhibits glycolysis via suppressing β-catenin/c-myc. a Colony formation assays to test cell viability under different glucose deprivation. b qRT-PCR and western blots of target genes in indicated cell lines. Results are shown as mean ± SEM (n = 3), **P< .01, ***P< .001, ****P < .0001, based on Student’s t-test. c IF staining of β-catenin (green) and c-myc (red). Merged images represent overlays of β-catenin, c-myc and nuclear staining by DAPI (blue). d Western blots of indicated proteins in cells treated with β-catenin inhibitor XAV-939 (10 μM, 72 h) and c-myc inhibitor 10058-F4 (25 μM, 96 h), respectively. e Images of cells with shCD36 or shNC under treatment of XAV-939 (100 μM, 36 h) or 10058-F4 (200 μM,36 h). Scale bar, 100 μm (10 ×). f ChIP-qPCR and PCR analysis of β-catenin with MYC and Cyclin D1 promoter regions. Data are shown as fold enrichment relative to input, ****P < .0001, mean ± SEM (n = 3), based on Student’s t-test. Source data are provided as a Source Data file
Fig. 4
Fig. 4
CD36 mediates proteasome-dependent ubiquitination of GPC4. a Protein levels of GPC4 in CRC cell lines with different CD36 expressions. b IF analysis of the co-localization of CD36 (green) and GPC4 (red) in RKO and CACO2 cell lines. c Co-immunoprecipitation (Co-IP) identified the interaction between CD36 and GPC4. d Time indicated cycloheximide (CHX, 20 μg/ml) treatment to compare the stability of GPC4 in indicated cell lines. Results are shown as mean ± SEM (n = 3), *P < .05, **P < .01, ***P< .001, based on two-way ANOVA. e MG132 (20 μM, 24 h) treatment on RKO and CACO2 cells with/without CD36 knockdown. f Co-IP determined endogenous ubiquitination and proteasome-dependent ubiquitination of GPC4. Source data are provided as a Source Data file
Fig. 5
Fig. 5
The functional role of CD36 is dependent on GPC4. a Western blot of indicated proteins with/without MG132 treatment. Lamin B is a nuclear marker, GAPDH was loaded as a cytoplasmic marker. b Western blots of indicated proteins in SW480 and LoVo cells (LV-RFP vs. LV-CD36) with/without ectopic expression of GPC4. c IF analysis of β-catenin (red) location after forced expression of GPC4. d CCK8 tests. e Colony formation assays. f ATP production (left), glucose consumption (middle) and lactate production (right). Each experiment was performed in at least triplicate and results are presented as mean ± SEM. Student’s t-test or two-way ANOVA was used to analyze the data (*P < .05, **P < .01, ***P< .001, ****P < .0001). Source data are provided as a Source Data file
Fig. 6
Fig. 6
CD36 plays tumor-suppressive roles in vivo. a Subcutaneous xenograft tumor growth in nude mice (6 per group) were measured and compared (left) in SW480 (LV-RFP vs. LV-CD36) cell lines. Cell proliferation index was determined by the proportion of nuclear Ki-67–positive cells (right). b Representative images of IHC staining of CD36, GPC4, β-catenin, c-myc, GLUT1 and LDHA on tumor sections. Scale bar, 20 μm (40×). c Macroscopic appearance of livers and spleens of mice with intrasplenic inoculation (7 per group). d Representative images of H&E staining of liver sections in CD36-overexpressed and control group, Scale bar, 200 μm (4×), 50 μm (20×). e Subcutaneous xenograft tumor formation with RKO cells (shNC vs. shCD36), followed by treatment with intraperitoneal injection of PBS or 3-BrPA (5 mg/kg) or WZB117(5 mg/kg). f Representative images of IHC staining of Ki-67, HK2, and GLUT1 on tumor sections. Scale bar, 20 μm (40×). Cell proliferation index was quantified as before. Statistical results are shown as mean ± SEM, *P < .05, ***P< .001, ****P< .001, based on two-way ANOVA or Student’s t-test. Source data are provided as a Source Data file
Fig. 7
Fig. 7
AAV-mediated CD36 knockdown promotes CRC. a Macroscopic appearance of tumors in the large intestines of AOM-DSS-induced mice. Intestinal tumor numbers and tumor volumes were measured. b Representative images of IHC staining of indicated targets on tumor sections. Scale bar, 20 μm (40×). c Macroscopic appearance of tumors in the large intestine of ApcMin/+ mice, statistical analysis of tumor numbers and sizes in the colon and rectum. d Representative IHC staining of PCNA, cell proliferation index was calculated as before. All statistical results are shown as mean ± SEM, based on Student’s t-test, *P < .05, **P < .01, ***P< .001. e Representative images of IHC staining of CD36, GPC4, β-catenin, c-myc, and downstream glycolytic genes GLUT1, HK2, PKM2 and LDHA on the tumor sections. Scale bar, 20 μm (40×). f Schematic diagram summarizing our working model, namely, CD36 can interact with and induce the proteasome-dependent ubiquitination of GPC4, thereby inhibiting β-catenin/c-myc signaling, followed by repressed glycolytic activity and colorectal tumor suppression. Source data are provided as a Source Data file

Similar articles

Cited by

References

    1. Febbraio M, Hajjar DP, Silverstein RL. CD36: a class B scavenger receptor involved in angiogenesis, atherosclerosis, inflammation, and lipid metabolism. J. Clin. Invest. 2001;108:785–791. doi: 10.1172/JCI14006. - DOI - PMC - PubMed
    1. Silverstein RL, Febbraio M. CD36, a scavenger receptor involved in immunity, metabolism, angiogenesis, and behavior. Sci. Signal. 2009;2:re3. doi: 10.1126/scisignal.272re3. - DOI - PMC - PubMed
    1. Pascual G, et al. Targeting metastasis-initiating cells through the fatty acid receptor CD36. Nature. 2017;541:41–45. doi: 10.1038/nature20791. - DOI - PubMed
    1. Yang P, et al. Dietary oleic acid-induced CD36 promotes cervical cancer cell growth and metastasis via up-regulation Src/ERK pathway. Cancer Lett. 2018;438:76–85. doi: 10.1016/j.canlet.2018.09.006. - DOI - PubMed
    1. Pan J, et al. CD36 mediates palmitate acid-induced metastasis of gastric cancer via AKT/GSK-3β/β-catenin pathway. J. Exp. Clin. Cancer Res. 2019;7:1–15. - PMC - PubMed

Publication types

MeSH terms