. 2019 Sep 4;10(1):3984.
doi: 10.1038/s41467-019-11930-2.

Activation of PKA via asymmetric allosteric coupling of structurally conserved cyclic nucleotide binding domains

Affiliations

Activation of PKA via asymmetric allosteric coupling of structurally conserved cyclic nucleotide binding domains

Yuxin Hao et al. Nat Commun. .

Abstract

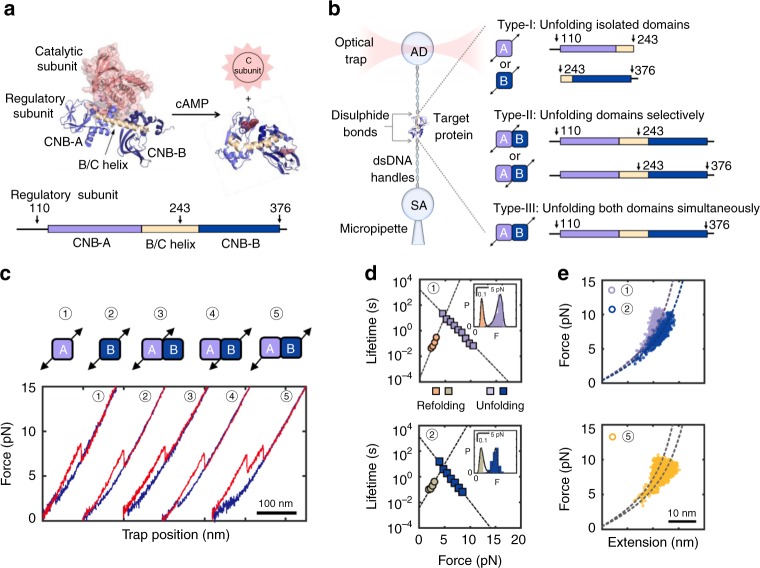
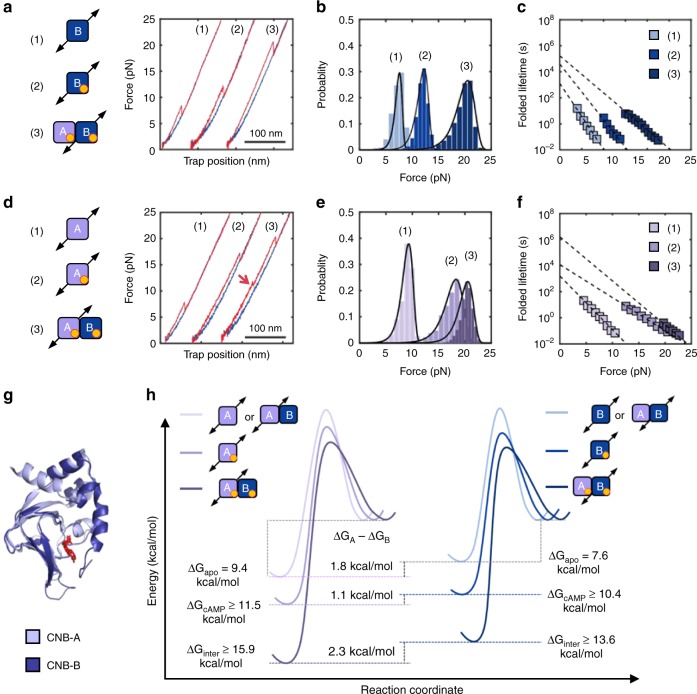
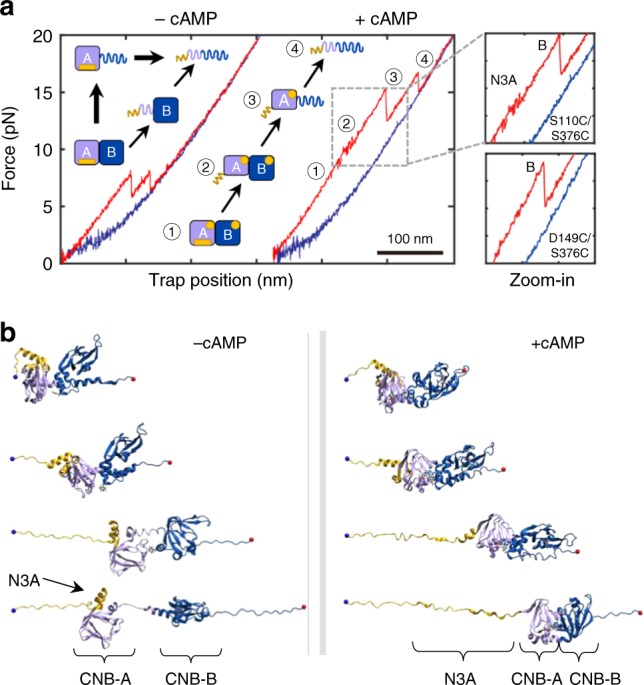
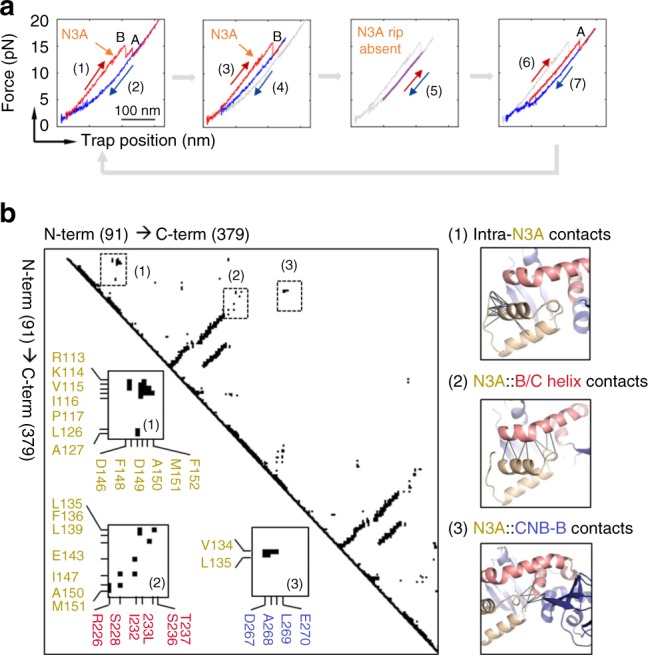
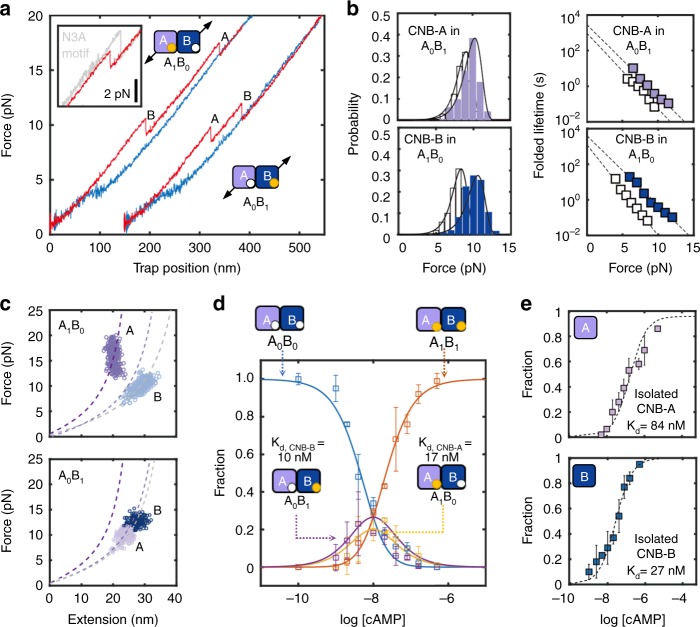
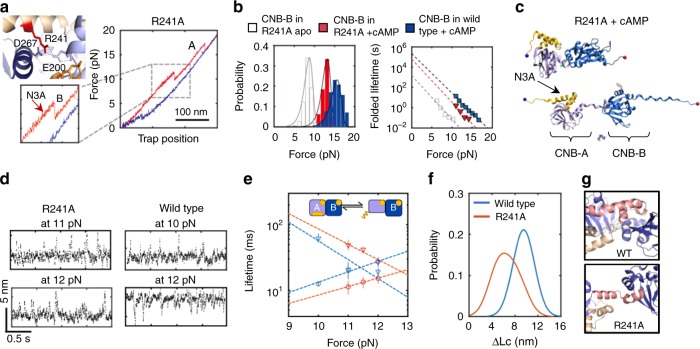
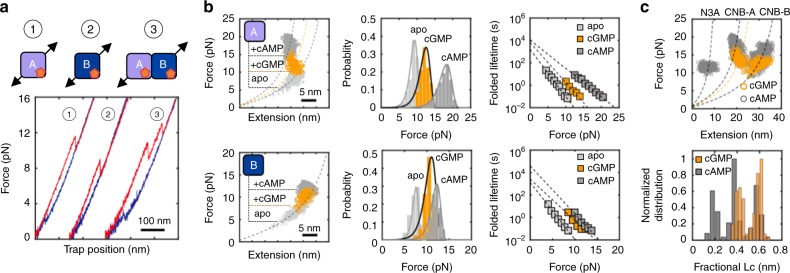
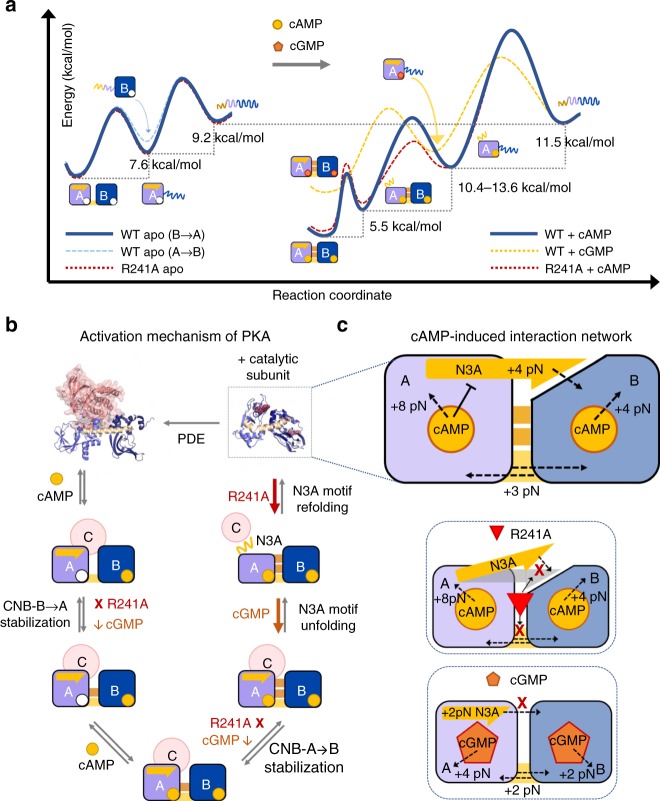
Cyclic nucleotide-binding (CNB) domains allosterically regulate the activity of proteins with diverse functions, but the mechanisms that enable the cyclic nucleotide-binding signal to regulate distant domains are not well understood. Here we use optical tweezers and molecular dynamics to dissect changes in folding energy landscape associated with cAMP-binding signals transduced between the two CNB domains of protein kinase A (PKA). We find that the response of the energy landscape upon cAMP binding is domain specific, resulting in unique but mutually coordinated tasks: one CNB domain initiates cAMP binding and cooperativity, whereas the other triggers inter-domain interactions that promote the active conformation. Inter-domain interactions occur in a stepwise manner, beginning in intermediate-liganded states between apo and cAMP-bound domains. Moreover, we identify a cAMP-responsive switch, the N3A motif, whose conformation and stability depend on cAMP occupancy. This switch serves as a signaling hub, amplifying cAMP-binding signals during PKA activation.


Conflict of interest statement

The authors declare no competing interests.

Figures

Fig. 1
Fig. 1
Experimental design to study allosteric activation in PKA with optical tweezers. a Structure of the inactive PKA holoenzyme (left) and active cAMP-bound regulatory subunit (right). The arrows on regulatory subunit domain organization indicate the residue positions for DNA handle attachment (bottom, arrows). Source data are provided as a Source Data file. b Schematic representation of optical tweezers assay (left) and protein constructs used in this study (right). c Force-extension curves for all pulling geometries in the apo state (unfolding in red; refolding in blue). Numbers match the pulling geometry with the unfolding and refolding trajectories. d Force-dependent folded-state lifetimes and unfolding force probability distribution (inset) in the apo state. Black lines in insets are the unfolding force distribution reconstructed from force-dependent lifetimes. e Worm-like chain (WLC) analysis of changes in extension vs. force for the isolated CNB domains (top) and for the first and second unfolding rips from the type-III construct (bottom). Dashed lines are the WLC curves for the CNB-A (purple) and CNB-B domains (blue). Numbering in d and e is the same as in c
Fig. 2
Fig. 2
Selective allosteric effects initiated by cAMP binding. Force-extension curves (a, d), unfolding force probability distributions (b, e), and force-dependent folded-state lifetimes (c, f) for the CNB-B (top) and CNB-A (bottom) domains. Numbering corresponds to the isolated CNB domains in the apo (1) or cAMP-bound states (2), and selective unfolding of the CNB domains bound to cAMP (3). The red arrow in d indicates the unfolding of the N3A motif. Source data for a through d are provided as a Source Data file. g Structural alignment of the CNB-A (light purple) and CNB-B (dark blue) domains bound to cAMP (red). h Energy landscape and free energy of the CNB domains due to cAMP binding and inter-domain contacts. The height of the energy barriers reflects the folded and unfolded-state lifetimes of the CNB domains in the different states. The energy landscapes have been normalized to the unfolded state. (Supplementary Tables 1 and 2)
Fig. 3
Fig. 3
Dual unfolding pathways of PKA regulatory subunit depending on cAMP occupancy. a Force-extension curve for the cAMP-free (left) and cAMP-bound (right) regulatory subunit (type-III construct). The cartoon represents the structural transitions occurring during the unfolding trajectory in apo- and cAMP-bound states. Zoomed-in are the unfolding trajectories of type-III constructs S110C/S376C and D149C/S376C bound to cAMP. A detailed analysis of the forces for each unfolding transition refer to Supplementary Information and Supplementary Table 4. b Representative structures from cluster analysis along the SMD trajectories of the cAMP-bound (left) and apo (right) regulatory subunit. Yellow: N3A motif; Purple: CNB-A; Dark blue: CNB-B domain
Fig. 4
Fig. 4
The CNB-B domain bound to cAMP is required for the N3A motif to fold. a (1) The regulatory subunit unfolds (red) and (2) refolds (blue), revealing the first reversible transition corresponding to the N3A motif (orange arrow). (3) In the following cycle, the regulatory subunit was stretched until the N3A motif and the CNB-B domain unfold, whereas the CNB-A domain remains folded. (4) The force was decreased to 4 pN, a force that does not allow the CNB-B domain to refold. (5) The force was then oscillated between 6 and 15 pN for several cycles (~20) to test whether the N3A motif was able to refold, while the CNB-B domains remain unfolded. (6) The force was increased to 20 pN to unfold the CNB-A domain. (7) The force was decreased to 1 pN, allowing the complete protein to refold and begin another set of experiments. The trajectories in gray represent the unfolding pathways from the immediately previous cycle, thereby serving as reference on the progression of experiment. b Pairwise contact map comparing the interaction established by the N3A motif in the regulatory subunit of PKA (left). The contacts established by the N3A motif were obtained using a 8 Å cutoff (right): (1) contacts established by residues within the N3A motif; (2) contacts between the N3A motif and the B/C helix; and (3) contacts between the N3A motif and the CNB-B domain. Cartoons rendering the three sets of contacts are shown next to the contact map. Residues in the N3A motif are colored in yellow, in the B/C helix in red, and in the CNB-B domain in blue
Fig. 5
Fig. 5
Stepwise stabilization between CNB domains in partial cAMP-bound states. a Representative force-extension curves of two intermediate-liganded states (A1B0 and A0B1) for the type-III regulatory subunit S110C/S376C. Zoomed-in are the unfolding trajectories of A1B0 compared with fully bound state (i.e., A1B1), showing the lack of N3A motif hopping in A1B0. b Unfolding force probability distribution and force-dependent folded-state lifetimes for intermediate-liganded states: CNB-A domain in A0B1 (top) and CNB-B domain in A1B0 (bottom). The corresponding isolated domains in the apo state (white bars and symbols) are shown for comparison. Solid lines are the unfolding force distribution reconstructed from force-dependent lifetimes. c WLC analysis of changes in extension upon unfolding vs. force in A1B0 and A0B1 for the CNB-A and CNB-B domains (dashed lines). Expected WLC curves are shown for CNB-A domain without the N3A motif (dark purple) and with the N3A motif (light purple). d cAMP titration plot showing the fraction of apo (A0B0), intermediate (A1B0 or A0B1), and fully bound (A1B1) species. Lines correspond to the global fit to the equations for each population species (Supplementary Methods). Error bars are the weighted SD of different single molecules. e Fractional titration plot of isolated CNB-A (top) and CNB-B (bottom) domains (type-I constructs). The error bar corresponds to the SD of five to ten different molecules
Fig. 6
Fig. 6
Perturbation of allosteric networks in PKA by mutation R241A. a Residue R241 interacts with both CNB domains through E200 and D267 (PDB 1RGS). Force-extension curve for R241A bound to cAMP (type-III construct S110C/S376C). Zoomed-in is the unfolding rip corresponding to the N3A motif. b Unfolding probability distributions and force-dependent folded-state lifetimes for the CNB-B domain in R241A apo (gray) or bound to cAMP (red). For reference, the wild-type data were included (blue). Solid lines are the unfolding force distribution reconstructed from force-dependent lifetimes. c SMD simulation snapshot of the cAMP-bound R241A protein. d Representative force-clamp trajectories of the N3A motif in R241A and wild type. Source data are provided as a Source Data file. e Force-dependent lifetimes of the N3A motif in the folded (triangles) and unfolded (circles) states for R241A (red) and wild type (blue). Error bars are the SD of different single molecules. f Distribution of the change in contour length (ΔLc) of the N3A motif for wild type (blue) and R241A (red). g The mutation R241A (bottom) hinders interactions established with the CNB-B domain seen in wild type (top). Source data for d and g are provided as a Source Data file
Fig. 7
Fig. 7
Perturbation of allosteric networks in PKA by cGMP. a Force-extension curves of cGMP-bound protein constructs. b WLC analysis of changes in extension upon unfolding vs. force (left), unfolding force probability distributions (center) and force-dependent folded-state lifetimes (right) for the isolated CNB-A (top) and CNB-B (bottom) domains in the apo (light gray), cGMP-bound (orange), and cAMP-bound (dark gray) states. Solid lines in center panels are the unfolding force distribution reconstructed from force-dependent lifetimes. c WLC analysis of changes in extension upon unfolding vs. force (top) and fractional contour length (bottom) of the regulatory subunit bound to cGMP (orange) and cAMP (gray). Dashed lines are the WLC curves for the N3A motif and the two CNB domains with cAMP (gray) and cGMP (orange). Source data are provided as a Source Data file
Fig. 8
Fig. 8
Activation of PKA through selective stabilization of CNB domains. a Unfolding energy landscape of the regulatory subunit in the apo state (left) and bound to cyclic nucleotide (right). The unfolding pathway in the apo state follows a CNB-B-to-CNB-A order in 80% of events (solid blue line). In the other 20%, the apo CNB-A domain unfolds first (dashed light blue line). The apo R241A mutant (dashed red line) has an indistinguishable energy landscape compared with apo wild type. In the presence of cAMP, the unfolding order in wild type is as follows: the N3A motif, the CNB-B domain, and the CNB-A domain. The cAMP-bound R241A mutant follows a similar unfolding order, but the CNB-B domain unfolds with a lower energy barrier and has lower stability due to the lack of stabilizing inter-domain interactions. The cGMP-bound wild type follows an unfolding pathway that is quantitatively and qualitatively different to that of the cAMP state (see main text for details). The height of the energy barriers reflects the folded and unfolded-state lifetimes of the CNB domains (Supplementary Tables 2–5). The energy landscapes have been normalized to the unfolded state. b Activation mechanism of PKA showing intermediate states and their cAMP-initiated interactions. Steps and interactions disrupted by R241A and cGMP are shown as “X” (complete disruption) or “down-arrow” (decreased in magnitude). c Top: interaction network initiated by cAMP binding involves stabilizing (dashed black arrows) and destabilizing (flat black arrow) coupling (top). Effect of R241A (middle) and cGMP (bottom) on interaction network

Similar articles

Cited by

References

    1. Kannan Natarajan, Wu Jian, Anand Ganesh S, Yooseph Shibu, Neuwald Andrew F, Venter J Craig, Taylor Susan S. Evolution of allostery in the cyclic nucleotide binding module. Genome Biology. 2007;8(12):R264. doi: 10.1186/gb-2007-8-12-r264. - DOI - PMC - PubMed
    1. Berman HM, et al. The cAMP binding domain: an ancient signaling module. Proc. Natl Acad. Sci. USA. 2005;102:45–50. doi: 10.1073/pnas.0408579102. - DOI - PMC - PubMed
    1. Minton K. Cell signalling: dual specificity of SH2 domains. Nat. Rev. Mol. Cell Biol. 2016;17:266. doi: 10.1038/nrm.2016.49. - DOI - PubMed
    1. Mayer BJ. SH3 domains: complexity in moderation. J. Cell. Sci. 2001;114:1253–1263. - PubMed
    1. Pawson T. Protein modules and signalling networks. Nature. 1995;373:573–580. doi: 10.1038/373573a0. - DOI - PubMed

Publication types

Substances

LinkOut - more resources