. 2019 Sep 4;10(1):3978.
doi: 10.1038/s41467-019-11983-3.

Na+-H+ exchanger 1 determines atherosclerotic lesion acidification and promotes atherogenesis

Affiliations

Na+-H+ exchanger 1 determines atherosclerotic lesion acidification and promotes atherogenesis

Cong-Lin Liu et al. Nat Commun. .

Abstract

The pH in atherosclerotic lesions varies between individuals. IgE activates macrophage Na+-H+ exchanger (Nhe1) and induces extracellular acidification and cell apoptosis. Here, we show that the pH-sensitive pHrodo probe localizes the acidic regions in atherosclerotic lesions to macrophages, IgE, and cell apoptosis. In Apoe-/- mice, Nhe1-deficiency or anti-IgE antibody reduces atherosclerosis and blocks lesion acidification. Reduced atherosclerosis in Apoe-/- mice receiving bone marrow from Nhe1- or IgE receptor FcεR1-deficient mice, blunted foam cell formation and signaling in IgE-activated macrophages from Nhe1-deficient mice, immunocomplex formation of Nhe1 and FcεR1 in IgE-activated macrophages, and Nhe1-FcεR1 colocalization in atherosclerotic lesion macrophages support a role of IgE-mediated macrophage Nhe1 activation in atherosclerosis. Intravenous administration of a near-infrared fluorescent pH-sensitive probe LS662, followed by coregistered fluorescent molecular tomography-computed tomography imaging, identifies acidic regions in atherosclerotic lesions in live mice, ushering a non-invasive and radiation-free imaging approach to monitor atherosclerotic lesions in live subjects.


Conflict of interest statement

The authors declare no competing interests.

Figures
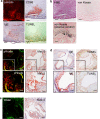
Fig. 1
Fig. 1
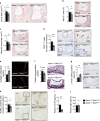
Acidic human and murine atherosclerotic lesions are rich in macrophages, IgE expression, and cell apoptosis. a pHrodo-positive acidic area, CD68-positive macrophages, IgE, and TUNEL-positive cells are colocalized in parallel sections from human atherosclerotic lesions (data are representative from five donors). b Parallel section hematoxylin and eosin staining and von Kossa staining for tissue morphology and calcification. A human atherosclerotic lesion section with calcification is used as a von Kossa staining positive control. c In parallel atherosclerotic lesion sections from Apoe–/– mice, the pHrodo-positive acidic area (red) are rich in Mac-3-positive macrophages. d IgE expression and TUNEL-positive cells from the same area of panel c. e pHrodo is replaced with water as negative control in atherosclerotic lesion from Apoe–/– mice. Data are representative from seven mice. Bars: 500 µm, inset bars: 250 µm
Fig. 2
Fig. 2
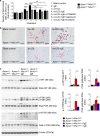
NHE1-deficiency reduces atherogenesis. Aortic roots from Apoe–/–Nhe1+/– mice have smaller intima area (a, bars: 500 µm), reduced lesion Mac-3-positive macrophage accumulation (b, bars: 200 µm), smaller necrotic core area (c, bars: 200 µm), fewer CD4+ T cells (d, bars: 200 µm, inset bars: 50 µm), increased collagen deposition (e, bars: 500 µm, Sirius red staining), reduced elastin fragmentation (f, bars: 200 µm, Verhoeff Van Gieson staining), increased lesion SMC contents (g, bars: 200 µm), reduced lesion TUNEL-positive apoptotic cell contents (h, bars: 500 µm, inset bars: 200 µm), and reduced plasma TCTP levels i, compared with those from the Apoe–/–Nhe1+/+ control mice. j Plasma IgE levels between the groups. Representative figures for panels ah are shown to the right. Data are mean ± SEM. n = 13 per group. Two-tailed Student’s t-test (a, c, e, f, g, h) and Mann–Whitney U-test (b, d, i, j) were used for statistic analyses. *P < 0.05; **P < 0.01; ***P < 0.001. Source data are provided as a Source Data file
Fig. 3
Fig. 3
NHE1-deficeincy reduces atherosclerotic lesion acidification. pHrodo-positive acidic area, Mac-3-positive macrophages, IgE expression, and TUNEL-positive apoptotic cells are colocalized in atherosclerotic lesions from aortic roots ac, aortic arches df, and abdominal aortas gi from both Apoe–/–Nhe1+/+ control mice a, d, g and Apoe–/–Nhe1+/– mice b, e, h. Bars: 200 µm. Sections with comparable lesion size and Mac-3-positive macrophage contents from Apoe–/–Nhe1+/+ control mice and Apoe–/–Nhe1+/– mice are selected and quantified as shown in the right two panels from panels c, f, and i. Data are mean ± SEM. n = 6 per group.Two-tailed Student’s t-test (three panels in c, middle panel in f, middle and right panels in i) and Mann–Whitney U-test (right and left panels in f, left panel in i) were used for statistic analyses. *P < 0.05. NS: no significant difference. Source data are provided as a Source Data file
Fig. 4
Fig. 4
Role of macrophage Nhe1 in atherosclerosis. Quantification of aortic root pHrodo-positive area, intima area, Mac-3+ macrophage content, TUNEL-positive apoptotic cell number, and α-actin-positive SMC content in Apoe–/– mice received bone-marrow from Apoe–/–Nhe1+/+ (n = 7) and Apoe–/–Nhe1+/– (n = 10) donor mice a or received bone-marrow from Apoe–/–Fcer1a+/+ (n = 8) and Apoe–/–Fcer1a–/– (n = 11) donor mice b as indicated. Representative images of macrophage staining and pHrodo detection for panels a and b are shown to the left. Bars: 500 µm, inset bars: 200 µm. Data are mean ± SEM. Mann–Whitney U-test (intima area in b) and two-tailed Student’s t test (all other panels) were used for statistic analyses. *P < 0.05; **P < 0.01; ***P < 0.001. Source data are provided as a Source Data file. c Immunoprecipitation (IP) and immunoblot (IB) analysis of macrophages from WT and Fcer1a–/– mice after cells are treated with or without IgE. Cell lysate IP is performed using anti-Nhe1 antibody and IB is performed using either anti-FcεR1 antibody (top panel) or directly with HRP-conjugated anti-IgG antibody (bottom panel). Input cell lysate from IgE-treated WT macrophages is used as positive control. d Immunofluorescent triple staining for Mac-2 macrophages, FcεR1, and Nhe1 in atherosclerotic lesions from Apoe–/–Nhe1+/+ mice (n = 9). White arrows indicate FcεR1 and Nhe1 colocalization on Mac-2+ macrophages. Parallel sections of panel d are stained for pHrodo e and elastin f. Yellow and black arrows indicate elastin breaks. g Immunofluorescent triple staining for Mac-2, FcεR1, and Nhe1 in aortic root section from healthy WT mice (n = 4) as negative control. Parallel sections are stained for pHrodo and elastin. Bars in dg: 200 µm, inset bars in df: 70 µm. Source data are provided as a Source Data file
Fig. 5
Fig. 5
Role of Nhe1 in IgE-induced macrophage foam cell formation. Intracellular lipid quantification a and selected representative images b of macrophages from Apoe–/–Nhe1+/+ and Apoe–/–Nhe1+/– mice after treatment with or without IgE, ox-LDL, PI3 kinase inhibitor LY294002, AKT inhibitor triciribine, and mTOR inhibitor rapamycin as indicated. Bars: 200 µm. c Immunoblot analysis of (p)-AKT, (p)-PI3K, (p)-mTOR, and β-actin in macrophages from Apoe–/–Nhe1+/+ and Apoe–/–Nhe1+/– mice after treatment with and without IgE. Gel density quantifications are shown to the right. Data are presented as mean ± SEM from three independent experiments. One-way ANOVA test followed by a post hoc Tukey’s test (p-AKT/total AKT in c) and Kruskal–Wallis test followed by Dunn's procedure (all other panels) were used to compare three or more groups. *P < 0.05; **P < 0.01; ***P < 0.001. Source data are provided as a Source Data file
Fig. 6
Fig. 6
Anti-IgE antibody blocks atherogenesis and lesion acidification. a Atherosclerotic lesion pHrodo-positive area, intima area, and Mac-3-positive area from Apoe–/–Nhe1+/+ and Apoe–/–Nhe1+/– mice treated with IgE antibody (n = 5 per group) or isotype control IgG1 (n = 5 per group) as indicated. Lesions are selected with comparable intima size and lesion macrophage contents between the groups. Bars: 200 µm. b Atherosclerotic lesion intima area, Mac-3-positive area, CD4+ T-cell number, and TUNEL-positive area from both Apoe–/–Nhe1+/+ and Apoe–/–Nhe1+/– mice treated with IgE antibody (n = 10 per group) or isotype control IgG1 (n = 10–11 per group) as indicated. Data are mean ± SEM. One-way ANOVA test followed by a post hoc Tukey’s test (aortic root pHrodo positive area and Mac-3+ area in a and Mac-3+ area in b) and Kruskal–Wallis test followed by Dunn's procedure (all other panels) were used to compare three or more groups. *P < 0.05; **P < 0.01; ***P < 0.001. Source data are provided as a Source Data file
Fig. 7
Fig. 7
Mouse atherosclerotic lesion FMT-CT imaging and verification. FMT-CT images and fluorescence quantification a and representative FMT images b of live atherosclerotic Apoe–/–Nhe+/+ (n = 8) and Apoe–/–Nhe+/– mice (n = 8) and healthy WT mice (n = 4). c FMT images and fluorescence quantification of ex vivo thoracic-abdominal aortas from atherosclerotic Apoe–/–Nhe+/+ and Apoe–/–Nhe+/– mice and healthy WT mice. pHrodo detection of acidic regions and Mac-3 macrophage, IgE, and TUNEL-positive cell colocalization in atherosclerotic lesion from aortic root d and aortic arch e cross section from atherosclerotic Apoe–/–Nhe+/+ and Apoe–/–Nhe+/– mice. Representative figures for panels ae are shown to the left. f pHrodo detection of acidic regions and Mac-3 macrophage, IgE, and TUNEL-positive cell colocalization in aortic arch from a healthy WT mouse (n = 4). Bars: 200 µm. Data are mean ± SEM. Mann–Whitney U-test a and two-tailed Student’s t-test c, d, e were used for statistic analyses. *P < 0.02; **P = 0.001. Source data are provided as a Source Data file

Similar articles

Cited by

References

    1. Naghavi M, et al. pH Heterogeneity of human and rabbit atherosclerotic plaques; a new insight into detection of vulnerable plaque. Atherosclerosis. 2002;164:27–35. doi: 10.1016/S0021-9150(02)00018-7. - DOI - PubMed
    1. Oorni K, et al. Acidification of the intimal fluid: the perfect storm for atherogenesis. J. Lipid Res. 2015;56:203–214. doi: 10.1194/jlr.R050252. - DOI - PMC - PubMed
    1. Rotin D, Grinstein S. Impaired cell volume regulation in Na(+)-H+ exchange-deficient mutants. Am. J. Physiol. 1989;257:C1158–C1165. doi: 10.1152/ajpcell.1989.257.6.C1158. - DOI - PubMed
    1. Counillon L, Pouyssegur J. The expanding family of eucaryotic Na(+)/H(+) exchangers. J. Biol. Chem. 2000;275:1–4. doi: 10.1074/jbc.275.1.1. - DOI - PubMed
    1. Matsuyama S, Llopis J, Deveraux QL, Tsien RY, Reed JC. Changes in intramitochondrial and cytosolic pH: early events that modulate caspase activation during apoptosis. Nat. Cell Biol. 2000;2:318–325. doi: 10.1038/35014006. - DOI - PubMed

Publication types