. 2019 Sep 4;9(1):12766.
doi: 10.1038/s41598-019-48967-8.

Interrogating Mutant Allele Expression via Customized Reference Genomes to Define Influential Cancer Mutations

Affiliations

Interrogating Mutant Allele Expression via Customized Reference Genomes to Define Influential Cancer Mutations

Adam D Grant et al. Sci Rep. .

Abstract

Genetic alterations are essential for cancer initiation and progression. However, differentiating mutations that drive the tumor phenotype from mutations that do not affect tumor fitness remains a fundamental challenge in cancer biology. To better understand the impact of a given mutation within cancer, RNA-sequencing data was used to categorize mutations based on their allelic expression. For this purpose, we developed the MAXX (Mutation Allelic Expression Extractor) software, which is highly effective at delineating the allelic expression of both single nucleotide variants and small insertions and deletions. Results from MAXX demonstrated that mutations can be separated into three groups based on their expression of the mutant allele, lack of expression from both alleles, or expression of only the wild-type allele. By taking into consideration the allelic expression patterns of genes that are mutated in PDAC, it was possible to increase the sensitivity of widely used driver mutation detection methods, as well as identify subtypes that have prognostic significance and are associated with sensitivity to select classes of therapeutic agents in cell culture. Thus, differentiating mutations based on their mutant allele expression via MAXX represents a means to parse somatic variants in tumor genomes, helping to elucidate a gene's respective role in cancer.


Conflict of interest statement

The authors declare no competing interests.

Figures

Figure 1
Figure 1
Developing an unbiased tool to assess the expression of somatic variants. (a) Flowchart of the MAXX pipeline, which ultimately identifies the RNA read count for the mutant allele and the wild type allele. (b) Methodology for mutation expression group placement, represented as V-ex (blue), W-ex (green), and N-ex (red): V-ex, mutations that express the mutant allele; W-ex, mutations that only express the wild type allele; N-ex, mutations that don’t express the wild type allele or the mutant allele. (c) The number of mutations associated with each mutation expression group. These mutations were derived from 19 PDAC patient derived cell lines. (d) The fraction of each mutation expression group for all patient derived cell lines.
Figure 2
Figure 2
MAXX pipeline accurately maps indels and is computationally efficient. (a) Integrative genomic viewer visualization of raw RNA-seq reads that aligned to the wild type allele or the mutant allele for a SNV, insertion, and deletion mutation. Non-gray colors represent an alternative nucleotide compared to the Hg19 reference genome (b) Comparison of the RNA mutant allele frequencies calculated by using either the MAXX generated reference genome or the Hg19 reference genome. (c) The contrast between the RNA mutant allele frequencies identified by using either the MAXX generated reference genome or the Hg19 reference genome with an appended mutant genome created by MAXX.
Figure 3
Figure 3
Mutant allele expression is associated with DNA mutant allele frequency, but not RNA expression level. (a) All mutations identified within patient derived cell lines DNA allele frequency plotted against their corresponding RNA allele frequency. (b) Integrative genomic viewer representation of the exome sequencing and RNA sequencing for a V-ex mutation, W-ex mutation, and N-ex mutation. Non-gray colors represent the presence of conflicting nucleotides aligned to the Hg19 reference genome. (c) The distribution of DNA allele frequencies for the three mutation expression groups and statistical significance based on a two-sample t-test with a two-tail p-value. (d) Two sample paired t-test with a two-tail p-value between the average gene expression levels of samples with the mutated gene and samples without the mutated gene for each mutation expression group. (e) A box plot of the mean expression across 193 normal pancreas tissues of identified mutated genes within the patient derived cell lines. A two-sample t-test with a two-tailed p-value was used to compare mutation expression groups.
Figure 4
Figure 4
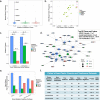
PDAC associated genes mainly fall into the V-ex and W-ex groups. (a) The gene mutation frequency of all V-ex, W-ex and N-ex mutations. (b) Comparison of the DNA allele frequency and RNA allele frequency for the most well-known PDAC mutations (KRAS, CDKN2A, SMAD4, TP53). (c) Fraction of mutations that are associated with the Cosmic and Tamborero cancer gene datasets for each mutation expression group. Statistical significance was performed using a two-proportion z-test between each of the mutation expression groups. (d) A network generated from the V-ex, W-ex, and N-ex mutated genes that were present in either the Cosmic or Tamborero datasets. (e) The distribution of mutation expression groups from the top 50 ranked mutated genes outputted by the driver mutation detection methods 2020+, Muffin, and OncodriveFM. (f) A Fisher’s exact test was performed on three driver mutation detection methods to quantify their ability to identify cancer associated genes from the Cosmic and Tamborero, based on their 50 top-ranked mutated genes. Cancer gene statistical significance was calculated for either all top 50 mutated genes or the top 50 mutated genes that did not contain an N-ex mutation.
Figure 5
Figure 5
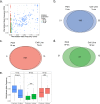
Conservation of mutational expression features from cell lines to PDX tumors. (a) Comparison of the DNA allele frequency and RNA allele frequency of each mutation derived from the PDX samples. (bd) The overlap of V-ex, W-ex, and N-ex mutations between the corresponding cell line and PDX samples. Mutations classified as “discarded” in either the cell line or PDX data were excluded. (e) A two-tailed Wilcoxon Mann Whitney test between the DNA allele frequency of mutations that are present in both the cell line and PDX samples and the DNA allele frequency of mutations that are unique to either the cell line or PDX samples was performed for each mutation expression group.
Figure 6
Figure 6
Mutation expression profiles from primary tumors. (a) Comparison of the DNA allele frequency and RNA allele frequency of each mutation derived from the TCGA samples. (b) Correlation of the DNA allele frequency and the RNA allele frequency of CDKN2A, KRAS, SMAD4, and TP53 mutations identified within the TCGA samples. (c) The average first exon methylation of samples that didn’t contain the mutated gene was plotted against the average first exon methylation of samples that did contain the mutated gene. This was performed for non-discarded mutated genes that had available first exon methylation data. (d) A two-sample t-test with a two-tail p-value was performed on the mutant first exon methylation between each mutation expression group.
Figure 7
Figure 7
Separating mutations by expression enhances PDAC subtyping. (a) The log rank statistic -log10(p-value) based on the NBS results for 75 TCGA samples. The log rank statistic -log10(p-value) was calculated for the NBS results of all pairwise combinations of mutation expression groups from 3–8 number of predefined subtypes. (b) The log rank statistic -log10(p-value) based on the NBS results for 75 TCGA samples using the stratified samples based on results from 2020+, Muffin, OncodriveFM or V-ex and W-ex mutations. (c) Kaplan Meier plot for TCGA samples based on the NBS results using V-ex and W-ex mutations with number of subtypes equal to three. (d) Networks signifying the mutated pathways that are unique to subtype 1 and subtype 2. (e) Cell line drug response data, grouped by identified subtypes and statistical significance via a Wilcoxon Mann Whitney less than test.

Similar articles

Cited by

References

    1. Loeb KR, Loeb LA. Significance of multiple mutations in cancer. Carcinogenesis. 2000;21:379–385. doi: 10.1093/carcin/21.3.379. - DOI - PubMed
    1. Loeb LA, Loeb KR, Anderson JP. Multiple mutations and cancer. Proc Natl Acad Sci USA. 2003;100:776–781. doi: 10.1073/pnas.0334858100. - DOI - PMC - PubMed
    1. Alexandrov LB, et al. Signatures of mutational processes in human cancer. Nature. 2013;500:415–421. doi: 10.1038/nature12477. - DOI - PMC - PubMed
    1. Stratton MR, Campbell PJ, Futreal PA. The cancer genome. Nature. 2009;458:719–724. doi: 10.1038/nature07943. - DOI - PMC - PubMed
    1. Tomasetti C, Marchionni L, Nowak MA, Parmigiani G, Vogelstein B. Only three driver gene mutations are required for the development of lung and colorectal cancers. Proc Natl Acad Sci USA. 2015;112:118–123. doi: 10.1073/pnas.1421839112. - DOI - PMC - PubMed

Publication types