

Global invasion genetics of two parasitic copepods infecting marine bivalves
- PMID: 31484951
- PMCID: PMC6726661
- DOI: 10.1038/s41598-019-48928-1
Global invasion genetics of two parasitic copepods infecting marine bivalves
Abstract
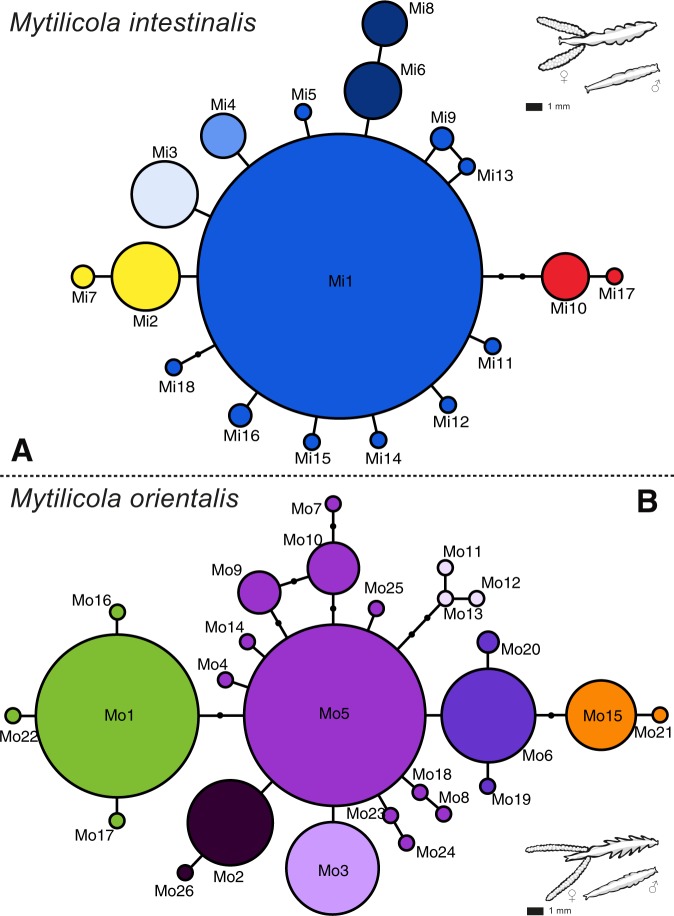
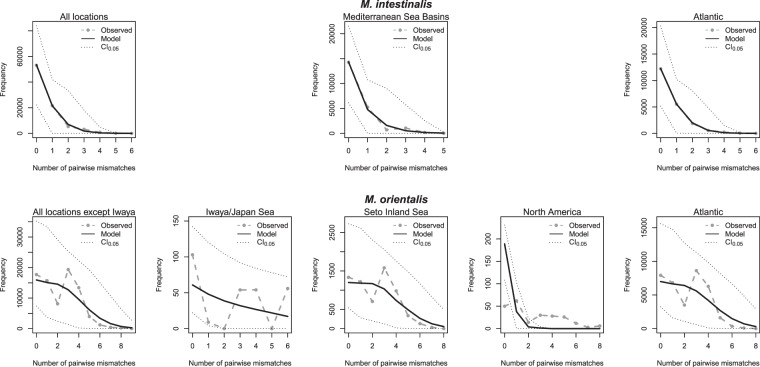
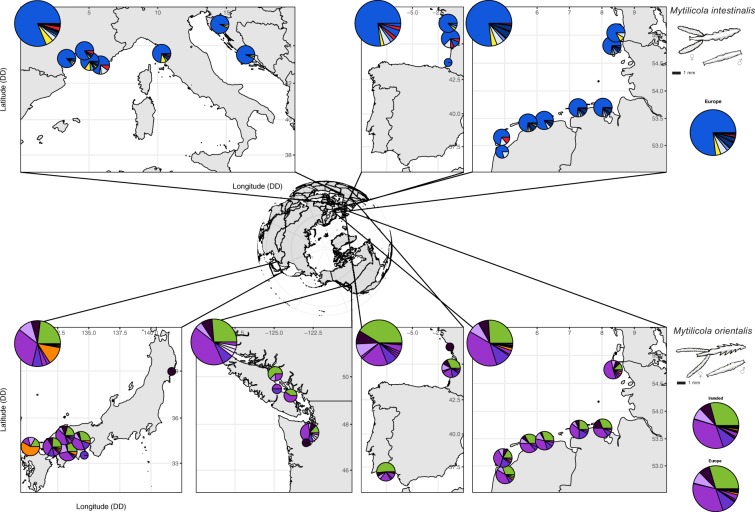
Invasive species, and especially invasive parasites, represent excellent models to study ecological and evolutionary mechanisms in the wild. To understand these processes, it is crucial to obtain more knowledge on the native range, invasion routes and invasion history of invasive parasites. We investigated the consecutive invasions of two parasitic copepods (Mytilicola intestinalis and Mytilicola orientalis) by combining an extensive literature survey covering the reported putative native regions and the present-day invaded regions with a global phylogeography of both species. The population genetic analyses based on partial COI sequences revealed significant population differentiation for M. orientalis within the native region in Japan, while introduced populations in North America and Europe could not be distinguished from the native ones. Thus, M. orientalis' invasion history resembles the genetic structure and recent spread of its principal host, the Pacific oyster, Crassostrea gigas, while M. intestinalis lacks population genetic structure and has an overall low genetic diversity. Therefore, the native origin of M. intestinalis remains unclear. With this study, we demonstrate that even highly related and biologically similar invasive species can differ in their invasion genetics. From this, we conclude that extrapolating invasion genetics dynamics from related invasive taxa may not always be possible.
Conflict of interest statement
The authors declare no competing interests.
Figures


Similar articles
-
Cryptic invasion of a parasitic copepod: Compromised identification when morphologically similar invaders co-occur in invaded ecosystems.PLoS One. 2018 Mar 14;13(3):e0193354. doi: 10.1371/journal.pone.0193354. eCollection 2018. PLoS One. 2018. PMID: 29538388 Free PMC article.
-
Trophic relationship between the invasive parasitic copepod Mytilicola orientalis and its native blue mussel (Mytilus edulis) host.Parasitology. 2018 May;145(6):814-821. doi: 10.1017/S0031182017001779. Epub 2017 Nov 29. Parasitology. 2018. PMID: 29183410
-
Unraveling the biogeographic origins of the Eurasian watermilfoil (Myriophyllum spicatum) invasion in North America.Am J Bot. 2016 Apr;103(4):709-18. doi: 10.3732/ajb.1500476. Epub 2016 Mar 31. Am J Bot. 2016. PMID: 27033316
-
Genetic reconstructions of invasion history.Mol Ecol. 2015 May;24(9):2212-25. doi: 10.1111/mec.13117. Epub 2015 Mar 25. Mol Ecol. 2015. PMID: 25703061 Review.
-
The population biology of fungal invasions.Mol Ecol. 2015 May;24(9):1969-86. doi: 10.1111/mec.13028. Epub 2015 Jan 7. Mol Ecol. 2015. PMID: 25469955 Review.
Cited by
-
Warming effects on the life cycles of two parasitic copepods with different invasion histories.Ecol Evol. 2024 Jun 25;14(6):e11485. doi: 10.1002/ece3.11485. eCollection 2024 Jun. Ecol Evol. 2024. PMID: 38932946 Free PMC article.
References
-
- Ehrenfeld, J. G. Ecosystem consequences of biological invasions. Annu. Rev. Ecol. Evol. Syst. 41, 59–80 (2010).
-
- Reaser JK, et al. Ecological and socioeconomic impacts of invasive alien species in island ecosystems. Environ. Conserv. 2007;34:98–111. doi: 10.1017/S0376892907003815. - DOI
Publication types
MeSH terms
LinkOut - more resources
Full Text Sources
