. 2019 Sep 4;9(1):12729.
doi: 10.1038/s41598-019-49156-3.

Phospholipase C-related catalytically inactive protein regulates cytokinesis by protecting phosphatidylinositol 4,5-bisphosphate from metabolism in the cleavage furrow

Affiliations

Phospholipase C-related catalytically inactive protein regulates cytokinesis by protecting phosphatidylinositol 4,5-bisphosphate from metabolism in the cleavage furrow

Satoshi Asano et al. Sci Rep. .

Abstract

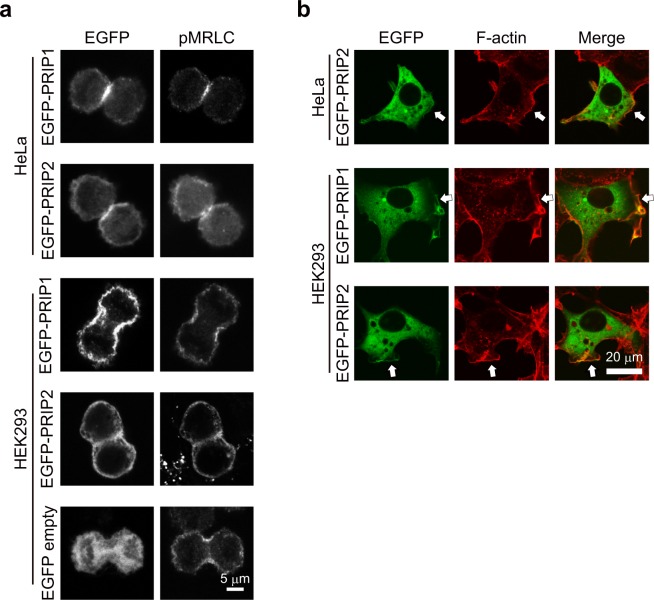
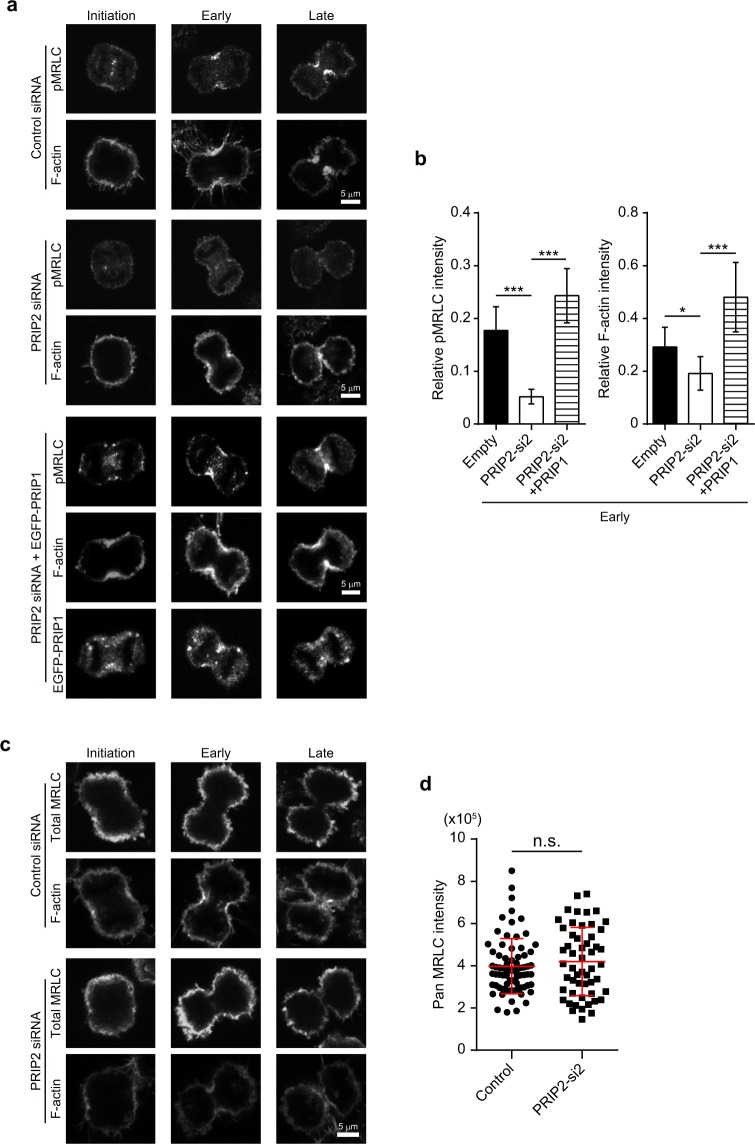
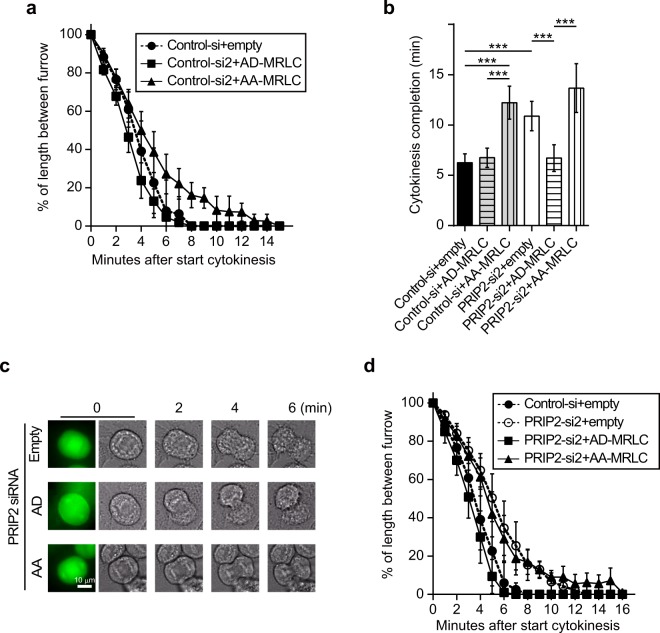
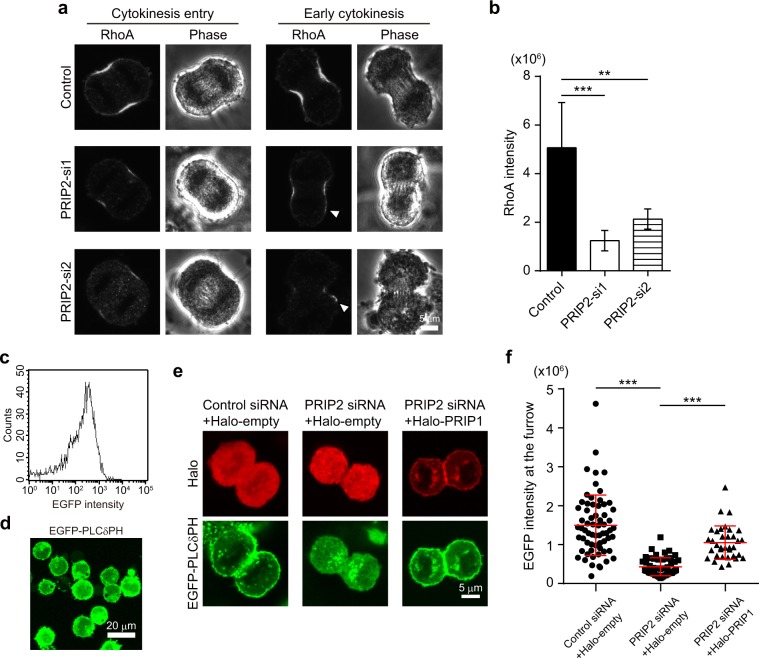
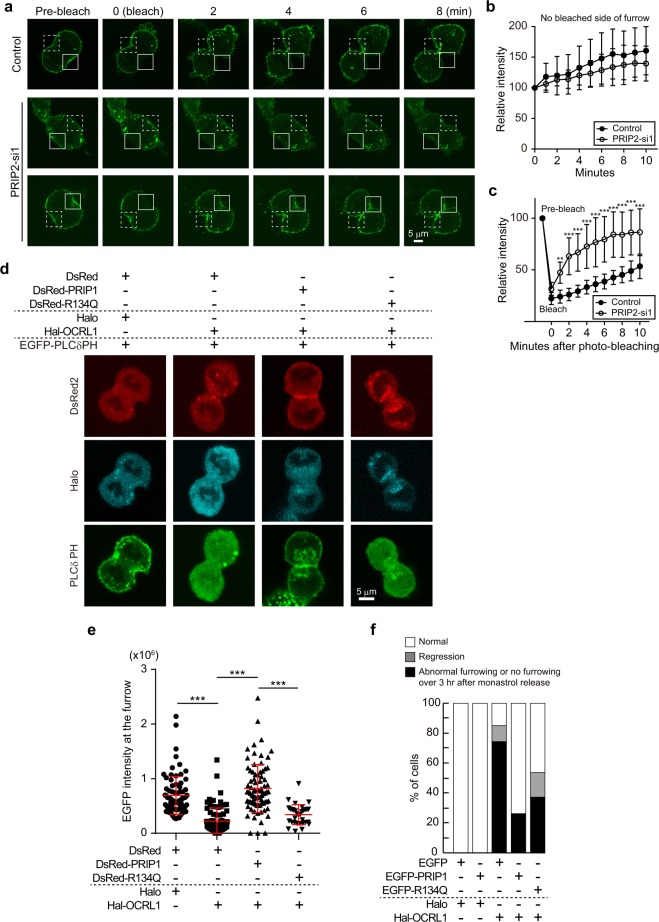
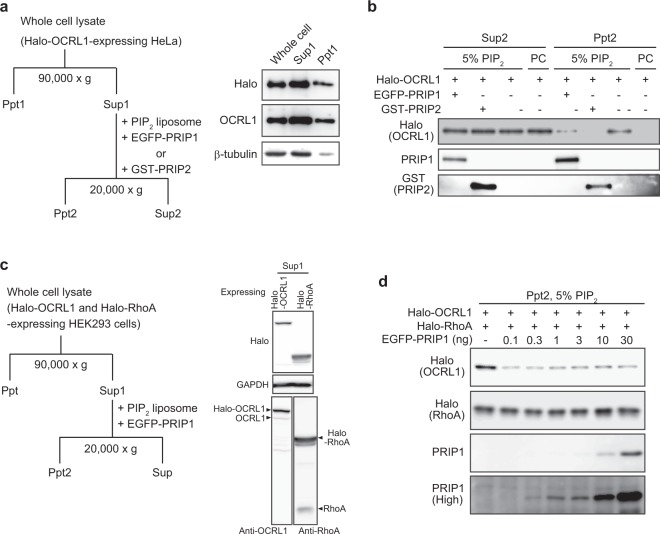
Cytokinesis is initiated by the formation and ingression of the cleavage furrow. Phosphatidylinositol 4,5-bisphosphate [PI(4,5)P2] accumulation followed by RhoA translocation to the cleavage furrow are prerequisites for cytokinesis progression. Here, we investigated whether phospholipase C (PLC)-related catalytically inactive protein (PRIP), a metabolic modulator of PI(4,5)P2, regulates PI(4,5)P2-mediated cytokinesis. We found that PRIP localised to the cleavage furrow during cytokinesis. Moreover, HeLa cells with silenced PRIP displayed abnormal cytokinesis. Importantly, PI(4,5)P2 accumulation at the cleavage furrow, as well as the localisation of RhoA and phospho-myosin II regulatory light chain to the cleavage furrow, were reduced in PRIP-silenced cells. The overexpression of oculocerebrorenal syndrome of Lowe-1 (OCRL1), a phosphatidylinositol-5-phosphatase, in cells decreased PI(4,5)P2 levels during early cytokinesis and resulted in cytokinesis abnormalities. However, these abnormal cytokinesis phenotypes were ameliorated by the co-expression of PRIP but not by co-expression of a PI(4,5)P2-unbound PRIP mutant. Collectively, our results indicate that PRIP is a component at the cleavage furrow that maintains PI(4,5)P2 metabolism and regulates RhoA-dependent progression of cytokinesis. Thus, we propose that PRIP regulates phosphoinositide metabolism correctively and mediates normal cytokinesis progression.


Conflict of interest statement

The authors declare no competing interests.

Figures

Figure 1
Figure 1
Accumulation of PRIP at the cleavage furrow during cytokinesis. (a,b) EGFP-PRIP signals were detected in HeLa and HEK293 cells during cytokinesis (a) and interphase (b). pMRLC (a) and F-actin (b) were stained with an anti-phospho-MRLC antibody followed by an Alexa Fluor 594-conjugated secondary antibody and ActinRed 555 ReadyProbes reagent, respectively. Images were obtained by confocal microscopy. Arrows in (b) show the presence of PRIP on F-actin on the inner face of the plasma membrane. Similar images were satisfactorily obtained from more than three independent experiments.
Figure 2
Figure 2
PRIP participates in the formation and ingression of the cleavage furrow. (a) Success of PRIP2 silencing in HeLa cells analysed by western blotting using the indicated antibodies. β-actin was used as a loading control. Control siRNA (Control-si) and PRIP2 siRNAs (PRIP2-si1 and PRIP2-si2) were used. Each of the original blots is shown in Supplementary Fig. S7a,b. (bd) A time course analysis of dividing HeLa cells via time-lapse image analyses. The experiments were repeated at least three times, and a set of representative time-lapse images is shown in (b). The Arabic numerals in (b) indicate times (min) after the removal of monastrol from culture media. The frequency of the type of cytokinesis failure (normal: a dividing cell; regression: a cell starting a furrow ingression but not undergoing complete cytokinesis; abnormal furrowing: a cell having asymmetric furrow formation and ingression in the midzone) was analysed in over 230 HeLa cells (c). The distribution of cytokinesis onset time is shown in (d). The y axis of the graph indicates the percentage of cells with furrow measured at each time interval divided by the total mitotic cell number. (eh) Aberration of cytokinesis in PRIP-silenced HeLa cells and restoration by PRIP gene transfection. Cells were transfected with the indicated siRNAs together with EGFP vector (empty), EGFP-Prip1 (PRIP1), or EGFP-PRIP2 (PRIP2). Representative time-lapse series of fluorescence images during furrow ingression are shown (e). The experiments were repeated at least three times. Data are presented as relative furrow ingression [see the schematic diagram in (f)]. The y axis of the graphs in (f) and (g) indicates the percentage of distance (Ln) between the two constricting poles measured at each time point divided by initial distance (L0) at the beginning of cytokinesis. Mean time to the completion of furrowing in (f,g) is shown in (h). The data are presented as the means ± SD (n > 20 for each group). ***p < 0.001 (Kruskal–Wallis test followed by Dunn’s multiple comparison test).
Figure 3
Figure 3
PRIP regulates MRLC phosphorylation at the cleavage furrow during cytokinesis. (ad) HeLa cells were transfected with a control siRNA (a,c, upper panels), PRIP2-si2 (a, middle panels; c, lower panels), or PRIP2-si2 together with EGFP-tagged Prip1 (a, lower panels). Phosphorylated MRLC (pMRLC) (a), pan MRLC (c), and F-actin (a,c) were stained with an anti-phospho-MRLC antibody, anti-total MRLC antibody, and Alexa Fluor 350-labelled phalloidin, respectively. The images were obtained by confocal microscopy. Representative set of images is shown during cytokinesis [initiation phase, and early and late stages in furrow ingression] in (a,c). Graphs in (b) show the relative fluorescence intensity of pMRLC (left panel) and F-actin (right panel) at the cleavage furrow in an early stage of furrow ingression. The relative fluorescence intensity (y axis) was defined as the fluorescence intensity of pMRLC or F-actin in the cleavage furrow divided by the total intensity of pMRLC or F-actin in the cell, respectively. The data are presented as the mean ± SD (n = 46 for each group). *p < 0.05, ***p < 0.001 (Kruskal–Wallis test followed by Dunn’s multiple comparison test). Graph in (d) shows the fluorescence intensity (arbitrary units) of pan MRLC at the cleavage furrow. The data are presented as the means ± SD (n > 60 for each group). n.s.: not significant (Student’s t-test).
Figure 4
Figure 4
A phospho-mimic MRLC mutant restores delayed cytokinesis progression in PRIP-silenced HeLa cells. (ad) Progression of furrow ingression was observed in HeLa cells transfected with the indicated siRNAs together with EGFP vector (empty), EGFP-AD-MRLC (AD-MRLC), or EGFP-AA-MRLC (AA-MRLC). The polygonal line graphs in (a,d) show calculation results; i.e., the measured width of the cleavage furrow divided by the initial width (0 min). The bar graphs in (b) represent the mean time to completion of furrowing in (a,d). A set of representative time-lapse images is shown in (c). Each experiment was performed at least three times (ad), and more than twenty images displaying similar features were obtained (c). The data are presented as the means ± SD [n ≥ 20 for each group (a,b,d)]. ***p < 0.001 (Kruskal–Wallis test followed by Dunn’s multiple comparison test).
Figure 5
Figure 5
PRIP regulates the accumulation of RhoA and coordinates PI(4,5)P2 levels at the cleavage furrow. (a,b) Transfection with PRIP2-si1 or PRIP2-si2 inhibits RhoA accumulation at the cleavage furrow in HeLa cells. Representative images in a stage of cytokinesis (cytokinesis entry and early cytokinesis) are shown in (a). RhoA signals were visualised using a specific antibody. Arrowheads in (a) indicate abnormal localisation of RhoA. Graph in (b) shows the fluorescence intensity (arbitrary units) of RhoA at the cleavage furrow in early cytokinesis. The data are presented as the mean ± SD (n = 45 for each group). **p < 0.01, ***p < 0.001 (Kruskal–Wallis test followed by Dunn’s multiple comparison test). (c–f) PRIP2 silencing inhibits PI(4,5)P2 accumulation at the cleavage furrow in HEK293 cells. HEK293 cells stably expressing EGFP-tagged pleckstrin homology domain of PLCδ1 (EGFP-PLCδPH) were transfected with the indicated siRNAs (e,f) together with Halo-tagged vector (Halo-empty) or Halo-tagged PRIP1 (Halo-PRIP1) (e,f). Analyses of EGFP intensity of the cells were performed by flow cytometry (c). The cells were trypsinised and observed (d). (e,f) Representative images of EGFP-PLCδPH and Halo-tagged proteins in a stage of cytokinesis are shown in (e). Graph in (f) presents the mean intensity of EGFP in the cleavage furrow ± SD (n > 60 for each group). ***p < 0.001 (Kruskal–Wallis test followed by Dunn’s multiple comparison test).
Figure 6
Figure 6
PRIP maintains PI(4,5)P2 at the cleavage furrow and appropriately manages PI(4,5)P2-dependent cytokinesis progression. (ac) A time-lapse experiment using stably EGFP-PLCδPH-expressing HEK293 cells and fluorescence recovery after photobleaching (FRAP) analysis. The bleached area (or the pre-bleached area in 0–8 min panels) and non-bleached furrow region are outlined by a white square and a white dotted square on a set of representative images in (a), respectively. Representative images of PRIP2-si1-treated cells are shown as two data sets, a delayed cytokinesis phenotype (middle panel set) and a slightly delayed cytokinesis phenotype (bottom panel set) compared with conventional cytokinesis (control, upper panel set). The graphs in (b,c) present the relative fluorescence intensity of EGFP-PLCδPH [normalised to the value at time 0 (b) or the pre-bleach value (c)] on the non-bleached side of the furrow (b) or bleached cleavage furrow (c) at each time point. The data are presented as the means ± SD (n > 20 for each group). **p < 0.01, ***p < 0.001 versus the control value at each time point (Kruskal–Wallis test followed by Dunn’s multiple comparison test). (d,e) HEK293 cells stably expressing EGFP-tagged PLCδPH were transfected with indicated constructs. Representative images at a stage of cytokinesis are shown in (d). Graph in (e) shows the EGFP fluorescence intensity (arbitrary units) at the cleavage furrow. The data are presented as the mean ± SD (n > 45 for each group]. ***p < 0.001 (Kruskal–Wallis test followed by Dunn’s multiple comparison test). (f) MCF-7 cells stably expressing control vector (EGFP), EGFP-tagged PRIP, or EGFP-tagged PRIP1(R134Q) were co-transfected with Halo-tagged OCRL1 or Halo-tag vector. Quantitative analysis of cytokinetic abnormalities in OCRL1-transfected MCF-7 cells with indicated PRIP1 mutants were evaluated at 3 h after release from monastrol. Each experiment was repeated at least three times (n > 30 for each group).
Figure 7
Figure 7
PRIP prevents PI(4,5)P2 recognition by OCRL1 but not by RhoA. (ad) PI(4,5)P2 sedimentation assay was performed in a combination of EGFP-PRIP1, GST-PRIP2, Halo-OCRL1, and Halo-RhoA (a,c). Supernatant 1 (Sup1) contained Halo-OCRL1 (a) or Halo-OCRL1 and Halo-RhoA (c), as confirmed by immunoblotting using indicated antibodies. The fractions of Sup1 in (a or c) precipitated with liposomes [PC, 100% PC; 5% PIP2, PI(4,5)P2:PC = 5:95 (molar ratio)] in the presence (+) or absence (−) of recombinant PRIP1 or PRIP2 (b) or with liposomes (5% PIP2) in the presence of indicated doses of recombinant PRIP1 (d) by centrifugation, respectively. Western blotting of the obtained pellet fraction (Ppt2, b or d) and supernatant (Sup2, b) was performed using indicated antibodies (left side of each panel). Similar data were obtained from three independent experiments, and a set of representative images is shown. The image obtained in a high sensitivity mode (high, d) is shown. Each of the original blots is shown in Supplementary Fig. S8 for (df) or Supplementary Fig. S9 for (b).

Similar articles

Cited by

References

    1. Brill JA, Wong R, Wilde A. Phosphoinositide function in cytokinesis. Curr. Biol. 2011;21:R930–934. doi: 10.1016/j.cub.2011.10.001. - DOI - PubMed
    1. Emoto K, Inadome H, Kanaho Y, Narumiya S, Umeda M. Local change in phospholipid composition at the cleavage furrow is essential for completion of cytokinesis. J. Biol. Chem. 2005;280:37901–37907. doi: 10.1074/jbc.M504282200. - DOI - PubMed
    1. Abe M, et al. A role for sphingomyelin-rich lipid domains in the accumulation of phosphatidylinositol-4,5-bisphosphate to the cleavage furrow during cytokinesis. Mol. Cell. Biol. 2012;32:1396–1407. doi: 10.1128/MCB.06113-11. - DOI - PMC - PubMed
    1. Kolay S, Basu U, Raghu P. Control of diverse subcellular processes by a single multi-functional lipid phosphatidylinositol 4,5-bisphosphate [PI(4,5)P2] Biochem. J. 2016;473:1681–1692. doi: 10.1042/BCJ20160069. - DOI - PMC - PubMed
    1. Field SJ, et al. PtdIns(4,5)P2 functions at the cleavage furrow during cytokinesis. Curr. Biol. 2005;15:1407–1412. doi: 10.1016/j.cub.2005.06.059. - DOI - PubMed

Publication types

MeSH terms

Substances