. 2019 Sep 4;10(1):3987.
doi: 10.1038/s41467-019-11773-x.

The poly-SUMO2/3 protease SENP6 enables assembly of the constitutive centromere-associated network by group deSUMOylation

Affiliations

The poly-SUMO2/3 protease SENP6 enables assembly of the constitutive centromere-associated network by group deSUMOylation

Frauke Liebelt et al. Nat Commun. .

Abstract

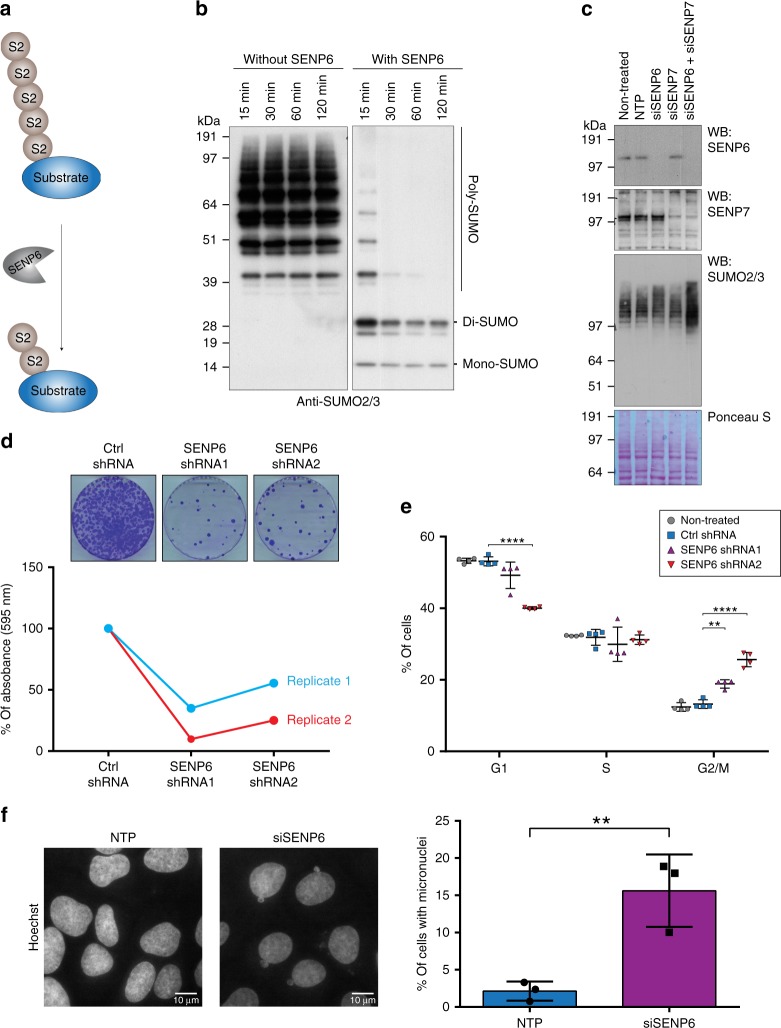
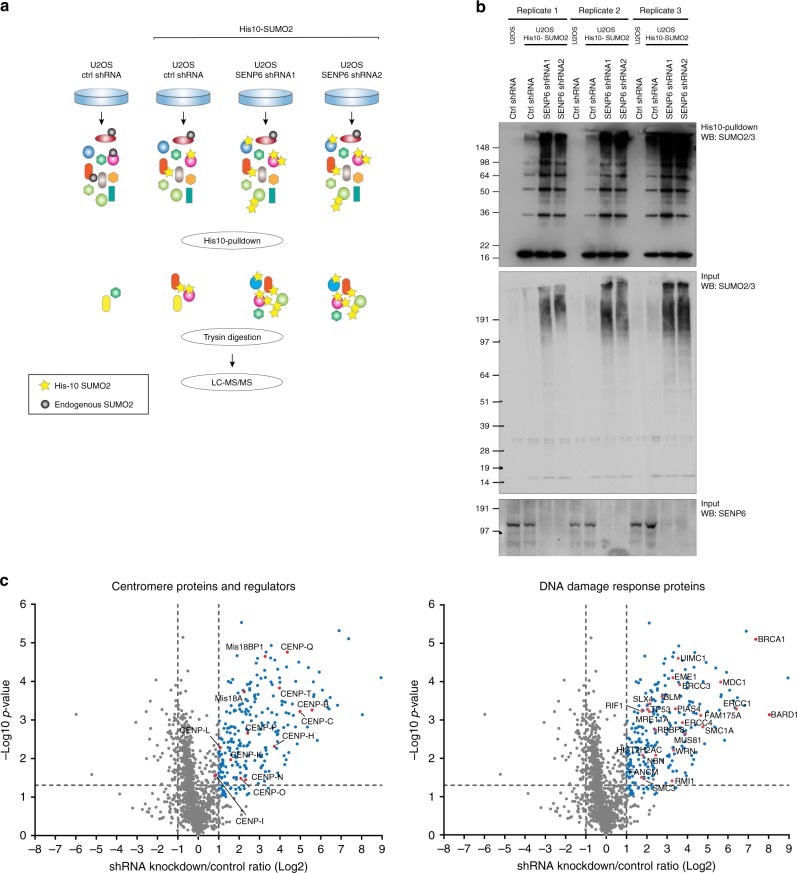
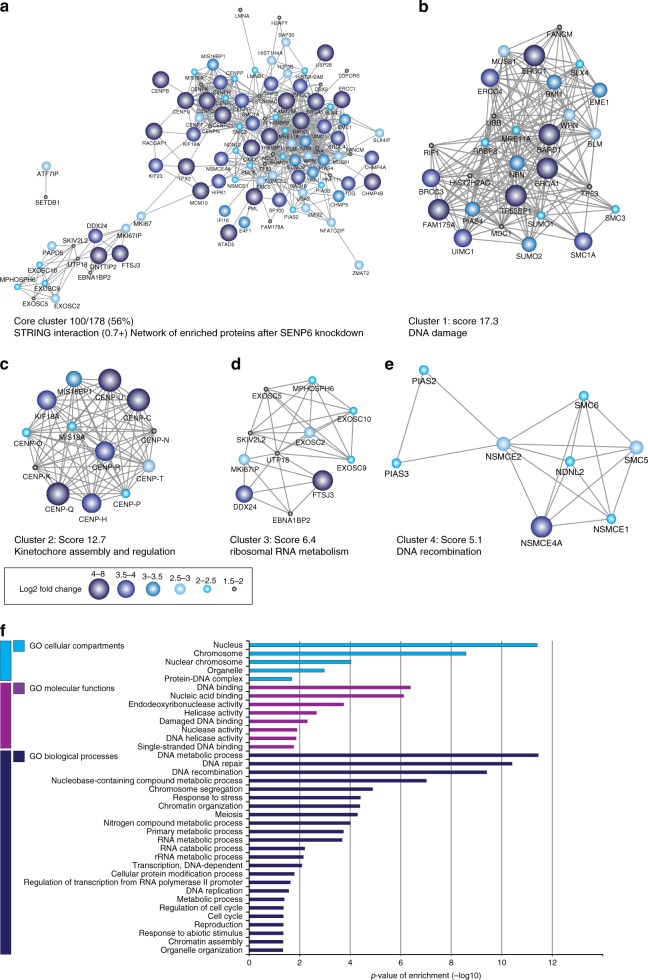
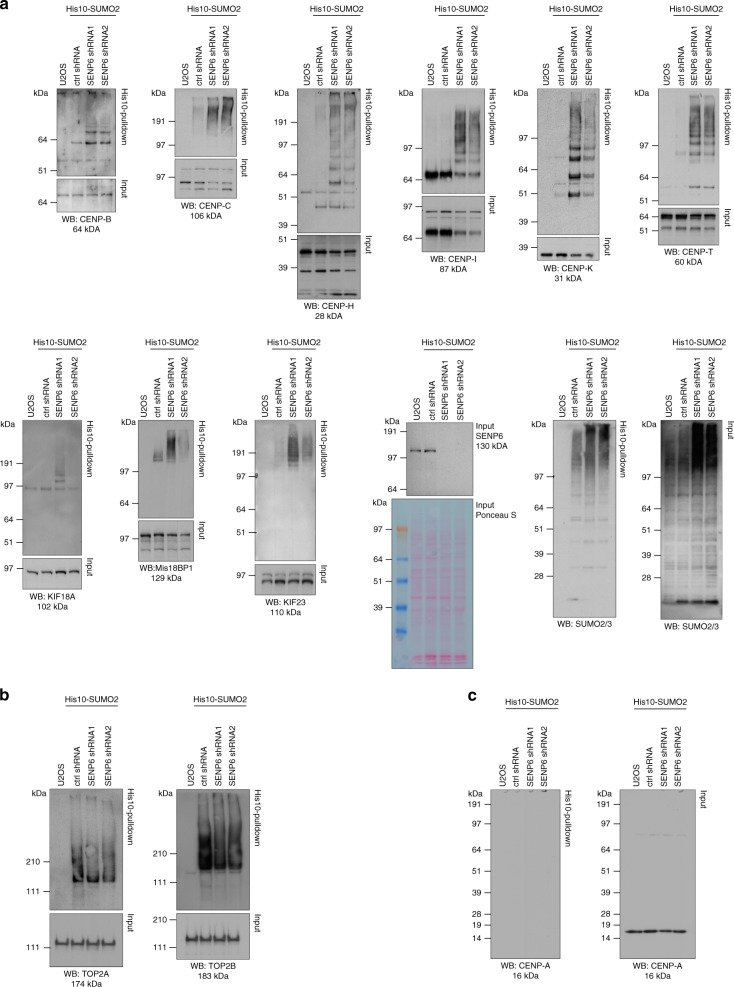
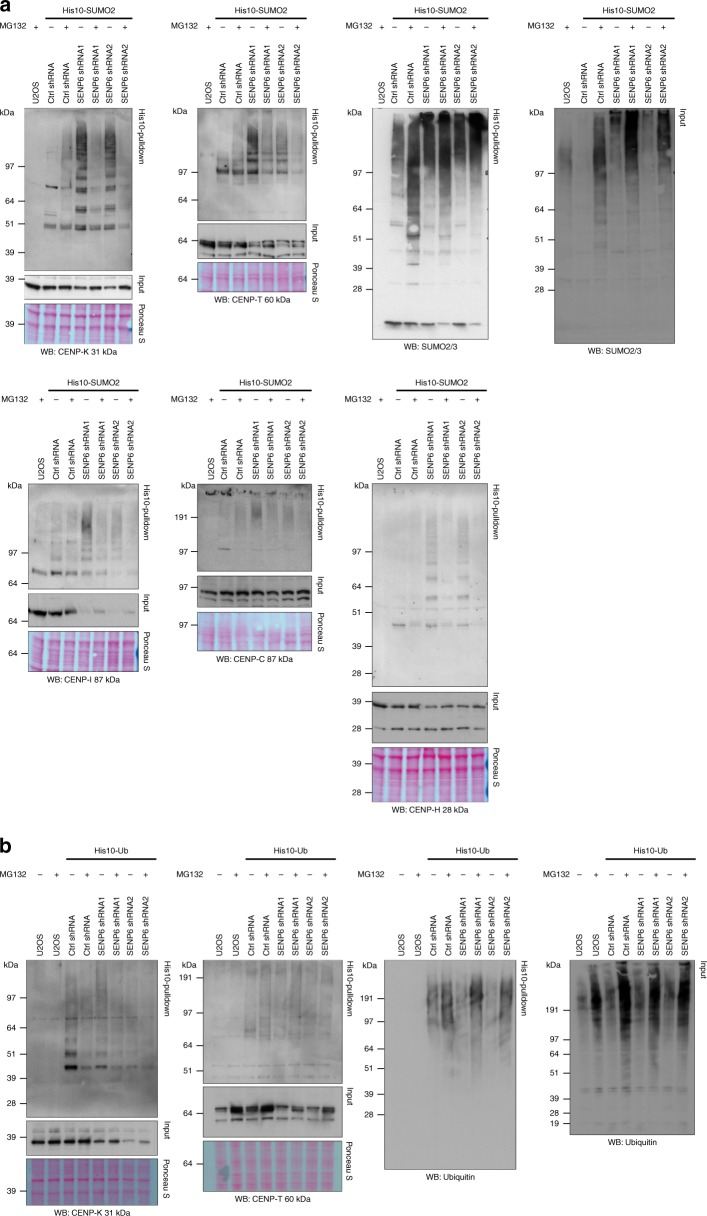
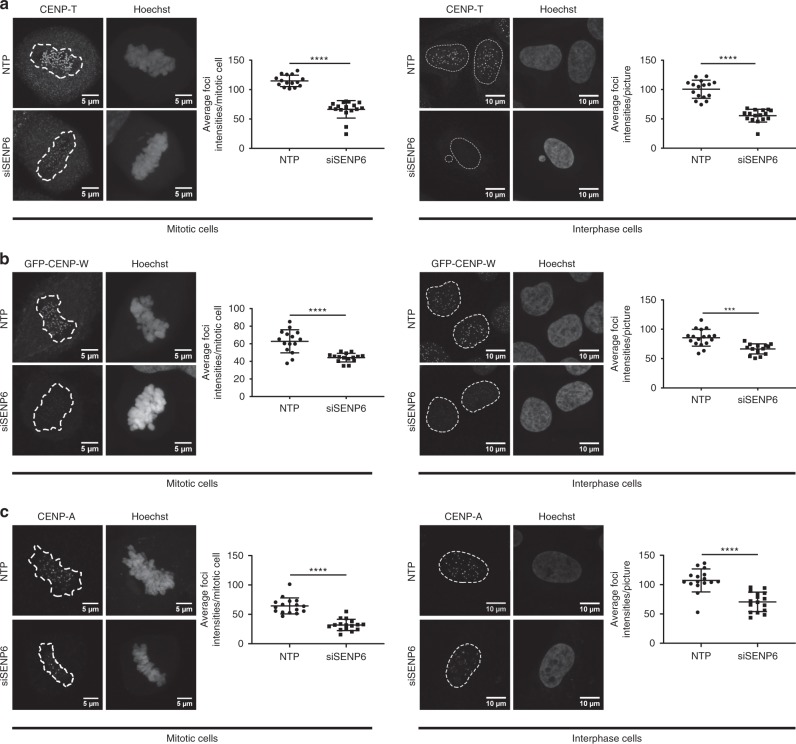
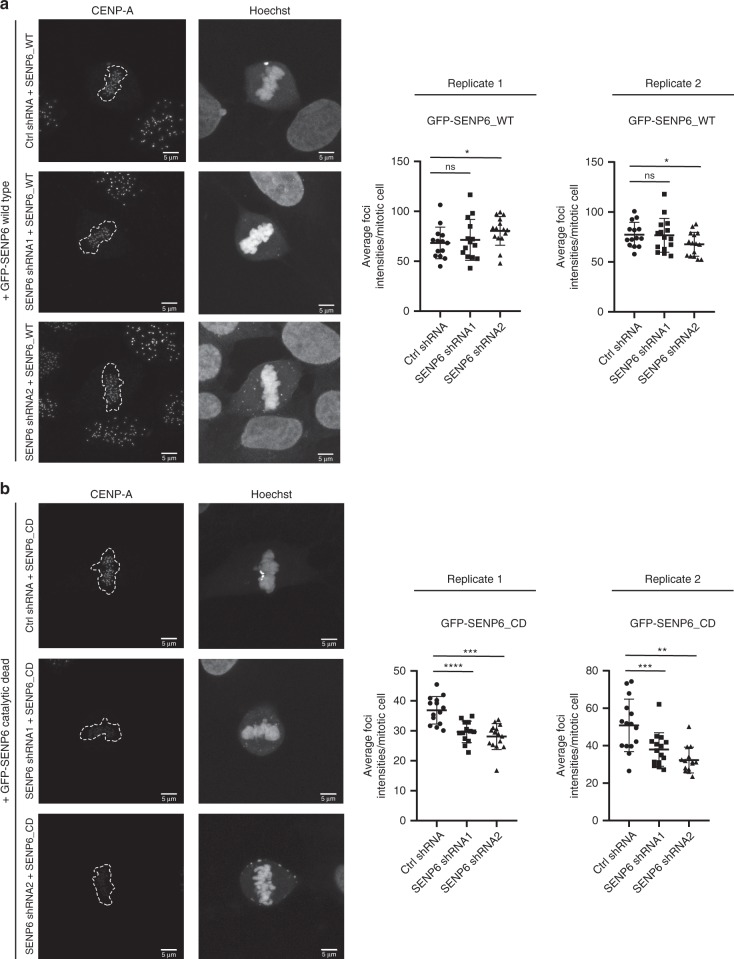
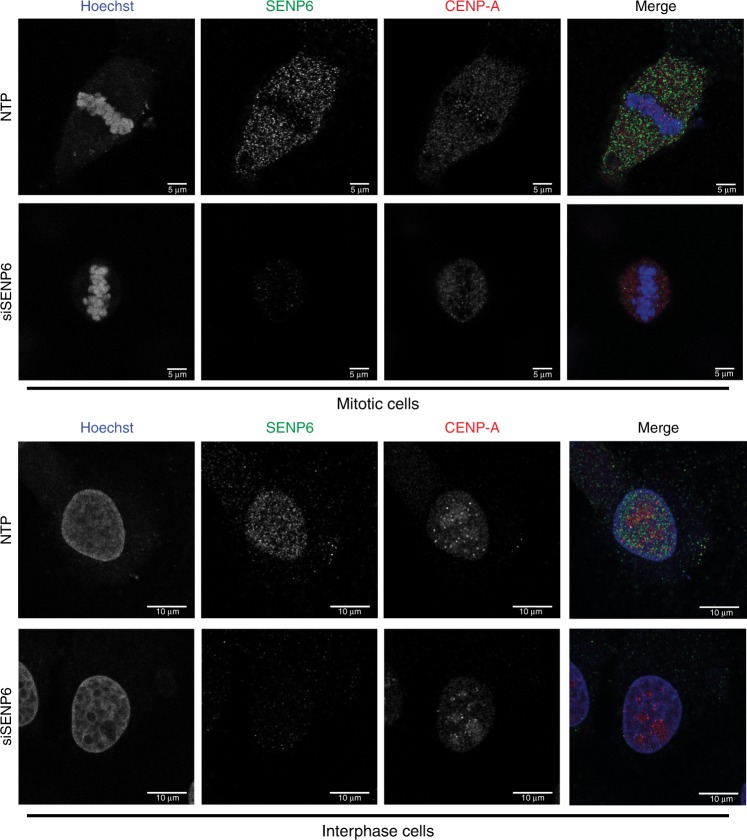
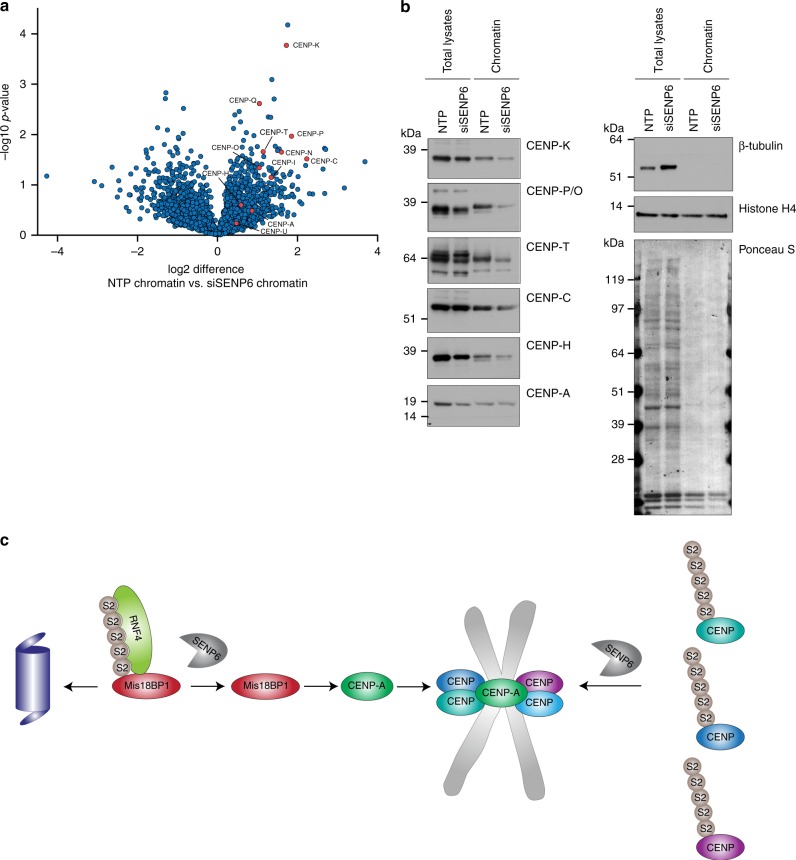
In contrast to our extensive knowledge on ubiquitin polymer signaling, we are severely limited in our understanding of poly-SUMO signaling. We set out to identify substrates conjugated to SUMO polymers, using knockdown of the poly-SUMO2/3 protease SENP6. We identify over 180 SENP6 regulated proteins that represent highly interconnected functional groups of proteins including the constitutive centromere-associated network (CCAN), the CENP-A loading factors Mis18BP1 and Mis18A and DNA damage response factors. Our results indicate a striking protein group de-modification by SENP6. SENP6 deficient cells are severely compromised for proliferation, accumulate in G2/M and frequently form micronuclei. Accumulation of CENP-T, CENP-W and CENP-A to centromeres is impaired in the absence of SENP6. Surprisingly, the increase of SUMO chains does not lead to ubiquitin-dependent proteasomal degradation of the CCAN subunits. Our results indicate that SUMO polymers can act in a proteolysis-independent manner and consequently, have a more diverse signaling function than previously expected.


Conflict of interest statement

The authors declare no competing interests.

Figures

Fig. 1
Fig. 1
SENP6 is important for cell proliferation and cell cycle progression. a SENP6 cleaves poly-SUMO2/3 from target substrates. b Recombinant poly-SUMO2/3 was treated in vitro with recombinant SENP6 for the indicated time and immunoblotting was performed using a SUMO2/3 specific antibody. c U2OS cells were left untreated or transfected with either a pool of four siRNAs against SENP6 (siSENP6), SENP7 (siSENP7), a combination of both or a pool of four nontargeting siRNAs (NTP). Cell lysates were analysed 2 days post transfection by immunoblotting using antibodies against SENP6, SENP7, and SUMO2/3. d U2OS cells were infected with lentiviruses encoding shRNAs against SENP6 or a nontargeting control (ctrl) shRNA. Colony formation was determined by crystal violet staining. Line graphs represent the absorbance of solubilized crystal violet of two independent biological replicates (n = 2 independent experiments). e Scatter plot showing the percentages of HeLa cells in each cell-cycle phase (G1, S, and G2/M) of four biological replicates (n = 4 independent experiments). HeLa cells were treated with lentiviruses as in panel d. Cells were fixed and prepared for flow cytometry analysis 4 days post infection. Gray circles represent nontreated cells, blue squares represent control (ctrl) shRNA, purple triangles represent SENP6 shRNA1, red triangles = SENP6 shRNA2. Error bars represent standard deviation and p-values are derived from two-sided two samples t-tests and FDR corrected. **p < 0.01, ***p < 0.0001. f U2OS cells were treated either with a pool of four siRNAs against SENP6 (siSENP6, purple bar) or NTP control (blue bar). Cells were fixed for microscopy 2 days post transfection and nuclei were stained with Hoechst. Ten pictures per condition of three biological replicates were taken. Total amounts of interphase nuclei and amounts of nuclei associated with one or more micronuclei were counted. Representative micrographs are shown. Scale bars = 10 µm. The bar graph shows the average percentage of cells that were associated with micronuclei over three biological replicates. Error bars represent standard deviations and the p-value is derived from a two-sided two-sample t-test with n = 3 independent experiments. **p < 0.01. Source data are provided as a Source Data file
Fig. 2
Fig. 2
Identification of target proteins regulated by SUMO polymers. a Experimental set up for the identification of SENP6-regulated proteins. U2OS cells stably expressing His10-SUMO2 were infected with lentiviruses encoding shRNAs targeting SENP6 or a nontargeting control (ctrl) shRNA. Cells were lysed 3 days post infection and SUMOylated proteins were enriched by means of Ni-NTA pulldown. Enriched SUMOylated proteins were trypsin digested and prepared for label-free quantitative mass spectrometry. Peptides were identified by LC–MS/MS. The four experimental conditions of three biological replicates were analysed in two technical repeats per sample, resulting in a total of 24 MS runs. Black circles represent endogenous SUMO, yellow stars represent exogenous His10-SUMO2. b Immunoblot analysis of the three biological replicates analyzed by mass spectrometry. An antibody against SUMO2/3 was used to confirm efficient enrichment of SUMO conjugates and an increase of SUMO conjugates upon SENP6 knockdown. An antibody against SENP6 was used to confirm efficient knockdown. c Volcano plot showing all identified proteins within the SENP6 knockdown samples compared with the nontargeted control shRNA. Dashed lines indicate a cutoff at twofold change (log2 = 1) and a p-value of 0.05 (−log10 = 1.3), n = 3 independent experiments. SUMOylated proteins represented as blue circles were more abundant after SENP6 knockdown. The left panel shows identified centromere proteins and protein involved in centromere regulation represented by red circles, whereas the right panel shows DNA damage response proteins represented in red circles. Source data are provided as a Source Data file
Fig. 3
Fig. 3
SENP6 demonstrates group deSUMOylation activity. a STRING network analysis of enriched proteins after SENP6 knockdown, with a STRING interaction confidence of 0.7 or higher. Cytoscape software was used to visualize the interaction network. Color and node size indicate the fold-change differences in abundance after SENP6 knockdown compared with the nontargeting control. b MCODE was used to extract the most highly interconnected clusters form the network shown in a. Cluster 1 contains multiple proteins involved in DNA damage response. c Cluster 2 includes multiple kinetochore and kinetochore-associated proteins. d Cluster 3 includes proteins that are involved in ribosomal RNA metabolism. e Cluster 4 contains proteins associated with DNA recombination and the SUMOylation pathway. f Gene Ontology (GO) enrichment analysis of SENP6-regulated proteins. The bar graph shows the most significantly overrepresented GO terms for biological processes (BP) in dark blue, molecular functions (MF) in purple, and cellular compartments (CC) in light blue compared against the annotated human proteome. Source data are provided as a Source Data file
Fig. 4
Fig. 4
Immunoblot validation of proteins identified by mass spectrometry. a U2OS cells stably expressing His10-SUMO2 were infected with lentiviruses encoding shRNAs against SENP6 or a nontargeting control shRNA (ctrl shRNA). Cells were lysed 3 days post infection and SUMOylated proteins were enriched by means of Ni-NTA pulldown. Inputs and His10-pulldown elutions were analysed by immunoblotting with the indicated antibodies. SENP6 and SUMO antibodies were used as control for efficient knockdown of SENP6 and increase of SUMO conjugates. b Samples as in a were analysed by immunoblotting against Topoisomerases IIα (TOP2A) and IIβ (TOP2B) that did not show increased SUMOylation in the mass spectrometry screening. c Samples as in a and b were analysed by immunoblotting against CENP-A. Source data are provided as a Source Data file
Fig. 5
Fig. 5
Poly-SUMOylation does not lead to destabilization of CCAN proteins. a U2OS cells stably expressing His10-SUMO2 were infected with lentiviruses encoding shRNAs against SENP6 or a nontargeting control shRNA (ctrl shRNA) 3 days prior to lysis. Where indicated, cells were treated with 10 µM MG132 for 4 h prior to lysis. Cells were lysed and SUMOylated proteins were enriched by means of Ni-NTA pulldown. Inputs and His10-pulldown elutions were analysed by immunoblotting with the indicated antibodies. Equal loading was verified by Ponceau S staining. b U2OS cells stably expressing His10-ubiquitin were infected with lentiviruses encoding shRNAs against SENP6 or a nontargeting control shRNA (ctrl shRNA) 3 days prior to lysis. Where indicated cells were treated with 10 µM MG132 for 4 h prior to lysis. Cells were lysed and ubiquitinated proteins were enriched by means of Ni-NTA pulldown. Inputs and His10-pulldown elutions were analysed by immunoblotting with the indicated antibodies. Equal loading was verified by Ponceau S staining. Source data are provided as a Source Data file
Fig. 6
Fig. 6
Poly-SUMO2/3 prevents accumulation of CCAN proteins at centromeres. a U2OS cells were transfected either with a pool of four siRNAs against SENP6 (siSENP6) or a pool of four nontargeting siRNAs (NTP). Cells were fixed and stained with Hoechst to visualize DNA and CENP-T antibody 2 days post transfection. Panels show representative pictures of mitotic (left panel) and interphase cells (right panel). Scatter plots show quantifications of the average CENP-T foci intensities per cell (for mitotic cells) or per picture (for interphase cells). A two-sided t-test was performed. ****p < 0.0001. n (NTP mitotic cells) = 15; n (siSENP6 mitotic cells) = 16; n (NTP interphase cells) = 16; n (siSENP6 interphase cells) = 16. Dashed lines indicate areas of DNA. b U2OS cells stably expressing GFP-CENP-W were treated as in panel a. Cells were fixed and stained with Hoechst to visualize DNA and GFP antibody to enhance GFP signal. Left panels show representative pictures of mitotic (left panels) and interphase cells (right panels). Scatter plots show quantifications of the average CENP-W foci intensities per cell (for mitotic cells) or per picture (for interphase cells). A two-sided t-test was performed. ****p < 0.0001; ***p < 0.001. n (NTP mitotic cells) = 15; n (siSENP6 mitotic cells) = 15; n (NTP interphase cells) = 16; n (siSENP6 interphase cells) = 16. c U2OS cells were treated as in panel a, fixed and stained with Hoechst to visualize DNA and CENP-A antibody 2 days post transfection. Panels show representative pictures of mitotic (left panel) and interphase cells (right panel). Scatter plots show quantifications of the average intensities of CENP-A foci per cell (for mitotic cells) or per picture (for interphase cells). A two-sided t-test was performed. ****p < 0.0001. n (NTP mitotic cells) = 16, n (siSENP6 mitotic cells) = 16; n (NTP interphase cells) = 16, n (siSENP6 interphase cells) = 16. Dashed lines indicate areas of DNA. Scale bars = 5 µm (mitotic cells), 10 µm (interphase cells). All error bars shown represent standard deviation (SD). Source data are provided as a Source Data file
Fig. 7
Fig. 7
CCAN protein localization at the centromere depends on catalytic activity of SENP6. Knockdown of SENP6 can be rescued by reintroduction of wild-type SENP6, but not by reintroduction of catalytic dead SENP6. a, b U2OS cells stably expressing inducible shRNA-resistant GFP-tagged wild type (WT) (a) or catalytic dead (CD) SENP6 (b) were established. Expression of these constructs was induced by doxycycline for 24 h prior to transduction with lentiviruses encoding SENP6 shRNAs. Medium was replaced 1 day post infection. The next day, cells were seeded on coverslips and grown overnight. Subsequently, cells were fixed and stained with Hoechst to visualize DNA and CENP-A antibody. Panels show representative pictures of mitotic cells. Scatter plots show quantifications of the average CENP-A foci intensities per cell for two independent replicates. The data were statically analysed by two-sided t-test. *p < 0.05; **p < 0.01; ***p < 0.001, ****p < 0.0001. For a replicate 1: n (ctrl shRNA) = 14 cells, n (SENP6 shRNA1) = 14 cells; n (SENP6 shRNA2) = 15 cells; replicate 2: n (ctrl shRNA) = 14 cells, n (SENP6 shRNA1) = 15 cells; n (SENP6 shRNA2) = 15 cells. For b replicate 1: n (ctrl shRNA) = 14 cells, n (SENP6 shRNA1) = 13 cells; n (SENP6 shRNA2) = 15 cells; replicate 2: n (ctrl shRNA) = 15 cells, n (SENP6 shRNA1) = 15 cells; n (SENP6 shRNA2) = 14 cells. Dashed lines indicate areas of DNA. Scale bars = 5 µm. Error bars represent standard deviation. Source data are provided as a Source Data file
Fig. 8
Fig. 8
SENP6 localizes to the nucleoplasm. U2OS cells were grown on coverslips overnight, transfected either with a pool of four siRNAs against SENP6 (siSENP6) or a pool of four nontargeting siRNAs (NTP). Cells were fixed 2 days post transfection and co-stained with Hoechst to visualize DNA and antibodies directed against SENP6 and CENP-A. Panels show representative pictures of mitotic (upper panel) and interphase cells (lower panel). Scale bar = 5 µm (mitotic cells), 10 µm (interphase cells). Source data are provided as a Source Data file
Fig. 9
Fig. 9
SENP6 knockdown leads to the depletion of multiple CCAN proteins from chromatin. a U2OS cells were transfected either with a pool of four siRNAs against SENP6 (siSENP6) or a pool of four nontargeting siRNAs (NTP). Chromatin fractions were isolated and proteins were analyzed by mass spectrometry. Volcano plot showing all identified proteins within the NTP treated sample compared with the siSENP6 treated sample. All identified inner kinetochore proteins are represented by red circles. n = 4 independent experiments. b Samples from panel a were analyzed by immunoblotting using antibodies against several inner kinetochore proteins, as well as β-tubulin and histone H4 as control for efficient fractionation. Source data are provided as a Source Data file. c Model of SENP6 regulation of CCAN proteins. SENP6 deSUMOylated CCAN proteins as well as Mis18BP1. SENP6 depletion leads to RNF4-mediated degradation of Mis18BP1 and consequently the failure of CENP-A to accumulate at the centromere. Reduced CENP-A levels as well as accumulated SUMO chains on other CCAN family members hinder efficient CCAN protein complex formation at the centromere

Similar articles

Cited by

References

    1. Hynes NE, et al. Signalling change: signal transduction through the decades. Nat. Rev. Mol. Cell Biol. 2013;14:393–398. doi: 10.1038/nrm3581. - DOI - PubMed
    1. Gareau JR, Lima CD. The SUMO pathway: emerging mechanisms that shape specificity, conjugation and recognition. Nat. Rev. Mol. Cell Biol. 2010;11:861–871. doi: 10.1038/nrm3011. - DOI - PMC - PubMed
    1. Flotho A, Melchior F. Sumoylation: a regulatory protein modification in health and disease. Annu. Rev. Biochem. 2013;82:357–385. doi: 10.1146/annurev-biochem-061909-093311. - DOI - PubMed
    1. Deribe YL, Pawson T, Dikic I. Post-translational modifications in signal integration. Nat. Struct. Mol. Biol. 2010;17:666–672. doi: 10.1038/nsmb.1842. - DOI - PubMed
    1. Peng J, et al. A proteomics approach to understanding protein ubiquitination. Nat. Biotechnol. 2003;21:921–926. doi: 10.1038/nbt849. - DOI - PubMed

Publication types

MeSH terms