. 2019 Dec;24(12):1902-1919.
doi: 10.1038/s41380-019-0512-3. Epub 2019 Sep 4.

ELFN2 is a postsynaptic cell adhesion molecule with essential roles in controlling group III mGluRs in the brain and neuropsychiatric behavior

Affiliations

ELFN2 is a postsynaptic cell adhesion molecule with essential roles in controlling group III mGluRs in the brain and neuropsychiatric behavior

Henry A Dunn et al. Mol Psychiatry. 2019 Dec.

Abstract

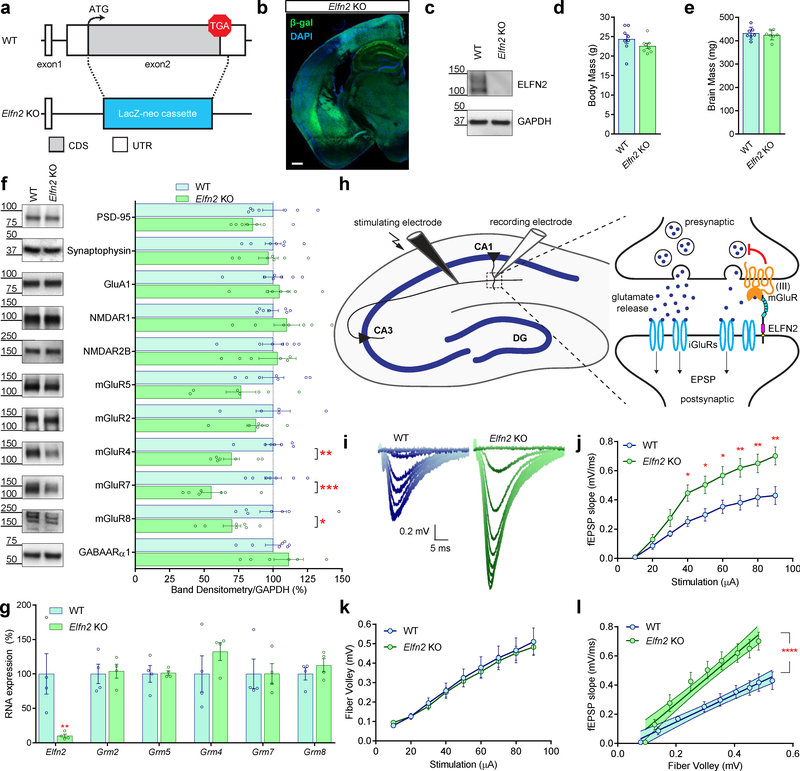
The functional characterization of the GPCR interactome has predominantly focused on intracellular binding partners; however, the recent emergence of transsynaptic GPCR complexes represents an additional dimension to GPCR function that has previously been unaccounted for in drug discovery. Here, we characterize ELFN2 as a novel postsynaptic adhesion molecule with a distinct expression pattern throughout the brain and a selective binding with group III metabotropic glutamate receptors (mGluRs) in trans. Using a transcellular GPCR signaling platform, we report that ELFN2 critically alters group III mGluR secondary messenger signaling by directly altering G protein coupling kinetics and efficacy. Loss of ELFN2 in mice results in the selective downregulation of group III mGluRs and dysregulated glutamatergic synaptic transmission. Elfn2 knockout (Elfn2 KO) mice also feature a range of neuropsychiatric manifestations including seizure susceptibility, hyperactivity, and anxiety/compulsivity, which can be rescued by pharmacological augmentation of group III mGluRs. Thus, we conclude that extracellular transsynaptic scaffolding by ELFN2 in the brain is a cardinal organizational feature of group III mGluRs essential for their signaling properties and brain function.


Conflict of interest statement

COMPETING INTERESTS:

The authors declare no competing interests.

Figures

Figure 1.
Figure 1.
A. Phylogenetic analysis of LRR and FN3 domain-containing proteins routed for similarity to ELFN1. B. Domain topology of ELFN1 (top) aligned to ELFN2 (bottom) with identical amino acids in orange, unaligned regions represented as line breaks, and insertions on ELFN2 represented by blue lines. C. Schematic representation of transcellular co-immunoprecipitation assay between ELFN1/2 and mGluRs. D. Representative immunoblots (IB) of mGluR7 input (bottom), immunoprecipitation (IP) of ELFN1/2-myc (middle), and co-immunoprecipitation of mGluR7 (top). E. Representative immunoblots of mGluR4 input (bottom), immunoprecipitation (IP) of ELFN1/2-myc (middle), and co-immunoprecipitation of mGluR4 (top). F. Representative immunoblots of mGluR8 input (bottom), immunoprecipitation (IP) of ELFN1/2-myc (middle), and co-immunoprecipitation of mGluR8 (top). G. In situ hybridization of Elfn2 mRNA (green) and Nissl staining (blue) of wildtype mouse coronal sections, scale bars 500¼m. H. In situ hybridization of Elfn1 mRNA (red), Elfn2 mRNA (green), and NeuN immunohistochemistry (blue). Scale bar is 200¼M in hippocampal image and 50¼M in CA1 inset image. I. Representative immunoblot for ELFN2 and GAPDH for samples isolated via microdissection of 2mm × 2mm brain punches from wildtype mouse with densitometric quantification of ELFN2 expression levels as a percentage of all bands analyzed (n=3). J. Representative immunoblots for ELFN2 of subcellular fractionation of wildtype mouse brain performed using step sucrose gradients. PSD-95 was used as post-synaptic density marker. Gβ1 was used as a membrane marker absent from PSD fractions. GAPDH was used as a cytosolic marker.
Figure 2.
Figure 2.
A. Schematic representation of transcellular GPCR platform utilizing biotinylation to label membrane-expressed mGluRs, where increases in biotinylated protein represents higher proportion of protein on the cell membrane. B. Immunoblot of identical mGluR4 expressing cells acutely co-cultured with Control or ELFN2-expressing cells, with GAPDH (bottom), biotinylated ELFN2-myc following Streptavidin pull-down, and biotinylated mGluR4 after Streptavidin pulld-down. C. Quantification of biotinylated mGluR4 following acute exposure to different co-cultures (p=0.0368, n=5). D. Schematic representation of transcellular GPCR signaling platform utilizing −22F cAMP pGloSensor, where decreases in cAMP-mediated luminescence equates to group III/II mGluR activation. E. Concentration-response curve for mGluR4 cell activation in co-culture with Control or ELFN2 cells. EC50 represented by dotted line (n=6). F. Maximal efficacy of L-glutamic acid-mediated activation of mGluR4 cells in co-culture with Control or ELFN2 cells (p=0.0001, n=6). G. Half maximal effective concentration of L-glutamic acid-mediated activation of mGluR4 cells in co-culture with Control or ELFN2 cells (p=0.0231, n=6). H. Schematic representation of transcellular GPCR signaling platform utilizing real-time BRET-based G protein activation sensor, where increases in BRET ratio signify group III/II mGluR-mediated activation of Gαo. I. Average change in BRET ratio from Gαo sensor activation in mGluR4 cells via 300¼M L-glutamic acid in co-culture with Control or ELFN2 cells (n=5). J. Maximal efficacy for Gαo activation by mGluR4 cells in co-culture with Control or ELFN2 cells (p=0.0049, n=5). K. Activation rate for Gαo activation by mGluR4 cells in co-culture with Control or ELFN2 cells (p=0.0088, n=5). L. Activation constant for Gαo activation by mGluR4 cells in co-culture with Control or ELFN2 cells (p=0.0033, n=5).
Figure 3.
Figure 3.
A. Schematic representation of generation of Elfn2 KO mouse replace exon2 on Elfn2 gene with LacZ-neo cassette for β-galactosidase reporter expression and disruption of ELFN2 protein expression (CDS, coding sequence; UTR, untranslated region). B. Immunohistochemistry for β-galactosidase expression (green) in Elfn2 KO mice coronal section and DAPI nuclear staining (blue). C. Western blot confirming lack of ELFN2 protein expression in Elfn2 KO mouse whole brain homogenate compared to wildtype mouse. GAPDH Western blot provided as loading control. D. Comparative body mass between wildtype and Elfn2 KO mice (p=0.1965, n=8). E. Comparative brain mass between wildtype and Elfn2 KO mice (p=0.5819, n=7). F. Western blotting and densitometric quantification of protein expression for various synaptic machineries compared between wildtype and Elfn2 KO mice: PSD-95 (p=0.1492, n=7), Synaptophysin (p=0.7168, n=7), GluA1 (p=0.6760, n=7), NMDAR1 (p=0.3416, n=7), NMDAR2B (p=0.8387, n=7), mGluR5 (p=0.1057, n=7), mGluR2 (p=0.3570, n=5–7), mGluR4 (p=0.0027, n=7), mGluR7 (p=0.0005, n=7), mGluR8 (p=0.0244, n=7), GABAARα1 (p=0.3671, n=7). G. Quantitative real-time PCR for RNA expression of Elfn2 (p=0.0018, n=4), Grm2 (p>0.9999, n=4), Grm5 (p>0.9999, n=4), Grm4 (p=0.6416, n=4), Grm7 (p>0.9999, n=4), and Grm8 (p=0.9947, n=4). H. Schematic representation of electrophysiological protocol stimulating glutamate release of Schaffer collaterals and recording field excitatory postsynaptic potentials (fEPSPs) from the stratum radiatum of CA1. Inset image highlights group III mGluR autoreceptor role in modulating glutamate release and subsequent postsynaptic response via activation of ionotropic glutamate receptors (iGluRs). I. Representative fEPSP traces for WT and Elfn2 KO mice. J. Quantitative analysis of fEPSP slope across various stimulations for WT and Elfn2 KO mice (10¼A, p>0.9999, n=9; 20¼A, p=0.9991, n=9; 30¼A, p=0.6957, n=9; 40¼A, p=0.0487, n=9; 50¼A, p=0.0310, n=9; 60¼A, p=0.0227, n=9; 70¼A, p=0.0068, n=9; 80¼A, p=0.0092, n=9; 90¼A, p=0.0012, n=9). K. Quantitative analysis of fiber volley across various stimulations for WT and Elfn2 KO mice (10¼A-80 μA, p>0.9999, n=9; 90¼A, p=0.9998, n=9). L. Linear regression comparing fEPSP slope to fiber volley in WT and Elfn2 KO mice (p<0.0001, n=9).
Figure 4.
Figure 4.
A. Seizure score graded 0–4 (0 = normal behaviour, 1 = wild-running, 2 = tonic seizures, 3 = clonic seizures, 4 = death) in response to startling sound, octanol odorant, or combined stimuli for wildtype and Elfn2 KO mice (Sound p=0.0006, n=7; Odor p=0.2127, n=7; Combined p=0.0006, n=7). B. Number of episodes in response to startling sound, octanol odorant, or combined stimuli for wildtype and Elfn2 KO mice (Sound p=0.0006, n=7; Odor p=0.2249, n=7; Combined p=0.0006, n=7). C. Seizure score described above in response to increasing concentrations of seizure-inducing bicuculline in wildtype and Elfn2 KO mice (0mg/kg p>0.9999, n=8; 1mg/kg p=0.0769, n=8; 2mg/kg p=0.0016, n=8; 3mg/kg p=0.0238, n=5; 4mg/kg p=0.0035, n=7). D. Number of episodes in response to increasing concentrations of seizure-inducing bicuculline in wildtype and Elfn2 KO mice. (0mg/kg p>0.9999, n=8; 1mg/kg p=0.0769, n=8; 2mg/kg p=0.0236, n=8; 3mg/kg p=0.0251, n=5; 4mg/kg p=0.0003, n=7). E. Distance travelled in open field test by wildtype and Elfn2 KO mice in 10-minute bins (10–110min p<0.0001; 120min p=0.0014; 130min p=0.0003; 140min p=0.0019; 150min p=0.0003; 160min p=0.0090; 170min p=0.0004; 180min p=0.0279; n=8–9). F. Total distance travelled in open field test by wildtype and Elfn2 KO mice throughout entire 3-hour period (p<0.0001, n=8–9). G. Average speed in open field test by wildtype and Elfn2 KO mice (p=0.0001, n=8–9). H. Percentage of time spent mobile, immobile, or freezing in the open field test for wildtype and Elfn2 KO mice (Mobile p<0.0001; Immobile p=0.0001; Freezing p=0.6581; n=8–9). I. Habituation rate for distance travelled in open field test of WT and Elfn2 KO calculated at 90 mins (p=0.8262, n=8–9). J. Number of center crossings exhibited in the open field test by wildtype and Elfn2 KO mice (p<0.0001, n=8–9). K. Percentage of time spent in center (p<0.0001, n=8–9) or wall-hugging (thigmotaxis) (p=0.0003, n=8–9) in the open field test for wildtype and Elfn2 KO mice. L. Time spent performing stereotypic grooming behaviour in 30-minute window of open field test for wildtype and Elfn2 KO mice (p<0.0001, n=8–9). M. Number of rotations exhibited in the open field test by wildtype and Elfn2 KO mice (p<0.0001, n=8–9). N. Percentage of time spent in open arms for the elevated plus maze test for wildtype and Elfn2 KO mice (p<0.0001, n=9–10). O. Number of marbles buried in the marble burying test for wildtype and Elfn2 KO mice (p<0.0001, n=9–10). P. Percentage of time spent in empty, center/tunnel, or mouse-containing chamber in the three chambered sociability test for wildtype and Elfn2 KO mice (WT Empty vs. Mouse p<0.0001, n=15; Elfn2 KO Empty vs. Mouse p=0.0454, n=14). Additional statistics comparing between genotypes provided (Empty p<0.0001; Center p=0.7096; Mouse p<0.0001; n=14–15). Q. Percentage of time spent in familiar mouse-, center/tunnel, or novel mouse-containing chambers in three chambered social novelty test for wildtype and Elfn2 KO mice (WT Familiar vs. Novel p=0.0225, n=15; Elfn2 KO Familiar vs. Novel p=0.8062, n=14). Additional statistics comparing between genotypes provided. (Familiar p=0.2185; Center p<0.0001; Novel p<0.0001; n=14–15).
Figure 5.
Figure 5.
A. Distance travelled in open field test before and after group III mGluR PAM VU0155041 in wildtype and Elfn2 KO mice in 10-minute bins (WT bins p=0.8992, 0.2930, 0.7529, 0.0965, 0.9902, 0.3403, 0.5245, 0.7613, >0.9999, 0.6735, >0.9999, 0.5894, n=9; KO bins p=<0.0001, <0.0001, <0.0001, <0.0001, <0.0001, <0.0001, <0.0001, <0.0001, <0.0001, 0.0001, 0.0169, 0.2281, n=7). B. Total distance travelled over 120-minute period before and after VU0155041 in wildtype and Elfn2 KO mice (WT p=0.1212, n=9; KO p<0.0001, n=7). C. Percentage of time spent mobile, immobile, or freezing in the open field test before and after VU0155041 for wildtype and Elfn2 KO mice (Mobile WT p=0.9135, n=9; Mobile KO p<0.0001, n=7; Immobile WT p=0.1077, n=9; Immobile KO p=0.0005, n=7; Freezing WT p=0.6216, n=9; Freezing KO p=0.6028, n=7). D. Center crossings in open field test for WT and Elfn2 KO mice before and after VU0155041 (WT p=0.8973, n=9; KO p<0.0001, n=7). E. Time spent in center of open field test for WT and Elfn2 KO mice before and after VU0155041 (WT p=0.1949, n=9; KO p=0.0086, n=7). F. Number of rotations in open field test for WT and Elfn2 KO mice before and after VU0155041 (WT p=0.4135, n=9; KO p<0.0001, n=7). G. Percentage of time spent grooming in open field test for WT and Elfn2 KO mice before and after VU0155041 (WT p=0.6492, n=9; KO p<0.0001, n=7). H. Seizure score graded 0–4 (0 = normal behaviour, 1 = wild-running, 2 = tonic seizures, 3 = clonic seizures, 4 = death) in response to combined auditory and olfactory stimuli before and after VU0155041 in WT and Elfn2 KO mice (WT p>0.9999, n=9; KO p>0.9999, n=7). I. Number of episodes scored in WT and Elfn2 KO mice before and after VU0155041 (WT p=0.9802, n=9; KO p=0.0010, n=7). J. Average length of episodes in WT and Elfn2 KO mice before and after VU0155041 (WT p=0.9664, n=9; KO p=0.0004, n=7).

Similar articles

Cited by

References

    1. Sanes JR, Yamagata M. Many Paths to Synaptic Specificity. Annu Rev Cell Dev Bi 2009; 25: 161–195. - PubMed
    1. Williams ME, de Wit J, Ghosh A. Molecular Mechanisms of Synaptic Specificity in Developing Neural Circuits. Neuron 2010; 68(1): 9–18. - PMC - PubMed
    1. de Wit J, Ghosh A. Specification of synaptic connectivity by cell surface interactions. Nat Rev Neurosci 2016; 17(1): 22–35. - PubMed
    1. Kaeser PS, Regehr WG. Molecular Mechanisms for Synchronous, Asynchronous, and Spontaneous Neurotransmitter Release. Annu Rev Physiol 2014; 76: 333–363. - PMC - PubMed
    1. Akil H, Brenner S, Kandel E, Kendler KS, King MC, Scolnick E et al. The Future of Psychiatric Research: Genomes and Neural Circuits. Science 2010; 327(5973): 1580–1581. - PMC - PubMed

Publication types

Substances