. 2019 Sep;573(7773):271-275.
doi: 10.1038/s41586-019-1536-1. Epub 2019 Sep 4.

Maternal vitamin C regulates reprogramming of DNA methylation and germline development

Affiliations

Maternal vitamin C regulates reprogramming of DNA methylation and germline development

Stephanie P DiTroia et al. Nature. 2019 Sep.

Erratum in

Abstract

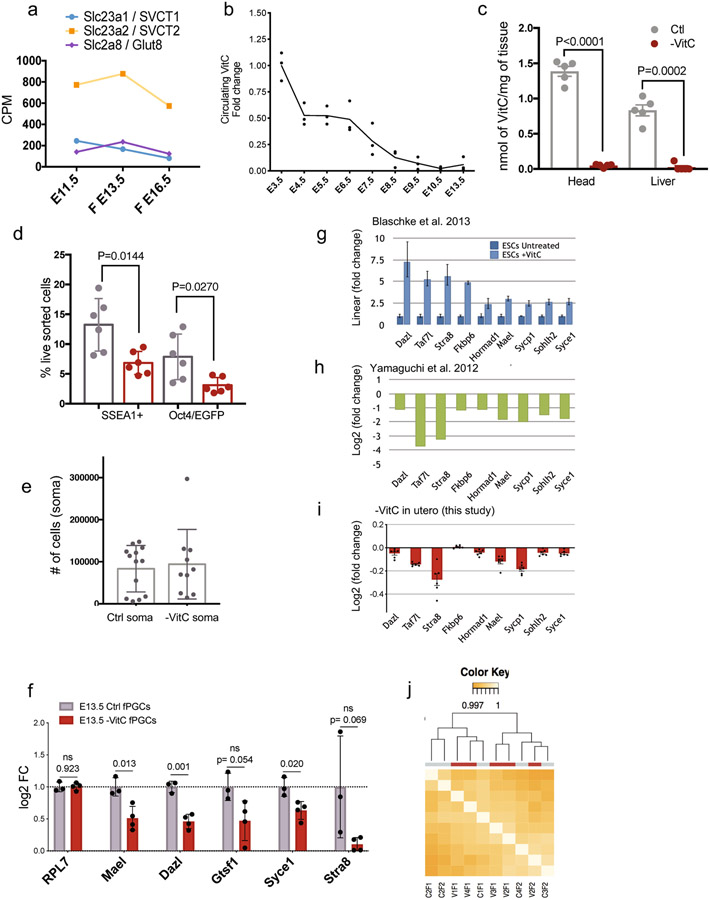
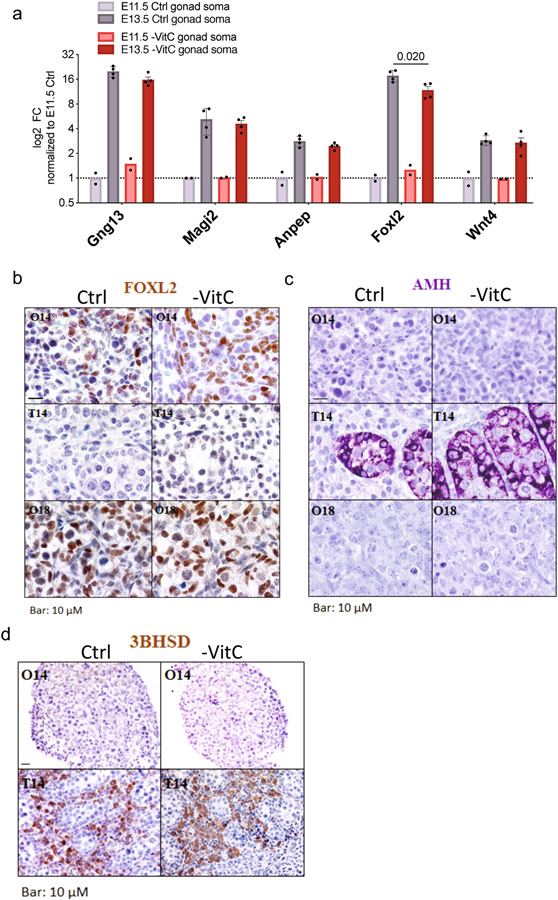
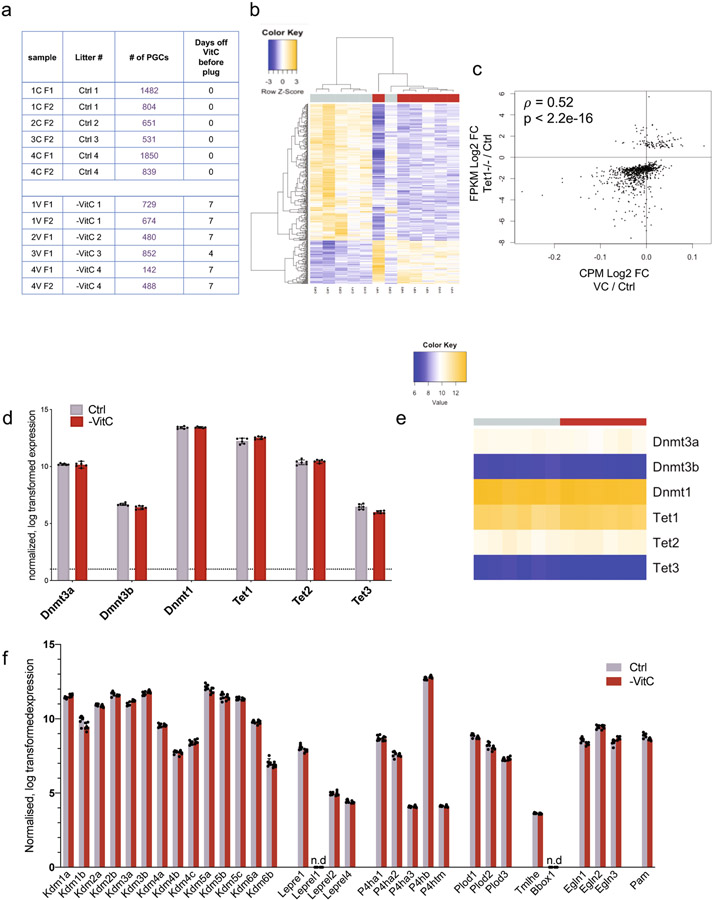
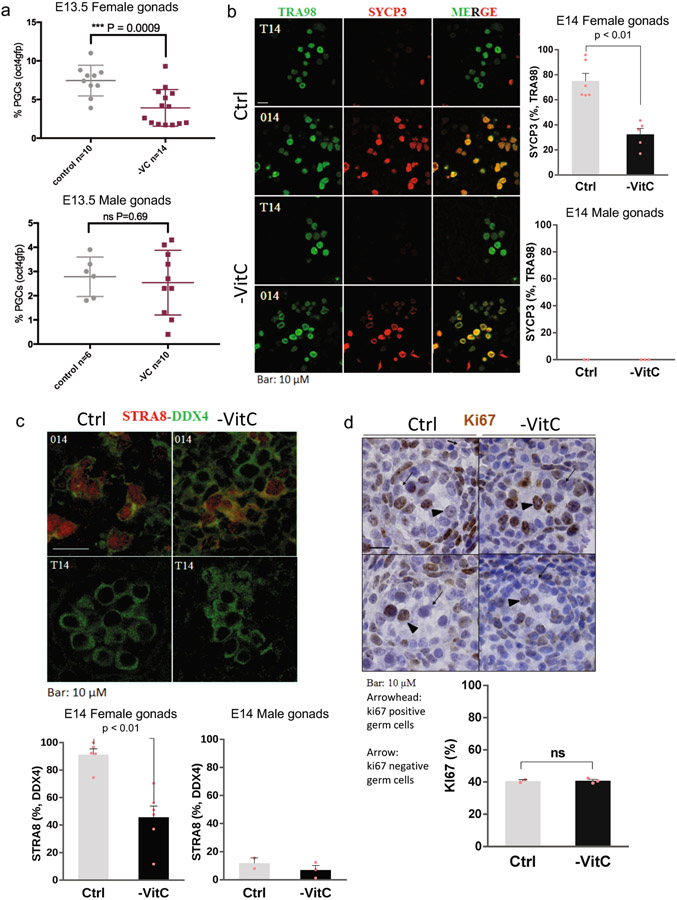
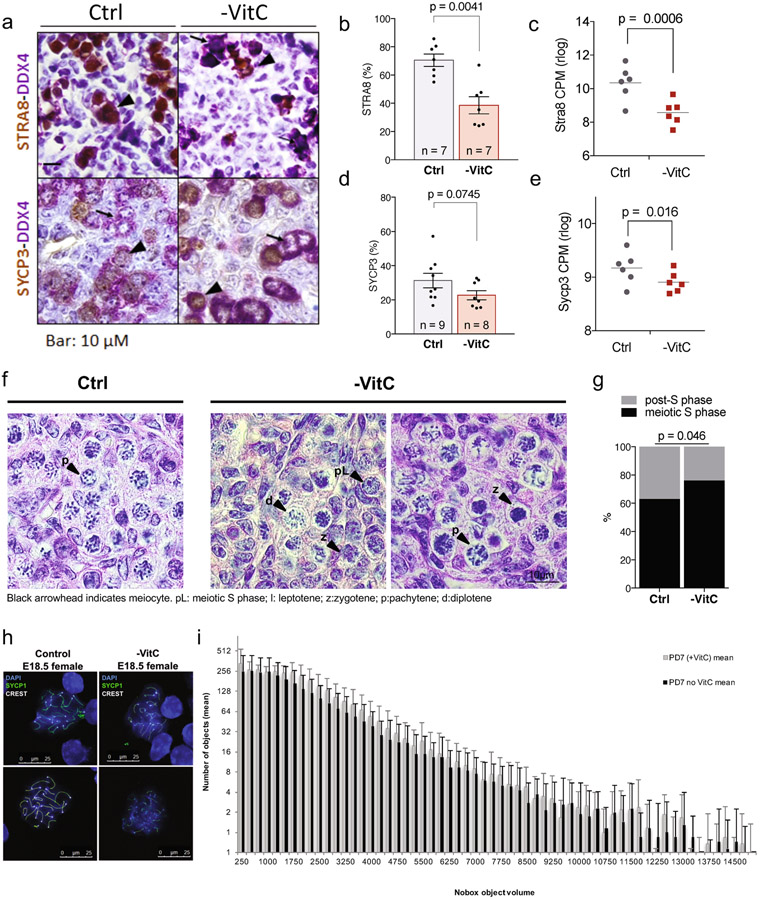
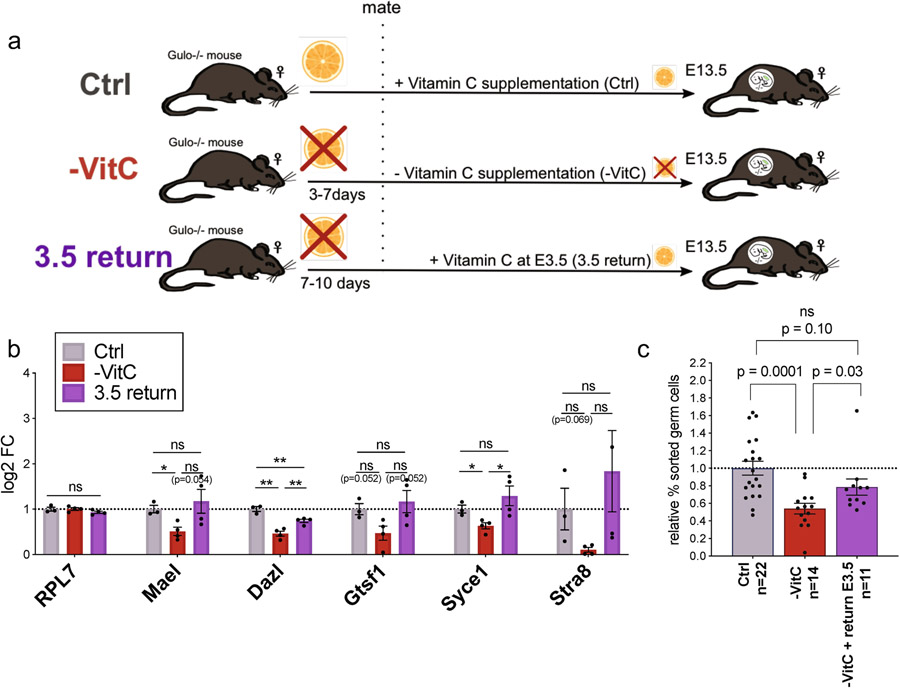
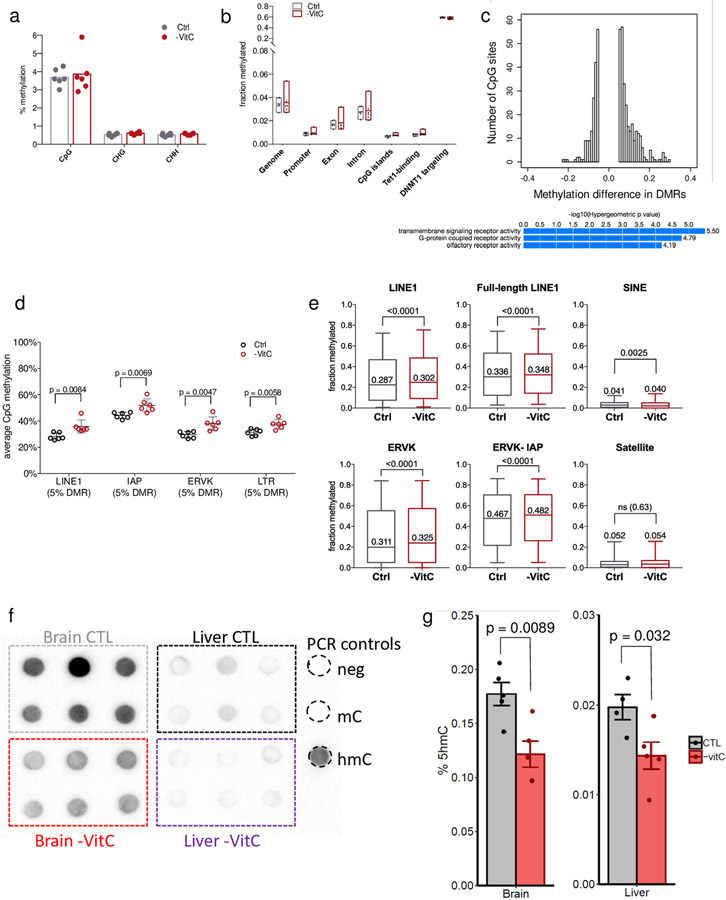
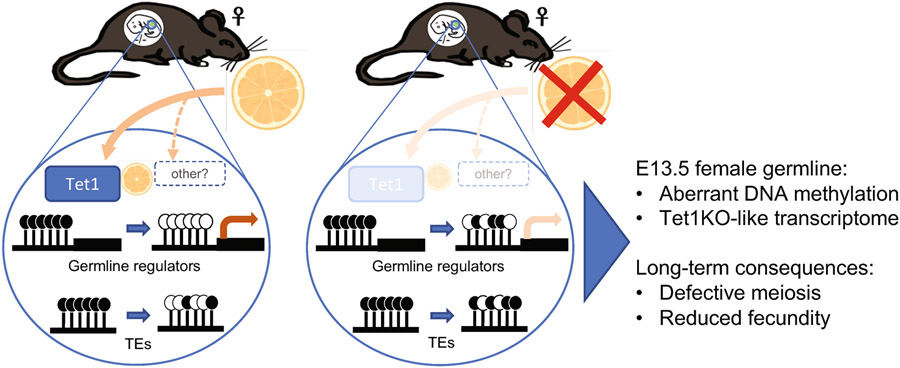
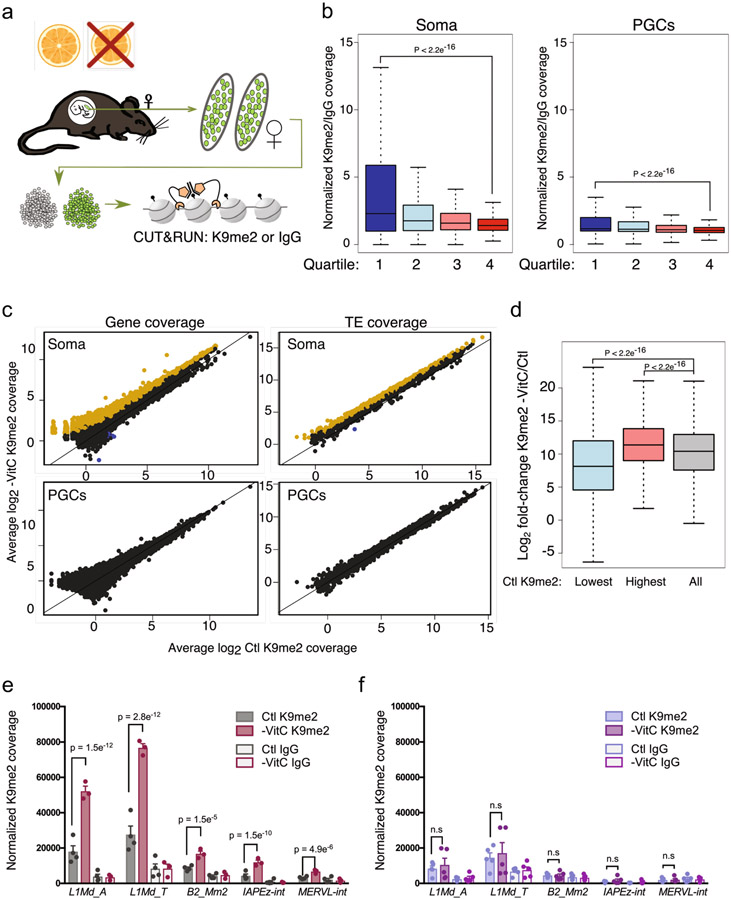
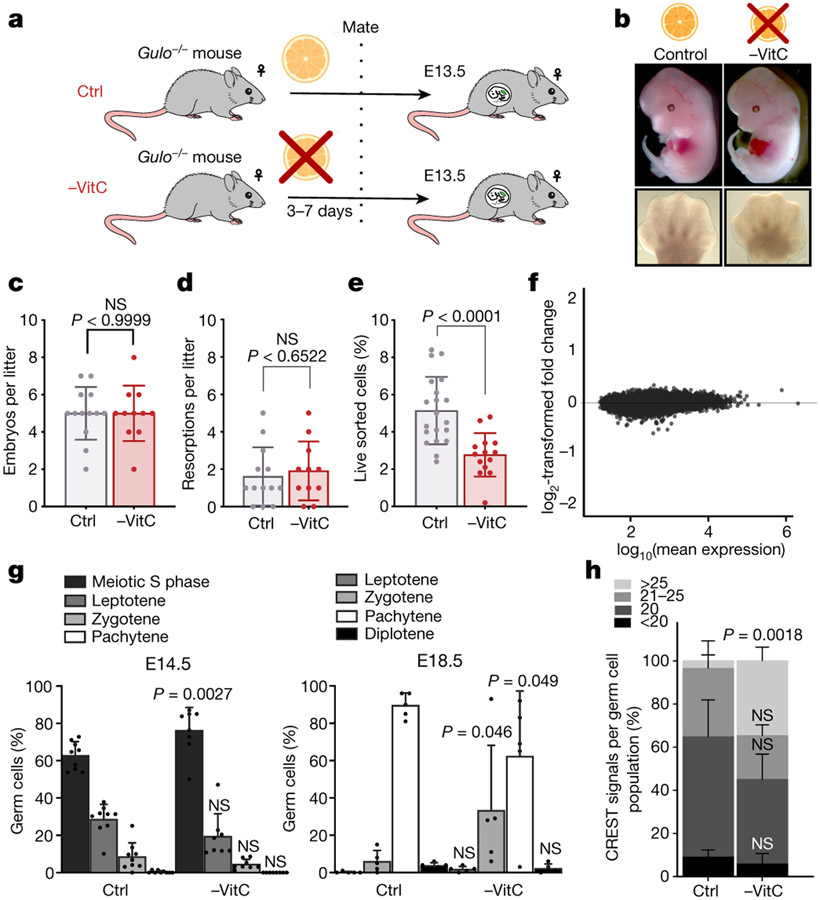
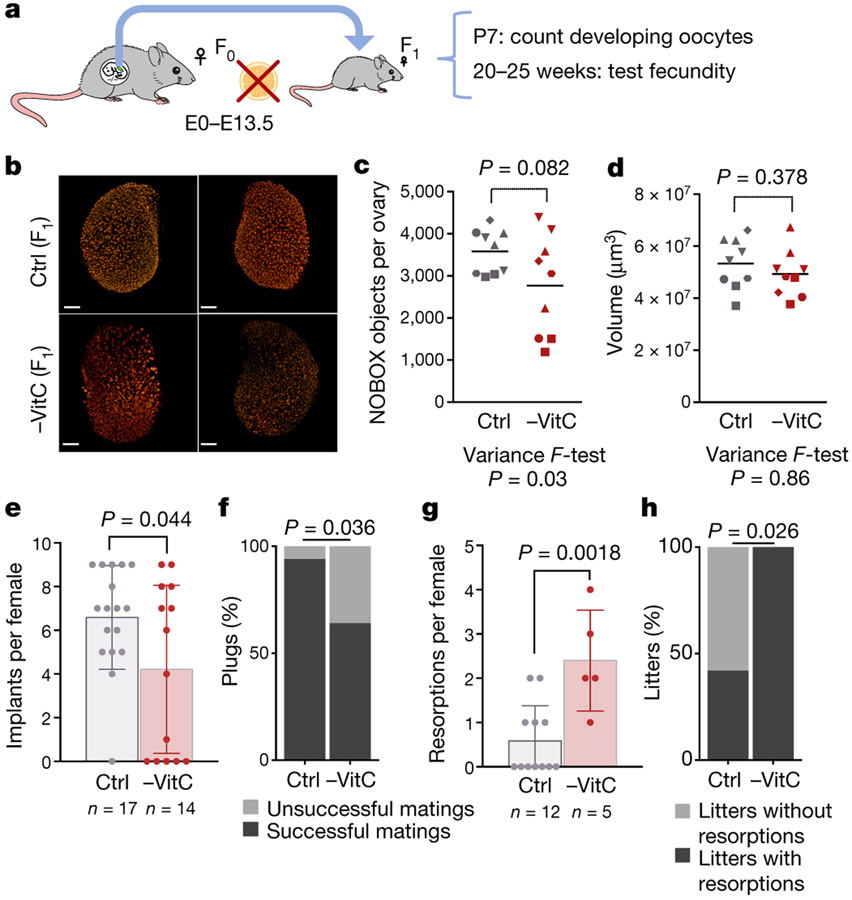
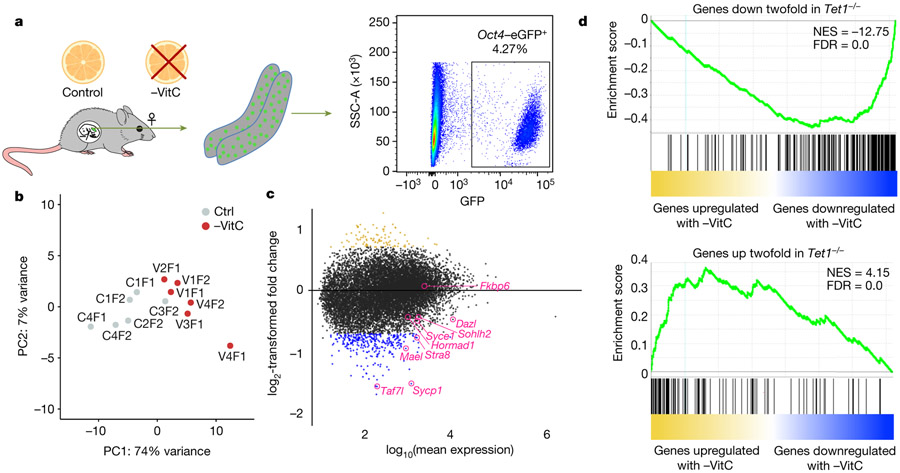
Development is often assumed to be hardwired in the genome, but several lines of evidence indicate that it is susceptible to environmental modulation with potential long-term consequences, including in mammals1,2. The embryonic germline is of particular interest because of the potential for intergenerational epigenetic effects. The mammalian germline undergoes extensive DNA demethylation3-7 that occurs in large part by passive dilution of methylation over successive cell divisions, accompanied by active DNA demethylation by TET enzymes3,8-10. TET activity has been shown to be modulated by nutrients and metabolites, such as vitamin C11-15. Here we show that maternal vitamin C is required for proper DNA demethylation and the development of female fetal germ cells in a mouse model. Maternal vitamin C deficiency does not affect overall embryonic development but leads to reduced numbers of germ cells, delayed meiosis and reduced fecundity in adult offspring. The transcriptome of germ cells from vitamin-C-deficient embryos is remarkably similar to that of embryos carrying a null mutation in Tet1. Vitamin C deficiency leads to an aberrant DNA methylation profile that includes incomplete demethylation of key regulators of meiosis and transposable elements. These findings reveal that deficiency in vitamin C during gestation partially recapitulates loss of TET1, and provide a potential intergenerational mechanism for adjusting fecundity to environmental conditions.


Figures

Extended Data Figure 1 ∣
Validation of Vitamin C depletion and the down-regulation of Tet1- dependent germline genes in a mouse model of gestational Vitamin C deficiency. a, Expression of Vitamin C transporters in developing female germ cells. Data from Seisenberger et al. b, Kinetics of Vitamin C depletion from the serum of pregnant Gulo−/− mice after withdrawal from their drinking water. Pregnant females were removed from Vitamin C supplementation at E3.5 and circulating blood serum was tested over the time-course indicated. It takes 5 days of withdrawal for the circulating Vitamin C levels to be <25%, and 7 days to be essentially undetectable. Line plot connects the average blood serum values of n=3 biological replicates. c, Vitamin C levels measured by MS in E13.5 embryonic tissue with and without gestational Vitamin C removal. E13.5 female head or liver were normalized by tissue weight. Samples with non-detectable Vitamin C were set to zero. Statistical significance is measured by two-tailed t-test with Welch’s correction on n=5 biological replicates per condition. Error bars depict mean ± SEM. d, The reduction in E13.5 female germ cells numbers upon Vitamin C deficiency is confirmed using both Oct4/EGFP and SSEA1 positivity. Statistical significance is measured by two-tailed t-test with Welch’s correction on n=6 matched biological replicates per condition. Error bars depict mean ± SD. e, Gestational Vitamin C deficiency does not affect average somatic cell number. Statistical significance is measured by two-tailed t-test with Welch’s correction on n=13 control and n=10 Vitamin C deprived biological replicates. Error bars depict mean ± SD. f, Vitamin C-deficient E13.5 female germ cells express lower levels of key germline genes, as measured by qRT-PCR. Error bars depict mean ± SD of n=3 control and n=4 –VitC biological replicates. Statistical significance assessed by two-tailed Student’s t-tests. The variability in Strat8 levels in controls as assessed by qRT-PCR at E13.5 is due to the fact that it is just being induced at this stage; RNA-seq and IF data further document the significant reduction in Stra8 RNA and protein levels in Vitamin C deficient PGCs (Extended Data 2a). g, Expression of select germline genes are induced in a Tet1/2-dependent manner upon Vitamin C addition to cultured mouse ES cells. Gene expression was measured by qRT-PCR and error bars represent the mean ± SD of technical triplicates. h, Decreased expression of select germline genes in Tet1−/− E13.5 germ cells as measured by RNAseq. Data from8, averages of 3 controls and 2 Tet1−/− samples. i, Select germline genes induced by Vitamin C in cultured ES cells (c) and down-regulated in Tet1−/− germ cells (d) are also found down-regulated in -VitC E13.5 germ cells. Gene expression was measured by RNAseq. Error bars depict mean ± SEM of 6 biological replicates. j, Gestational Vitamin C deficiency does not affect transcription in the somatic cells of E13.5 female gonads as shown by unsupervised clustering of RNA-seq. Clustering preformed on n=6 biological replicates per condition.
Extended Data Figure 2 ∣
Analyses of gonad development upon Vitamin C deficiency. a, There is an overall normal induction of key markers of developmental progression of somatic cells of the ovaries between E11.5 and E13.5 in Vitamin C-deficient embryos, as measured by qRT-PCR. E13.5 somatic ovary cells are matched with PGCs in Extended Data Fig. 1f. In this analysis, Foxl2 expression is strongly induced upon Vitamin C deficiency, but to a slightly lower extent than in control samples. However, no significant changes in Foxl2 were detected by RNA-seq (Fig. 1f) or IF (b). Error bars of E13.5 samples depict mean ± SD of 4 biological replicates. Bars of E11.5 samples represent minimum and maximum measurements. b, Sexual differentiation is controlled by a balance between Sox9 (leading to AMH expression) in male and Foxl2 in female. Expression of Foxl2 in E14 and E18 ovaries (O14 and O18, respectively) does not change with Vitamin C-deficiency as measured by IHC. As expected, Foxl2 was not detected in E14 testis (T14). Images are representative of n=5 control and n=4 - VitC ovaries and n=2 control and n=3 -VitC testes. c, Expression of AMH in E14 testis does not change with Vitamin C-deficiency as measured by IHC. As expected, AMH was not detected in E14 or E18 ovaries. Images are representative of n=5 control and n=4 -VitC ovaries and n=2 control and n=3 -VitC testes. d, Gestational Vitamin C deficiency does not affect the presence of Leydig cells (3BHSD) in developing testis or the absence of Leydig cells in developing ovaries. Images are representative of n=5 control and n=4 -VitC ovaries and n=2 control and n=3 -VitC testes.
Extended Data Figure 3 ∣
Detailed analyses of meiotic staging in germ cells of E14.5 Vitamin C-deficient ovaries. a, Representative images of STRA8 and SYCP3 abundance in E14.5 control or Vitamin C-deficient female germ cells. Images are representative of n=7 STRA8 and n=8 SYCP3 biologically independent stainings, as indicated in (b) and (d). b, Significant reduction in the percentage of DDX4+ germ cells that are Stra8+ upon Vitamin C deficiency. Error bars depict mean ± SEM. Statistical significance assessed by two-sided Mann-Whitney test. c, Stra8 mRNA abundance is significantly reduced at E13.5 measured by RNA-seq. Centre line represents the mean of n=6 biological replicates. Statistical significance assessed by Wald Chi-Squared test. d, Vitamin C-deficient E14.5 female germ cells display a trend towards reduction in the percentage of Ddx4+ germ cells that are Sycp3+. Error bars depict mean ± SEM. Statistical significance assessed by two-sided Mann-Whitney test. e, Sycp3 mRNA abundance is significantly reduced at E13.5 measured by RNA-seq. Centre line represents the mean of n=6 biological replicates. Statistical significance assessed by Wald Chi-Squared test. f, Representative haematoxilin/eosin staining of E14.5 embryonic ovaries for data quantified in Fig. 1h. Black arrowheads indicate germ cells at the indicated stage of meiosis. Images are representative of n=8 biologically independent stainings. g, The percentage of germ cells in meiotic S phase vs post-S phase is significantly higher in - VitC E14.5 females, relative to controls. Additional analysis of data from meiosis staging shown in Fig. 1h. Statistical significance assessed by the Chi-square test of n=8 biologically independent experiments. h, Representative images of E18.5 CREST-SYCP1 staining for Fig. 1h. i, Ovarian follicle volume and frequency is not significantly change in in postnatal day 7 (PD7) females deprived of Vitamin C in utero. Ovarian follicles are stained by Nobox and quantified using whole-mount imaging. Error bars depict mean ± SD of n=6 control and n=9 vitamin C depleted stainings.
Extended Data Figure 4 ∣
Analyses of the effects of Vitamin C deficiency on male germ cell development. a, Unlike the consistent reduction of female germ cells, Vitamin C deficiency does not decrease the number of germ cells in E13.5 male gonad. Statistical significance assessed by two-sided Welch’s t-test. Error bars depict mean ± SD of the indicated number of biological replicates. b, The meiotic germ cell marker SYCP3 was not identified in n=2 or n=3 male gonads with or without Vitamin C depletion, respectively. Statistical significance of E14 female gonads assessed by two-tail Mann-Whitney test. Error bars depict mean + SEM of n=6 control and n=5 -VitC biological replicates. c, The meiotic germ cell marker STRA8 was not identified in n=2 or n=3 male gonads with or without Vitamin C depletion, respectively. Statistical significance assessed by two-tail Mann-Whitney test. Error bars depict mean + SEM. Female graph includes n=6 biological replicates. d, Most germ cells in developing testis are proliferative (ki67+), with a few quiescent (ki67-) germ cells, and no deviations from this pattern are detected with Vitamin C deficiency. Images are representative of n=2 control and n=3 -VitC biological replicates.
Extended Data Figure 5 ∣
Further analyses of RNA-seq data from Vitamin C-deficient E13.5 female germ cells. a, Table of RNAseq samples and number of germ cells per sample. Each sample represents germ cells from a single E13.5 female. b, Unsupervised hierarchical clustering of n=6 biological replicates in each condition documents the overall separation between Ctrl and -VitC samples (columns) and relative gene expression (rows). c, Scatterplot of differential gene expression in Vitamin C-deficient E13.5 female PGCs of genes called differentially expressed in E13.5 Tet1−/− female PGCs. Spearman’s rho statistic is used to estimate a rank-based measure of association. d, Expression of Dnmt and Tet genes in -VitC samples are similar to Ctrl samples. Error bars depict mean ± SD of n=6 biological replicates per condition. Statistical significance assessed by two-tailed Student’s t-tests. e, Heatmap documenting the consistent expression of Tet and Dnmt genes across the 6 Ctrl samples and 6 -VitC samples. f, Expression of other genes belonging to families of enzymes with the potential to be Vitamin C-sensitive (Kdm’s, collagen hydroxylases, HIF hydroxylases, etc). None of these displays differential expression in Vitamin C-deficient female germ cells. Error bars depict mean ± SD of n=6 biological replicates per condition. Statistical significance assessed by two-tailed Student’s t-tests.
Extended Data Figure 6 ∣
Identification of the window of susceptibility to Vitamin C deficiency between E3.5 and E13.5. a, Pregnant females mated in Vitamin C-deficient conditions were either maintained without Vitamin C (-VitC) or returned to Vitamin C-containing water at E3.5 (3.5 return). b, Adding back Vitamin C from E3.5 to E13.5 tends to rescue the defects in the expression of key germline regulators induced with full Vitamin C deficiency. Gene expression was measured by qRT-PCR in E13.5 female germ cells. Error bars depict mean ± SEM of 4 biological replicates. Statistical significance assessed by two-tailed Student’s t-tests. * p<0.05; ** p<0.01. c, The numbers of E13.5 Oct4/EGFP+ germ cells are mostly recovered with return of Vitamin C at E3.5. Normalized to germ cell count of the Ctrl embryos. Error bars depict mean ± SEM of n = 11 to 22 biological replicates of each condition as indicated in the graph. Statistical significance assessed by two-tailed Student’s t-test.
Extended Data Figure 7 ∣
DNA methylation defects in E13.5 Vitamin C-deficient female germ cells. a, Average methylation of cytosine according to sequence context. Genome-wide CpG methylation is 3-6% regardless of Vitamin C supplementation. Methylation of cytosine in a CHG or CHH context is below 1%. b, Average methylation according to genomic context in Ctrl and -VitC samples. Floating box plots indicate min to max measurements of n=6 biological replicates with centre line at mean. c, Top: density plot of 460 DMRs with a >5% methylation change reveals an overall increase in the number and magnitude of methylation gains over losses upon Vitamin C deficiency; bottom: GREAT analysis of 175 hypomethylated DMRs (hypermethylated DMRs are in Fig. 4b). d, TEs of the LINE1 and LTR/ERVK/IAP families that are associated with DMRs show a consistent pattern of hypermethylation upon Vitamin C deficiency. Error bars depict mean ± SEM of 6 biological replicates. Statistical significance assessed by two-tailed Student’s t-tests. e, Average methylation in Ctrl or -VitC samples in different TE families across the genome. Data are from all uniquely mapped TEs annotated by RepeatMasker and captured by RRBS, regardless of the DMR calls, based on 558 elements and 3180 CpGs (LINE1), 185 elements and 1065 CpGs (Full-length LINE1; >6Kb), 384 elements and 1724 CpGs (SINE), 568 elements and 2691 CpGs (ERVK), 226 elements and 1057 CpGs (ERVK-IAP), 10 elements and 73 CpGs (Satellite). The box extends to 25 and 75 percentiles with center line indicating the median TE methylation across n = 6 biological replicates. Error bars extend to 5 and 95 percentile. Statistical significance assessed by two-tailed Wilcoxon matched-pairs signed rank test. f, hmC quantification by dot blot in E13.5 brain and liver indicate that hmC abundance is higher in brain and reduced with Vitamin C depletion. Each group represents 3 biological replicates (across) and 2 technical replicates (vertical pairs). g, hmC quantification by ELISA (Active Motif) confirmed a significant decrease of hmC in both E13.5 brain and liver. Quantification was performed using 50ng of DNA. Error bars depict mean ±SEM of 5 biological replicates. Statistical significance assessed by two-sided Welch’s t-test.
Extended Data Fig. 8 ∣
CUT&RUN analysis of H3K9me2 abundance in E13.5 female gonads. a, Diagram of CUT&RUN experiments: E13.5 Ctl or -VitC gonads were dissociated and the PGCs and soma separated by FACS for cryopreservation and CUT&RUN analysis. PGCs and soma from 3-5 independent embryos per condition were subjected to H3K9me2 (K9me2) or control (IgG) CUT&RUN. b, K9me2 enrichment is highest at non/low-expressed genes. Boxplots of average K9me2 coverage at genes in Control (Ctl) soma or PGC samples, separated into quartiles from lowest (quartile 1) to highest (quartile 4) expression level in Ctl E13.5 soma. Coverage is calculated from average (K9me2/IgG +0.001) of n=4 control and n=3 Vitamin C depleted soma replicates and n=5 PGC replicates per condition. P-values are two-sided Wilcoxon rank-sum test and box indicates 25 and 75 percentiles with center line marking the median value. c, Scatter plots of average K9me2 coverage at genes or TE families in Ctl or -VitC E13.5 female soma and PGCs. Data is comprised of n=4 control and n=3 Vitamin C depleted soma replicates and n=5 PGC replicates per condition. Significantly upregulated (yellow) or downregulated (blue) genes or TE families are indicated (log2FC > ∣1∣, FDR < 0.05, Limma analysis, see Methods for statisticial test details). d, Increases in soma K9me2 levels are highest at already K9me2-marked genes. Boxplot showing K9me2 log2FC upon -VitC depletion in soma in groups of genes ranked according to K9me2 enrichment in Ctl. Lowest: lowest quartile of K9me2 enrichment, Highest: highest quartile, All: all genes. P-values are two-sided Wilcoxon rank-sum test and box indicates 25 and 75 percentiles with center line marking the median value. Data is comprised of n=4 control and n=3 Vitamin C depleted soma replicates and n=5 PGC replicates per condition. e-f, Histograms of K9me2 or IgG coverage at selected TE families in E13.5 female e) soma or f) PGCs. Error bars depict mean ±SEM of n=4 control and n=3 Vitamin C depleted soma replicates and n=5 PGC replicates per condition. P-values are Limma toptable FDR values. See Supplementary File 5 and Methods for statistical test details.
Extended Data Figure 9 ∣
Model for the role of Vitamin C in DNA methylation reprogramming and development of the embryonic germline. Embryonic germline cells require Vitamin C for proper DNA demethylation of key meiosis regulators and transposable elements. Gestational Vitamin C deficiency is compatible with development to term and adulthood, but induces a phenotype akin to a Tet1 hypomorph, with incomplete DNA demethylation and down-regulation of germline genes, reduced germ cell numbers, meiosis defects and decreased fecundity. Vitamin C deficiency may also impact other enzymatic reactions in the germline.
Figure 1 ∣
Figure 1 ∣
Maternal Vitamin C promotes female germ cell development. a, Diagram of Vitamin C withdrawal during gestation. Control (Ctrl) litters are genetically identical to Vitamin C deficient litters (-VitC). Ctrl females are provided with physiological levels of Vitamin C in the drinking water. -VitC females are withdrawn from Vitamin C 3-7 days before mating up to E13.5. b, Vitamin C deficiency does not affect embryonic development to E13.5, as determined by morphological assessment of the embryos and hand plate staging. Embryos were compared across 13 control and 11 -VitC litters. c, Gestational Vitamin C deficiency does not affect litter size. Statistical significance assessed by two-sided Welch’s t-test. Error bars depict mean ± SD. d, Gestational Vitamin C deficiency does not affect resorption rate. Statistical significance assessed by two-sided Welch’s t-test. Error bars depict mean ± SD. e, Reduction in the number of Oct4/EGFP+ germ cells in -VitC E13.5 female embryos. Statistical significance assessed by two-sided Welch’s t-test. Error bars depict mean ± SD. f, MA plot reveals no significant changes in the transcription profile of -VitC E13.5 somatic cells of the female gonad (log2FC > ∣1∣ and FDR <0.05). g, Staging of meiosis reveals a delay in meiosis progression in -VitC ovaries. Error bars depict mean ± SD. Statistical significance assessed by Sidak’s multiple comparison test. See also Extended Data Fig. 3f, g. h, CREST staining reveals unpaired chromosomes in -VitC E18.5 female germ cells. CREST foci were counted in 100 cells across 4 biological replicates. Images in Extended Data Fig. 3h. Error bars depict mean ± SEM. Statistical significance assessed by two-sided Welch’s t-test.
Figure 2 ∣
Figure 2 ∣
Gestational Vitamin C deficiency has a long-term impact on female fecundity. a, Diagram of experiments to address female fecundity (see Fig. 1a). From E13.5 onwards, Vitamin C was resupplied in the drinking water. After birth, F1 females were assessed for ovarian reserve at day 7 or fecundity at 20-25 weeks. All -VitC and control mice are of the same genotype, Gulo−/−;Oct4/EGFP. b, Representative whole-mount images of P7 ovaries from -VitC or control females. Oocyte nuclei identified by Nobox (red) are segmented and sorted by volume to quantify primordial and primary follicles. n = 9 ovaries per condition. c, Quantification of oocytes in day 7 ovaries by whole-mount imaging of Nobox staining. Geometric shapes represent individual female embryos; Identical shapes indicate ovary pairs. Control females contain 3000-4500 Nobox+ oocytes/ovary (n=9). -VitC females contain 1000-4500 Nobox+ oocytes/ovary (n=9). Statistical significance assessed by two-tailed Student’s t-test and variance determined by F ratio. Centre line represents mean. d, Normal numbers and variance in P7 ovary volume from females that had developed in the absence of Vitamin C. n = 9 ovaries per condition were measured, matched with data in Fig. 2c. Statistical significance assessed by two-tailed Student’s t-test and variance determined by F ratio. Centre line represents mean. e, -VitC or control F1 females were mated to wild-type males, and the number of implantation sites per female displaying a vaginal plug was counted between E9.5-E18.5. Ctrl F1 females average 6.5 implants per pregnancy while -VitC F1 females average 4 implants. Statistical significance assessed by two-tailed Student’s t-test. Error bars depict mean ± SEM. f, There is a significant reduction in the number of successful matings in -VitC F1 females. A successful mating is defined as the observation of at least 1 implanted embryo per female that had displayed a vaginal plug after mating. Data collected from n=14 Vitamin C deficient and n=17 control mated females. Statistical significance assessed by Chi-square test. g, Within successful matings only, there is a higher number of resorptions in -VitC F1 females, relative to controls. Statistical significance assessed by two-tailed Student’s t-test. Error bars depict mean ± SEM. h, The number of pregnancies containing at least one resorbed embryo is significantly higher in - VitC F1 females, relative to controls. Data collected from n=5 -VitC and n=12 control pregnant females. Statistical significance assessed by Chi-square test.
Figure 3 ∣
Figure 3 ∣
Vitamin C deficiency induces a Tet1−/− like expression profile in the developing germline. a, Diagram of experiments to determine the molecular impact of Vitamin C deficiency in the embryonic germline. Pregnant mice were deprived of Vitamin C as before and Oct4/EGFP+ germ cells were isolated from single E13.5 embryos. b, Principle component analysis (PCA) of the transcriptional profile of E13.5 germ cells identifies a clear separation of samples according to Vitamin C availability along PC1. Each grey or red dot represents the germ cell transcriptome from a single Ctrl or -VitC female embryo, respectively. N=6 biological replicates per condition were measured. The Ctrl sample closest to the -VitC samples in the PCA plot clusters with them in hierarchical clustering (see Extended Data Fig. 5b). This sample is transcriptionally intermediate between Ctrl and -VitC samples, for reasons unknown. c, MA plot of the differential expression between Ctrl and -VitC samples. The 98 gold dots represent genes significantly up-regulated in -VitC germ cells. The 314 blue dots represent genes down-regulated in -VitC germ cells. Select germline genes previously identified as Tet1- dependent in female germ cells, induced by Vitamin C in ES culture and validated by qRT-PCR (see Extended Data Fig. 1f-i) are highlighted in pink. d, Gene Set Enrichment Analysis (GSEA) highlights the similarities between -VitC (this study) and Tet1−/− female E13.5 germ cells. Both up-regulated or down-regulated genes in Tet1−/− germ cells are highly biased to be up-regulated or down-regulated, respectively, in -VitC E13.5 germ cells. Statistical significance is calculated by a weighted Kolmogorov-Smirnov-like statistic and adjusted for multiple hypothesis testing.
Figure 4 ∣
Figure 4 ∣
Vitamin C deficiency leads to incomplete loss of DNA methylation at meiosis regulators and transposable elements in the embryonic germline. a, Average methylation per CpG across the germ cells of n=6 biologically independent Control and -VitC E13.5 female embryos. Differentially Methylated Regions (DMRs) were defined by hierarchical testing and size-weighted FDR. Blue and red dots represent 285 hypermethylated DMRs and 175 hypomethylated DMRs, respectively. b, GREAT analysis of n=285 hypermethylated DMRs induced by Vitamin C deficiency identifies an enrichment for annotations associated with abnormal ovary development and female infertility (red arrows). c, Distance of n=285 hypermethylated DMRs to gene Transcription Start Sites (TSS) compared to the universe of genomic regions covered by RRBS. DMRs are found primarily at a distance from TSSs. This trend is similar in hypomethylated DMRs. d, Dazl and Spo11 are both examples of hyper DMRs at the promoter of germline regulators. The reduced expression of Dazl at E13.5 is correlated with a gain in promoter methylation. e, DMR-TE analyses reveals that n=460 DMRs (hyper and hypo) are enriched at LINE, LTR and SINE elements relative to the RRBS background. f, Increase CpG methylation is found surrounding the transcriptional start site (TSS) of GRR genes with Vitamin C deficiency. Average GRR gene TSS methylation across n=6 biological replicates per condition was collected. Statistical significance assessed by paired two-sided Wilcoxon test. Box plot hinges correspond to Tukey plot quartiles with median center line. g, GRR genes display reduced gene expression upon Vitamin C deficiency as compared to all genes profiled. Statistical significance assessed by two-sided unpaired Welch’s t-test. Box plot hinges correspond to Tukey plot quartiles with median center line.

References

    1. Barker DJP The developmental origins of adult disease. J Am Coll Nutr 23, 588S–595S (2004). - PubMed
    1. Boekelheide K et al.Predicting later-life outcomes of early-life exposures. Environmental Health Perspectives 120, 1353–1361 (2012). - PMC - PubMed
    1. Seisenberger S et al.The dynamics of genome-wide DNA methylation reprogramming in mouse primordial germ cells. Mol Cell 48, 849–862 (2012). - PMC - PubMed
    1. Hackett JA et al.Germline DNA demethylation dynamics and imprint erasure through 5-hydroxymethylcytosine. Science 339, 448–452 (2013). - PMC - PubMed
    1. Gkountela S et al.DNA Demethylation Dynamics in the Human Prenatal Germline. Cell 161, 1425–1436 (2015). - PMC - PubMed

Methods References

    1. Kim H et al.The analysis of vitamin C concentration in organs of gulo(−/−) mice upon vitamin C withdrawal. Immune Netw 12, 18–26 (2012). - PMC - PubMed
    1. Franks LM & Payne J The influence of age on reproductive capacity in C57BL mice. J. Reprod. Fertil 21, 563–565 (1970). - PubMed
    1. Agathocleous M et al.Ascorbate regulates haematopoietic stem cell function and leukaemogenesis. Nature 549, 476–481 (2017). - PMC - PubMed
    1. Guerquin M-J et al.New testicular mechanisms involved in the prevention of fetal meiotic initiation in mice. Dev Biol 346, 320–330 (2010). - PubMed
    1. Arora R et al.Meiotic onset is reliant on spatial distribution but independent of germ cell number in the mouse ovary. Journal of Cell Science 129, 2493–2499 (2016). - PMC - PubMed

Publication types