. 2019 Sep;573(7773):276-280.
doi: 10.1038/s41586-019-1521-8. Epub 2019 Sep 4.

Salmonella persisters promote the spread of antibiotic resistance plasmids in the gut

Affiliations

Salmonella persisters promote the spread of antibiotic resistance plasmids in the gut

Erik Bakkeren et al. Nature. 2019 Sep.

Abstract

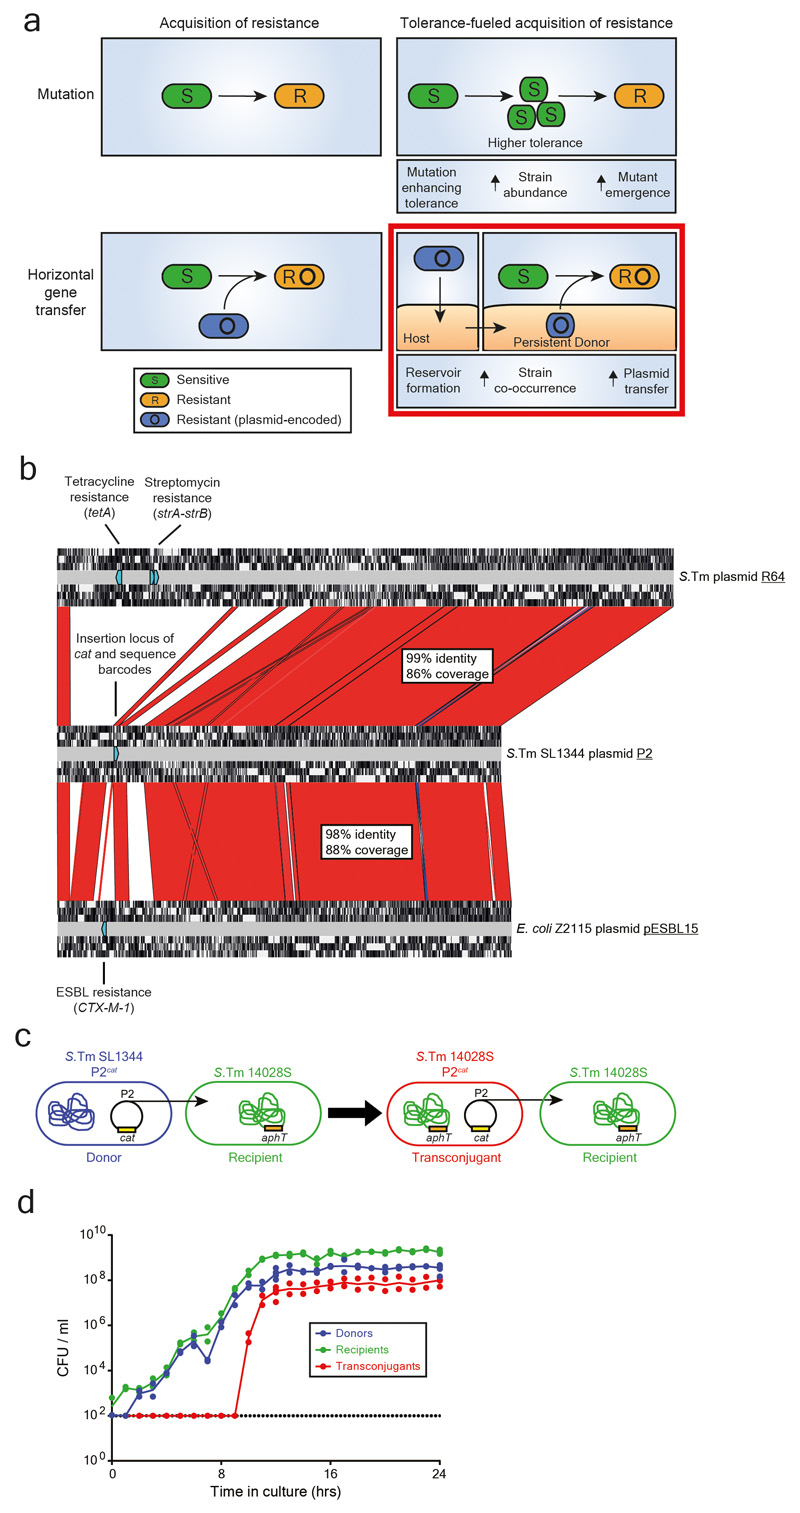
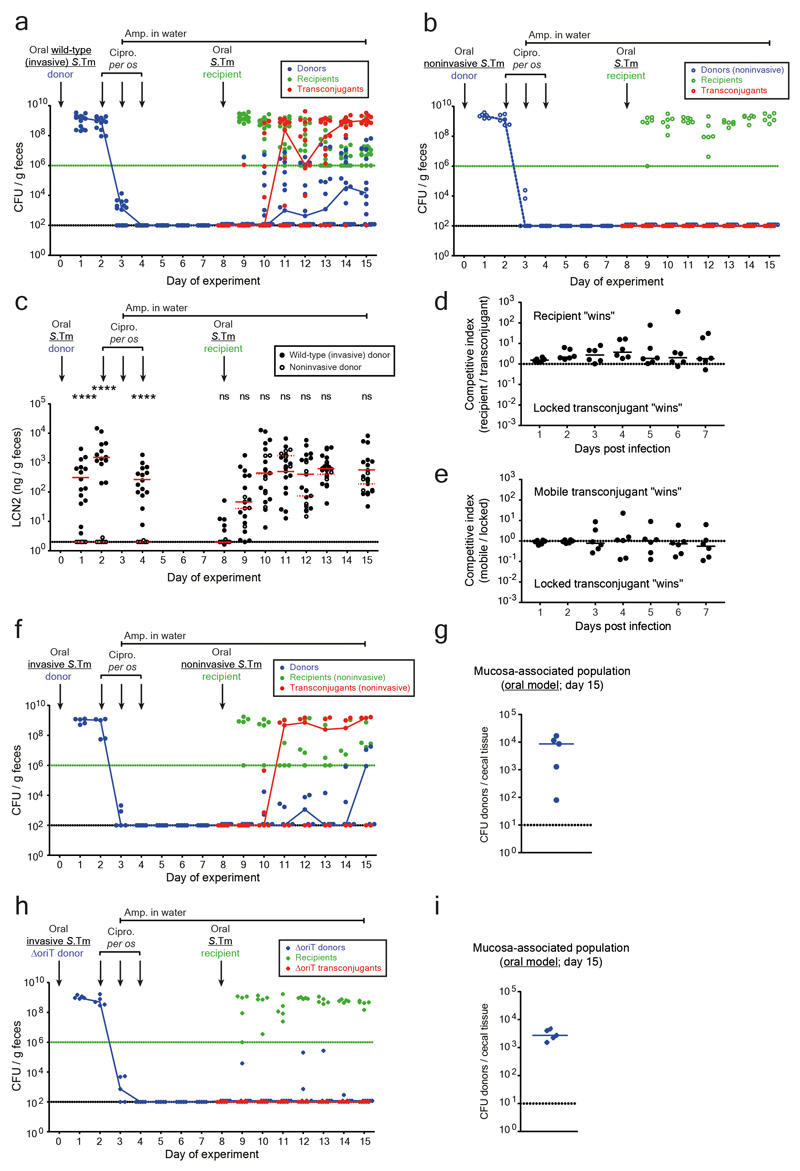
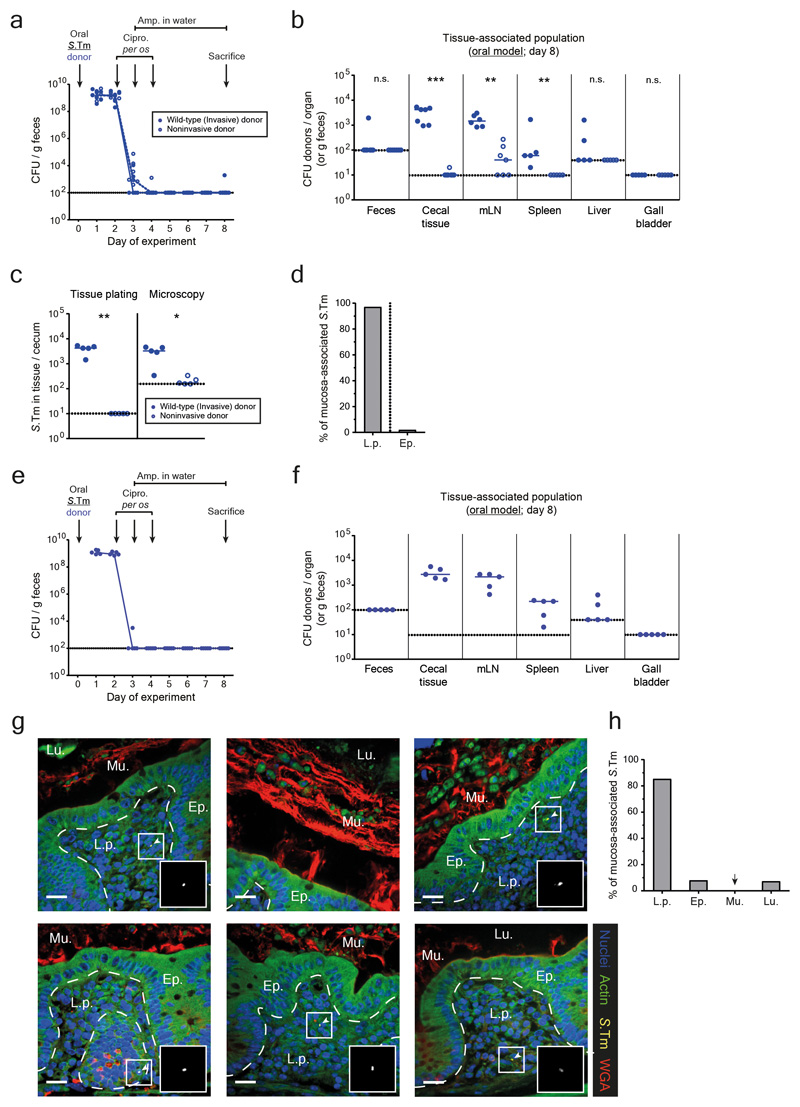
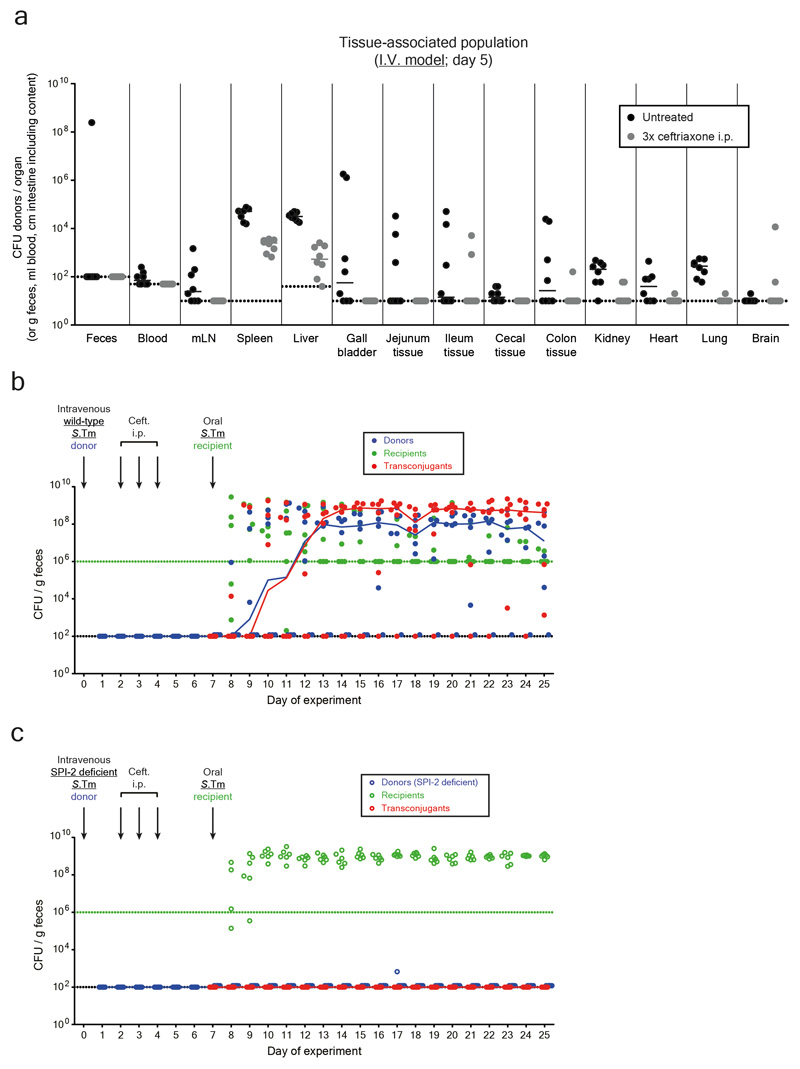
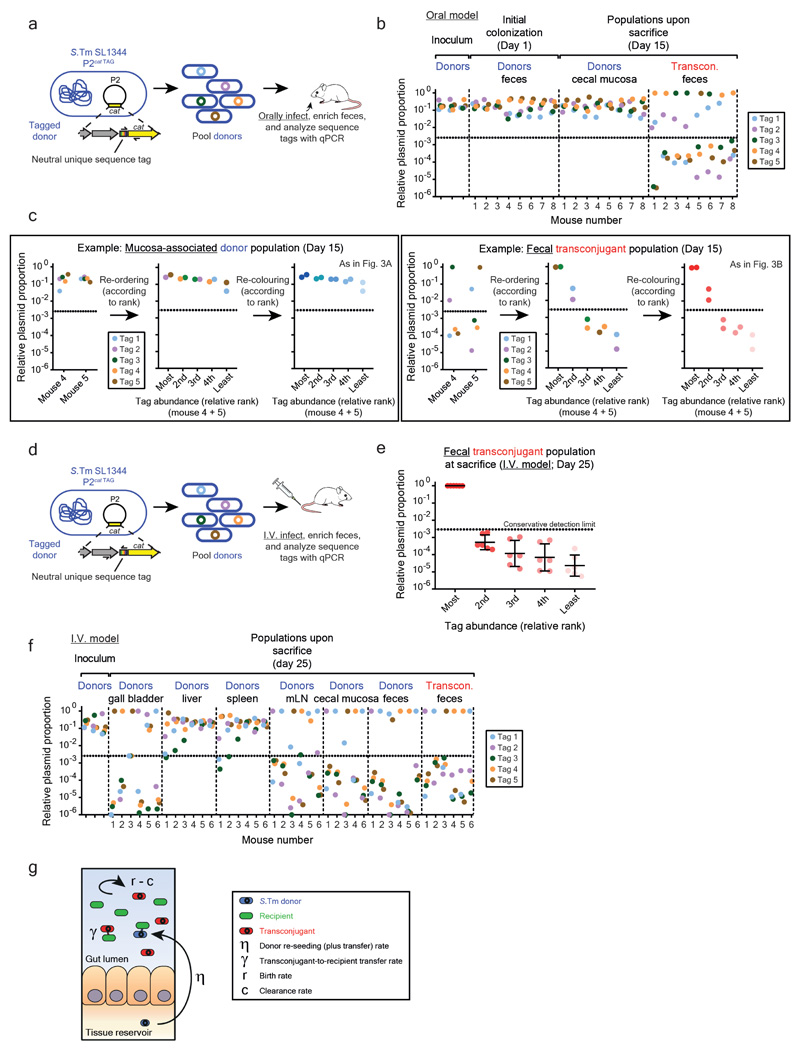
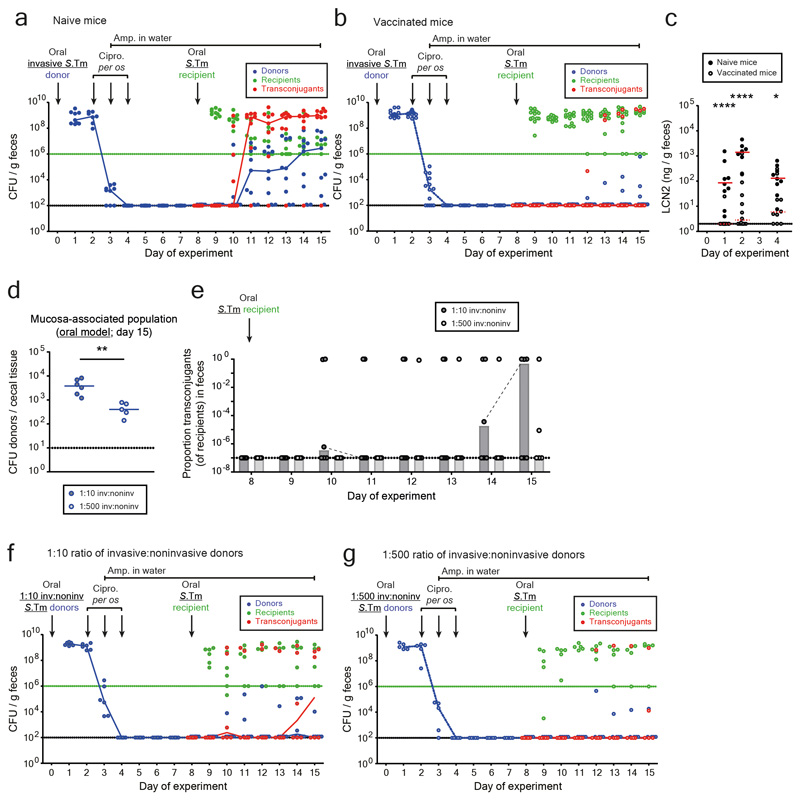
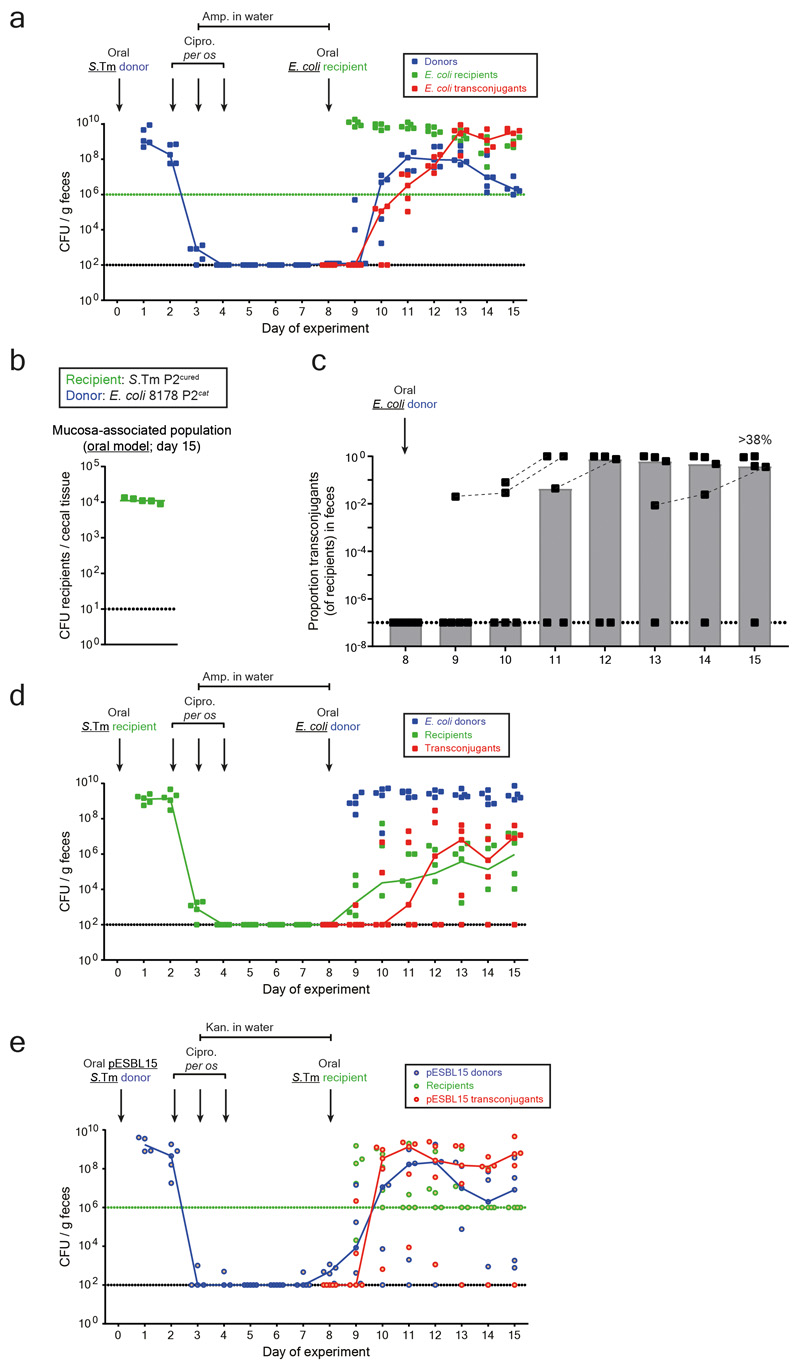
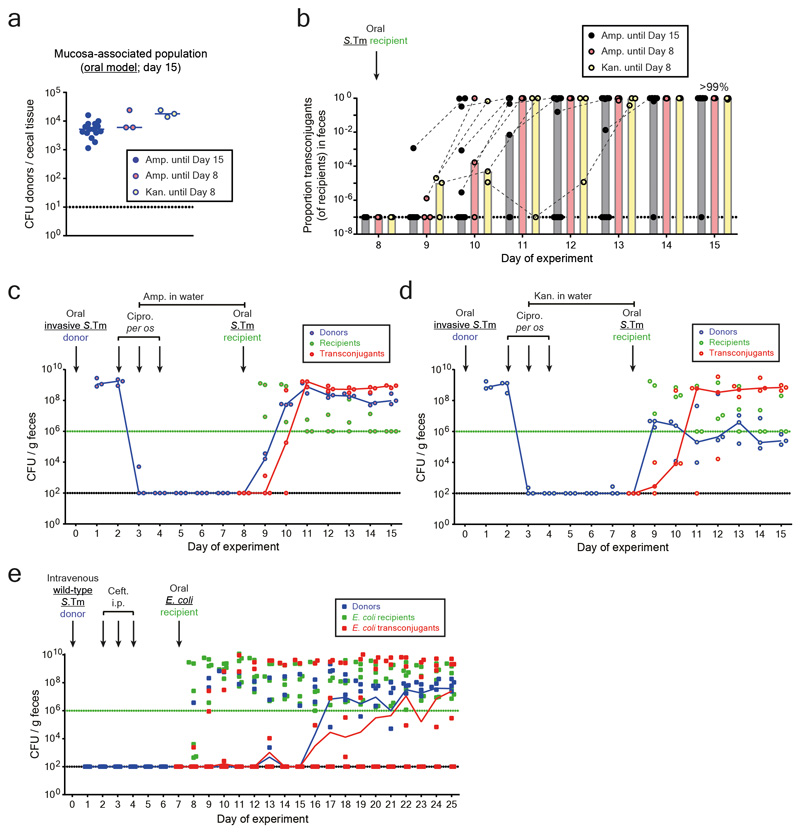
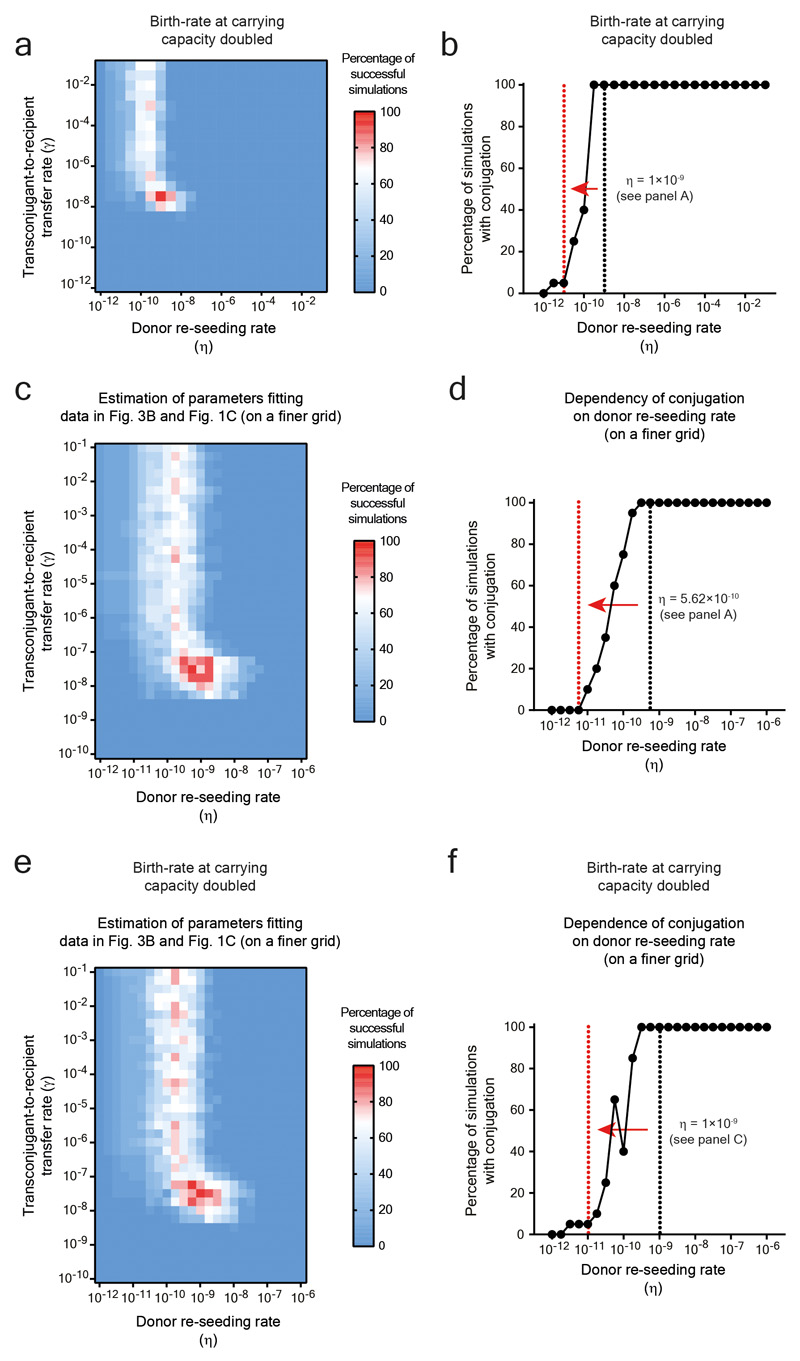
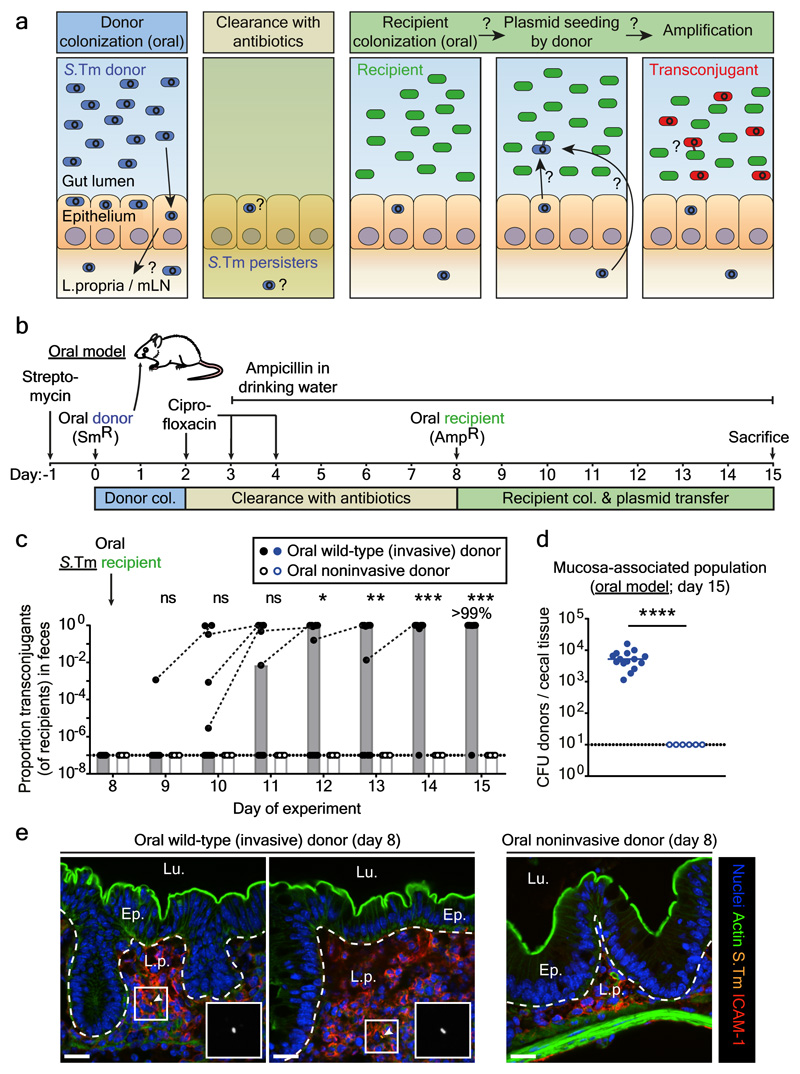
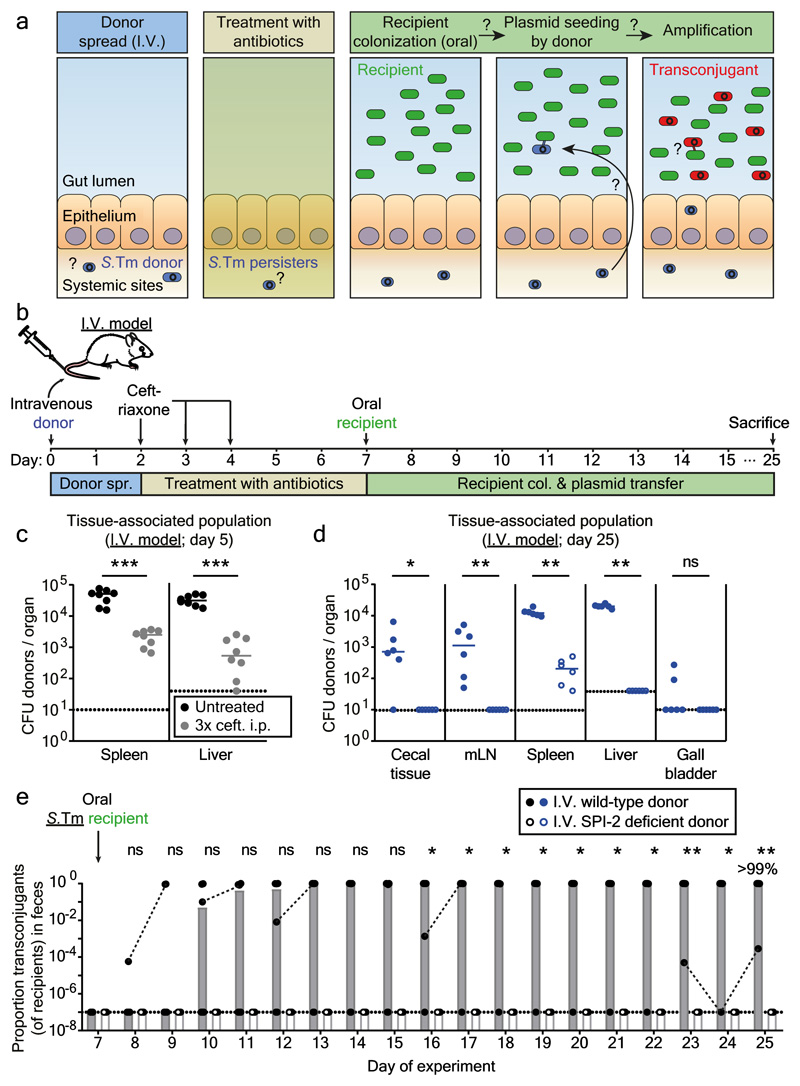
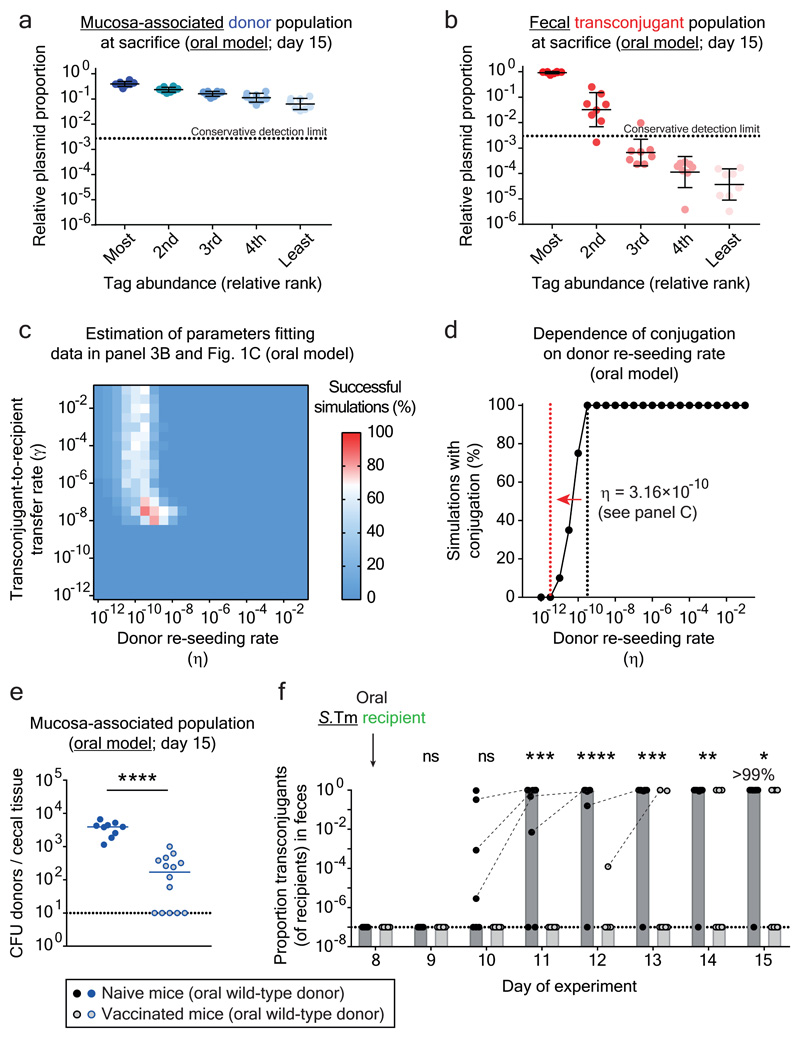
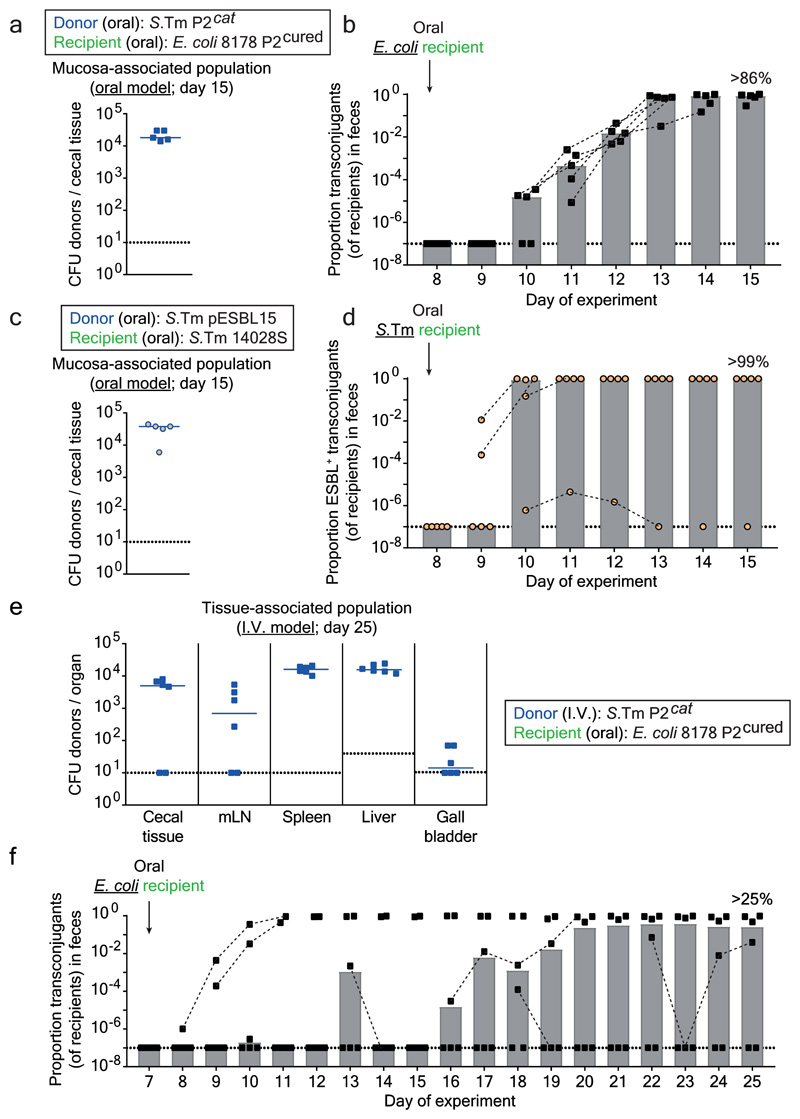
The emergence of antibiotic-resistant bacteria through mutations or the acquisition of genetic material such as resistance plasmids represents a major public health issue1,2. Persisters are subpopulations of bacteria that survive antibiotics by reversibly adapting their physiology3-10, and can promote the emergence of antibiotic-resistant mutants11. We investigated whether persisters can also promote the spread of resistance plasmids. In contrast to mutations, the transfer of resistance plasmids requires the co-occurrence of both a donor and a recipient bacterial strain. For our experiments, we chose the facultative intracellular entero-pathogen Salmonella enterica serovar Typhimurium (S. Typhimurium) and Escherichia coli, a common member of the microbiota12. S. Typhimurium forms persisters that survive antibiotic therapy in several host tissues. Here we show that tissue-associated S. Typhimurium persisters represent long-lived reservoirs of plasmid donors or recipients. The formation of reservoirs of S. Typhimurium persisters requires Salmonella pathogenicity island (SPI)-1 and/or SPI-2 in gut-associated tissues, or SPI-2 at systemic sites. The re-seeding of these persister bacteria into the gut lumen enables the co-occurrence of donors with gut-resident recipients, and thereby favours plasmid transfer between various strains of Enterobacteriaceae. We observe up to 99% transconjugants within two to three days of re-seeding. Mathematical modelling shows that rare re-seeding events may suffice for a high frequency of conjugation. Vaccination reduces the formation of reservoirs of persisters after oral infection with S. Typhimurium, as well as subsequent plasmid transfer. We conclude that-even without selection for plasmid-encoded resistance genes-small reservoirs of pathogen persisters can foster the spread of promiscuous resistance plasmids in the gut.


Conflict of interest statement

Competing interests

The authors declare no competing financial interests.

Figures

Extended data Fig. 1
Extended data Fig. 1. Emergence and spread of antibiotic resistance in bacteria using P2 as a model for conjugation.
a) Antibiotic resistance in bacteria can emerge through mutation or be acquired via horizontal gene transfer. Plasmid transfer is an important driver of the spread of antibiotic resistance. Tolerance increase the abundance of bacteria that survives antibiotic exposure, allowing for a higher probability of emergence of mutations leading to resistance . We hypothesize that antibiotic resistance can also spread through the formation of reservoirs of persistent bacteria containing plasmids (here, we hypothesize that the host gut mucosa can serve as a reservoir for persisters). The formation of long-term reservoirs, followed by re-seeding of bacteria from this reservoir into a niche occupied by other bacteria (e.g. the gut lumen occupied by the microbiota following antibiotic therapy) increases the chance that two different strains interact with each other, leading to plasmid transfer (i.e., increased strain co-occurrence). The graphical representation of the bottom right panel is an example for persistent donors boosting co-occurrence. Please note that persistent, tissue-associated recipients may also increase co-occurrence. b) P2 shares homology with resistance plasmids. An alignment is shown between S.Tm SL1344 P2 (GenBank sequence ID: HE654725.1), S.Tm plasmid R64 (GenBank sequence ID: AP005147.1), and pESBL15 of E. coli Z2115 (strain isolated from a rectal swab of a patient at the University Hospital Basel) using Artemis Comparison Tool (https://www.sanger.ac.uk/science/tools/artemis-comparison-tool-act). Red fill indicates high sequence identity (>85% sequence identity), blue fill indicates inversions, and no fill indicates no sequence identity. For each plasmid, open reading frames (in each of the 6 translational frames) are shown by white regions (detected by Artemis Comparison Tool). Antibiotic resistances (e.g. streptomycin and tetracycline resistances on R64 and CTX-M-1 on pESBL15) are labelled, shown by light blue directed rectangles (found by a Basic Local Alignment Search Tool (NCBI) search against the ResFinder antibiotic resistance gene database ). In P2, the locus for insertion of the chloramphenicol resistance cassette and neutral sequence tags. For each alignment, the percentage of the sequence that aligns to P2 is shown, as well as the average sequence similarity for these regions. c) Model strains for addressing evolution by conjugation in S.Tm. SL1344 contains P2cat (chloramphenicol resistance cassette (cat) allows enumeration of plasmid bearing strains by selective plating) that can be conjugated to 14028S (kanamycin resistance cassette (aphT) used for selective plating) to form a transconjugant (CmR, KanR). Transconjugants can then transfer P2cat to more recipients. d) P2cat transfer kinetics in vitro. P2cat transfer is dependent on the density of donors and recipients. Donor and recipient strains were inoculated into LB (n=2) at a 1:1 ratio and selective plating was performed every hour. CFUs per ml are reported for each population (donors in blue; recipients in green; transconjugants in red). Solid lines connect medians. Dotted line indicates detection limit by selective plating.
Extended data Fig. 2
Extended data Fig. 2. Antibiotic resistance profile of key strains.
Antibiotic susceptibility testing was performed in LB in 96-well plates. 6 strains (indicated in the figure axis) were tested against 7 antibiotics, grown at 37°C at 120 rpm for 16 hours when the OD600nm was measured. For each antibiotic, the highest concentration used was based on the working concentration in this study. For example, the concentration of antibiotic used for selective plating in the case of streptomycin, kanamycin, ampicillin, and chloramphenicol (the highest concentration of chloramphenicol was 5-fold higher than the concentration used for selective plating, since this was already close to the minimum inhibitory concentration), or the concentration of antibiotic used for the gentamycin protection assay. Importantly, a very low minimum inhibitory concentration was observed for antibiotics used in vivo to enrich for persisters (i.e., ciprofloxacin and ceftriaxone). The mean of three experiments is presented on a blue-white colour gradient, where blue indicates a large amount of bacterial growth. This is calculated by subtracting the OD600nm measured for each sample well subtracted by the background generated by the media.
Extended data Fig. 3
Extended data Fig. 3. Controls for conjugation after antibiotic treatment in the oral infection model.
a-c) Fecal bacterial population sizes and inflammatory status of mice in Figure 1c-d (comparison of invasive vs. noninvasive donors in the oral model). Fecal loads of donors (blue; SmR, CmR), recipients (green; KanR), and transconjugants (red; CmR, KanR) were determined by selective plating on MacConkey agar. Black dotted line indicates detection limits for donors and transconjugants. Green dotted line indicates detection limit for recipients (the detection limit is higher for recipients once transconjugants reach a density of >108 CFU/g feces. Before this happens, recipients can be found below the detection limit and then the black dotted line should be considered as the detection limit). Blue lines connect medians of donor populations; red lines connect medians of transconjugant populations. a) Mice infected with invasive S.Tm donors (solid circles; n=15 singly housed mice from five independent experiments). b) Mice infected with noninvasive S.Tm donors (open circles; n=6 singly housed mice from two independent experiments). c) Inflammatory status was determined by lipocalin-2 ELISA. Statistics are performed using a two-tailed Mann-Whitney U test p>0.05 (ns), p<0.0001 (****) comparing mice infected with an invasive donor (solid black circles; n=15 singly housed mice from five independent experiments) to mice infected with a noninvasive donor (open black circles; n=6 singly housed mice from two independent experiments) at each time point. Medians are shown (solid red line for invasive donors; dotted red line for noninvasive donors). Dotted line indicates detection limit. d-e) Carrying P2cat does not lead to a measurable fitness cost or benefit. d) A "locked" transconjugant (14028S P2aphT ΔoriT; conjugation is blocked by removing the origin of transfer; KanR, AmpR) was competed against a recipient (14028S cat; CmR, AmpR). e) To ensure removing the origin of transfer did not affect fitness, the locked transconjugant was competed against a transconjugant with a normal P2cat plasmid (i.e., mobile transconjugant) (14028S P2cat; CmR, AmpR). In panel d-e, both strains were introduced at a 1:1 ratio (total inoculum size ~5×10⁷ CFU per os) and feces were monitored daily by selective plating (n=6 singly housed mice from two independent experiments for both experiments). Competitive index is calculated by dividing the population size of one competitor by the other. Lines indicate medians. The dotted line indicates no competitive advantage for either strain. This is in line with published data . These data indicate that it is the plasmid-encoded conjugation efficiency (not its effects on host bacterial fitness) that drives the prodigal rise of transconjugants (Fig. 1c). f-g) Plasmid transfer in the oral model does not require an invasive recipient. Invasive donors (SL1344 P2cat; SmR, CmR) were orally infected into pretreated mice. After ciprofloxacin treatment, a noninvasive mutant of S.Tm 14028S was used as a recipient (14028Snoninv aphT (KanR, AmpR); n=5). f) Selective plating determined fecal loads of donors (blue; SmR, CmR), recipients (green; KanR), and transconjugants (red; CmR, KanR). Black dotted line indicates detection limit for donors and transconjugants. Green dotted line indicates detection limit for recipients (the detection limit is higher for recipients once transconjugants reach a density of >108 CFU/g feces. Before this happens, recipients can be found below the detection limit and then the black dotted line should be considered as the detection limit). Blue lines connect medians of donor populations; red lines connect medians of transconjugant populations. g) Donor populations enumerated after a gentamycin protection assay on cecal tissue of mice shown in panel f. Median indicated by solid line. Dotted line indicates detection limit. h-i) conjugation is required for plasmid transfer after antibiotic treatment. Mice were infected with invasive S.Tm lacking the origin of transfer in P2cat (SL1344 P2cat ΔoriT; SmR, CmR) as a donor, and 14028S aphT (KanR, AmpR) as a recipient after antibiotic treatment (n=5). h) Selective plating determined fecal loads of donors (blue; SmR, CmR), recipients (green; KanR), and transconjugants (red; CmR, KanR). Black dotted line indicates detection limit for donors and transconjugants. Green dotted line indicates detection limit for recipients (the detection limit is higher for recipients once transconjugants reach a density of >108 CFU/g feces. Before this happens, recipients can be found below the detection limit and then the black dotted line should be considered as the detection limit). Blue lines connect medians of donor populations; red lines connect medians of transconjugant populations. i) Donor populations enumerated after a gentamycin protection assay on cecal tissue of mice shown in panel h. Median indicated by solid line. Dotted line indicates detection limit.
Extended data Fig. 4
Extended data Fig. 4. Quantification and localization of S.Tm in the host mucosa after antibiotic treatments in the oral model.
a-d) Mice were orally infected with either an invasive (SL1344 P2cat; blue solid circles; n=7) or noninvasive (SL1344noninv P2cat; T3SS-1 negative; blue open circles; n=7) donor and treated with antibiotics. Mice were sacrificed at day 8 after infection (when recipients are normally added) and organs were analyzed. Dotted lines indicate detection limits. a) Fecal populations were monitored daily by selective plating on MacConkey agar. Blue lines connect medians. b) Organ loads were determined by selective plating. mLN: mesenteric lymph nodes. c) Population size of donors in the cecal mucosa determined by selective plating after a gentamycin protection assay or microscopy of tissue sections (same mice for each quantification method). Each data point is the average of 12 sections (10 μm thick). Panel b-c) Statistics are performed using a two-tailed Mann-Whitney U test p>0.05 (ns), p<0.05 (*), p<0.01 (**), p<0.001 (***), p<0.0001 (****) comparing mice infected with invasive or noninvasive donors for each organ. d) Localization of S.Tm detected in the cecal tissue by microscopy, reported as a percentage of bacteria detected in panel c in either the lamina propria (L.p.) or epithelium (Ep.). Bar indicates the median from 5 mice. e-h) Analysis of persister reservoirs in Carnoy-fixed cecal tissue sections. Mice were orally infected with an invasive (SL1344 P2cat; n=5) donor and treated with antibiotics. Mice were sacrificed at day 8 after infection (when recipients are normally added) and organs were analyzed. Dotted lines indicate detection limits. e) Fecal populations were monitored daily by selective plating on MacConkey agar. Blue lines connect medians. f) Organ loads were determined by selective plating. mLN: mesenteric lymph nodes. Line indicates median. g) A Carnoy fixation was performed on ceca of mice to preserve the mucus structure. 10 μm sections were stained to visualize S.Tm (yellow; α-LPS O5), actin (green; phalloidin-FITC), the mucus (red; wheat germ agglutinin (WGA) AF647 conjugate), and nuclei (blue; DAPI). Ep., epithelium; Lu., Lumen; L.p., lamina propria. Mu., mucus. Scale bars represent 20μm. White arrows highlight S.Tm (magnified in inset). Representative images shown from two independent experiments. h) Localization of S.Tm detected in the cecal tissue by microscopy, reported as a percentage of bacteria detected each section (12 sections per mouse cecum) in the lamina propria (L.p.), epithelium (Ep.), mucus (Mu.), or lumen (Lu.). Bar indicates the median from 5 mice.
Extended data Fig. 5
Extended data Fig. 5. Determination of tissue-associated persister reservoirs after I.V. infection, and subsequent plasmid transfer.
a) An equal mix of five SL1344 P2cat TAG strains (SmR, CmR) were I.V. infected into mice (103 CFU). Treatments were as described in Fig. 2b (grey circles; 3 doses of ceftriaxone i.p.; n=8 singly housed from two independent experiments), or mice were left untreated (black circles; n=8 singly housed from two independent experiments). Mice were sacrificed on day 5 of the experiment (after the final dose of ceftriaxone was given). The tissue-associated populations in organs were enumerated by selective plating. Detection limit by selective plating is shown as a dotted line. Lines indicate median. b-c) Fecal bacterial population sizes of mice in Figure 2D-E (comparison of wild-type vs. SPI-2 negative donors in the I.V. model). Fecal loads of donors (blue; SmR, CmR), recipients (green; KanR), and transconjugants (red; CmR, KanR) were determined by selective plating on MacConkey agar. Black dotted line indicates detection limits for donors and transconjugants. Green dotted line indicates detection limit for recipients (the detection limit is higher for recipients once transconjugants reach a density of >108 CFU/g feces. Before this happens, recipients can be found below the detection limit and then the black dotted line should be considered as the detection limit). Blue lines connect medians of donor populations; red lines connect medians of transconjugant populations. b) Mice infected with wild-type S.Tm donors (solid circles). c) Mice infected with SPI-2 deficient S.Tm donors (open circles).
Extended data Fig. 6
Extended data Fig. 6. Experimental strategy for assessing population dynamics and tag frequencies for figure 3a-d.
a-c) Tags introduced in the oral model. a) Tags coupled to a chloramphenicol resistance cassette were introduced in P2. qPCR primers are specific to the chloramphenicol resistance cassette and the specific tag (shown as one-sided arrows). Five tagged donors were pooled and orally infected as a 1:1:1:1:1 mix into mice. b) Relative plasmid tag proportion detected by qPCR in the initial donor population, the donor population persisting in the cecal mucosa, and the transconjugant population is shown for 8 mice (3 independent inocula). Dotted line indicates the detection limit. Each tag is given a unique colour. c) Scheme illustrating how tags were sorted and recoloured to yield the plots in Fig. 3a-b. Two mice are shown as examples. For both mucosa-associated donor populations (top panel) and fecal transconjugant populations (bottom panel), tags were sorted according to relative frequency. These tags were re-coloured (darker colour indicates higher frequency) in order to visualize the trends shown in Fig. 3a-b. These re-ordered tags were used as the experimental data for fitting the mathematical model. d-f) Experimental strategy to assess plasmid transfer dynamics in the I.V. model. d) Tags coupled to a chloramphenicol resistance cassette were introduced in P2. qPCR primers are specific to ydgA, a pseudogene flanking the specific tags, and the specific tag (shown as one-sided arrows). Five tagged donors were pooled and I.V. infected as a 1:1:1:1:1 mix into mice. e) Tags from the fecal transconjugant population at day 25 are sorted by abundance. Note that each abundance rank can consist of any tag (see ranking and re-colouring scheme in panel c; raw tag data in panel f of this figure; n=6 singly housed mice from two independent experiments). Dotted line indicates conservative detection limit by qPCR. This detection limit refers to the most conservative detection limit of any qPCR run (2.9×10⁻³; i.e., tags can appear below this detection limit if the qPCR run yielded a lower detection limit). Line indicates mean; error bars indicate standard deviation. f) Relative plasmid tag proportion detected by qPCR in the inoculum, the donor population persisting in the internal organs, and the transconjugant population in the feces is shown for 6 mice (3 independent inocula; feces and organ population data in Fig. 2d). Dotted line indicates the detection limit. Each tag is given a unique colour. g) Graphical representation of key parameters in the mathematical model. Donors form a persistent reservoir in host tissues. These cells can interact with other bacteria colonizing the gut lumen (i.e., recipients) and transfer plasmids. Our mathematical model summarizes these plasmid transfer dynamics using a few key parameters. Donors re-seed the gut lumen and transfer plasmids at rate η, transconjugants transfer plasmids to recipients (without a plasmid) with rate γ, and the turn-over of each bacterial population is given by r-c, where r is the birth rate and c the clearance rate.
Extended data Fig. 7
Extended data Fig. 7. Fecal bacterial population sizes and inflammatory status of mice in Figure 3e-f (comparison of vaccinated vs. naïve mice in the oral model) and validation by mixtures of invasive and noninvasive donors.
a-b) Fecal loads of donors (blue; SmR, CmR), recipients (green; KanR), and transconjugants (red; CmR, KanR) were determined by selective plating on MacConkey agar. Barcode analysis of the recipient chromosome tags could not be performed for technical issues with kanamycin enrichments and subsequent qPCR. Black dotted lines indicate detection limits for donors and transconjugants. Green dotted line indicates detection limit for recipients (the detection limit is higher for recipients once transconjugants reach a density of >108 CFU/g feces. Before this happens, recipients can be found below the detection limit and then the black dotted line should be considered as the detection limit). Blue lines connect medians of donor populations; red lines connect medians of transconjugant populations. a) Naïve mice infected with invasive S.Tm donors (solid circles). b) Vaccinated mice infected with invasive S.Tm donors (open circles with light-grey fill). c) Inflammatory status to determine the success of vaccination was determined by lipocalin-2 ELISA. Statistics are performed using a two-tailed Mann-Whitney U test p>0.05 (ns), p<0.05 (*), p<0.01 (**), p<0.001 (***), p<0.0001 (****) comparing naïve mice (black circles; n=9 singly housed mice from three independent experiments) to vaccinated mice (open circles; n=14 singly housed mice from four independent experiments) at each time point. Medians are shown (solid red line for naïve mice; dotted red line for vaccinated mice). Dotted line indicates detection limit. d-g) Experimentally reducing the population size of mucosa-associated persisters by mixing invasive and noninvasive donors reduces plasmid transfer in the oral model. Mice were orally infected with a mixture of invasive (SL1344 P2cat; SmR, CmR) and noninvasive (SL1344noninv P2cat; SmR, CmR) donors at two ratios: 1:10 (n=6 singly housed mice) or 1:500 (n=5 singly housed mice). In both cases, an excess of noninvasive donors were used to experimentally reduce the number of cells that can establish a persistent reservoir in the intestinal mucosa (two independent experiments). S.Tm 14028S aphT (KanR, AmpR) was used as a recipient after antibiotic treatment. d) Donor populations enumerated after a gentamycin protection assay on cecal tissue of mice infected with a 1:10 ratio (blue circles with dark grey fill; line indicates median) or 1:500 ratio (blue circles with light grey fill; line indicates median) of invasive to noninvasive donors. Statistics are performed using a two-tailed Mann-Whitney U test p<0.01 (**). e) Proportion of transconjugants (transconjugant population size divided by sum of recipients and transconjugants) in the feces is shown for each day for both mice infected with a 1:10 ratio (black circles with dark grey fill; grey bars indicate median) or 1:500 ratio (black circles with light grey fill; light grey bars indicate median) of invasive to noninvasive donors. f-g) Fecal loads of donors (blue; SmR, CmR), recipients (green; KanR), and transconjugants (red; CmR, KanR) were determined by selective plating on MacConkey agar. f) Mice infected with a 1:10 ratio of invasive to noninvasive donors. g) Mice infected with a 1:500 ratio of invasive to noninvasive donors. d-g) Black dotted line indicates detection limit for donors and transconjugants. Green dotted line indicates detection limit for recipients (the detection limit is higher for recipients once transconjugants reach a density of >108 CFU/g feces. Before this happens, recipients can be found below the detection limit and then the black dotted line should be considered as the detection limit).
Extended data Fig. 8
Extended data Fig. 8. Fecal bacterial population sizes of mice in Figure 4 and the role of persistence and conjugation in host tissues if the recipient constitutes the reservoir.
a) Fecal loads of donors (blue; SmR, CmR), recipients (green; AmpR), and transconjugants (red; CmR, AmpR) were determined by selective plating on MacConkey agar (same mice as in Fig. 4a-b; S.Tm donor and E. coli recipient in the oral model). Black dotted line indicates detection limit for donors and transconjugants. Green dotted line indicates detection limit for recipients (the detection limit is higher for recipients once transconjugants reach a density of >108 CFU/g feces. Before this happens, recipients can be found below the detection limit and then the black dotted line should be considered as the detection limit). Blue lines connect medians of donor populations; red lines connect medians of transconjugant populations. b-d) Persistence in host tissues also promote plasmid transfer if the recipient constitutes the reservoir. Pretreated mice were orally infected with a S.Tm recipient (SL1344 P2cured aphT; SmR, KanR) and treated with ciprofloxacin and ampicillin as in the oral model (Fig. 1b). On day 8, ampicillin was removed from the drinking water and an E. coli donor was introduced orally (E. coli 8178 P2cat; CmR, AmpR). b) Recipient populations enumerated after a gentamycin protection assay on cecal tissue (n=5 singly housed mice from two independent experiments). Line indicates median. c) Proportion of transconjugants (transconjugant population size divided by sum of recipients and transconjugants) in the feces is shown for each day. Grey bars indicate median. d) Fecal loads of recipients (green; SmR, KanR), donors (blue; CmR, AmpR), and transconjugants (red; SmR, CmR, KanR) were determined by selective plating on MacConkey agar. b-d) Dotted lines indicate detection limits by selective plating. e) Fecal bacterial populations sizes of mice in Figure 4c-d (S.Tm ESBL donor in the oral model). Fecal loads of donors (blue; SmR, AmpR), recipients (green; KanR), and transconjugants (red; KanR, AmpR) were determined by selective plating on MacConkey agar. Black dotted line indicates detection limit for donors and transconjugants. Green dotted line indicates detection limit for recipients (the detection limit is higher for recipients once transconjugants reach a density of >108 CFU/g feces. Before this happens, recipients can be found below the detection limit and then the black dotted line should be considered as the detection limit). Blue lines connect medians of donor populations; red lines connect medians of transconjugant populations.
Extended data Fig. 9
Extended data Fig. 9. Exchanging ampicillin for kanamycin in order to limit gut luminal growth of the donor does not affect the overall plasmid transfer kinetics and fecal bacteria population sizes of I.V. infected mice in Figure 4.
a-d) Mice were orally infected with SL1344 P2cat (SmR, CmR) as a donor, and 14028S aphT (KanR, AmpR) as a recipient after antibiotic treatment. Mice were either treated with ampicillin in the drinking water until day 15 (normal protocol as in Fig. 1b), day 8 (when the recipient is added), or kanamycin until day 8. a) Donor populations enumerated after a gentamycin protection assay on cecal tissue of mice in which ampicillin is maintained until day 15 (solid blue circles; n=15 singly housed mice from five independent experiments; data taken from Fig. 1d), ampicillin is removed on day 8 (blue circles with pink fill; n=3 singly housed mice from one experiment), or kanamycin is used until day 8 (blue circles with yellow fill; n=3 singly housed mice from one experiment). Median indicated by solid line. b) Proportion of transconjugants (transconjugant population size divided by sum of recipients and transconjugants) is shown for the groups receiving ampicillin treatment until day 15 (solid black circles; grey bars indicate median; n=15 singly housed mice from five independent experiments; data taken from Figure 1c), ampicillin treatment until day 8 (black circles with pink fill; pink bars indicate median; n=3 singly housed mice from one experiment), and kanamycin treatment until day 8 (black circles with yellow fill; yellow bars indicate median; n=3 singly housed mice from one experiment). c-d) Fecal loads of donors (blue; SmR, CmR), recipients (green; KanR), and transconjugants (red; CmR, KanR) were determined by selective plating on MacConkey agar. c) Mice treated until day 8 with ampicillin. d) Mice treated until day 8 with kanamycin. a-d) Black dotted line indicates detection limit for donors and transconjugants. Green dotted line indicates detection limit for recipients (the detection limit is higher for recipients once transconjugants reach a density of >108 CFU/g feces. Before this happens, recipients can be found below the detection limit and then the black dotted line should be considered as the detection limit). e) Fecal bacterial populations sizes of mice in Figure 4E-F (S.Tm donor and E. coli recipient in the I.V. model). Fecal loads of donors (blue; SmR, AmpR), recipients (green; KanR), and transconjugants (red; KanR, AmpR) were determined by selective plating on MacConkey agar. Black dotted line indicates detection limit for donors and transconjugants. Green dotted line indicates detection limit for recipients (the detection limit is higher for recipients once transconjugants reach a density of >108 CFU/g feces. Before this happens, recipients can be found below the detection limit and then the black dotted line should be considered as the detection limit). Blue lines connect medians of donor populations; red lines connect medians of transconjugant populations.
Extended data Fig. 10
Extended data Fig. 10. Increasing growth rate at carrying capacity to model inflammation or running simulations on a finer parameter grid does not affect overall simulation trends.
a-b) Simulations were run with identical parameters to Figure 3c-d, but an increased birth and death rate at carrying capacity to simulate cases in which inflammation is present (see supplementary material). The trends of the simulations remain the same as in Figure 3c-d. a) Likelihood of the model as a function of the donor re-seeding (including donor-to-recipient conjugation) rate (η), and the rate of transconjugant-to-recipient plasmid transfer (γ). All other parameter values are given in the supplementary materials. The most likely parameter set is shown in red (η = 1×10⁻⁹ per day; γ = 3.16×10⁻⁸ per CFU/g feces per day). b) The fraction of simulations with plasmid re-seeding, defined as a final transconjugant population size above 5×10⁸ CFU/g feces, as a function of η. Here γ is fixed at its most likely value γ = 3.16×10⁻⁸ per CFU/g feces per day. The black vertical dotted line at η = 1×10⁻⁹ per day indicates the estimated most likely value (from panel a). The red vertical dotted line at η = 1×10-11 per day indicates a hypothetical 100-fold decrease of η (shown by a red arrow; e.g. by vaccination). c-f) Running simulations on a finer parameter grid does not affect overall simulation trends. See Supplementary table 4 for details on differences between specific simulation results. c-d) Simulations were run on a grid of [η = 10-12-10-6, γ = 10-10-10-1] with 0.25 log increments (rather than the [η = 10-12-10-1, γ = 10-12-10-1] with 0.5 log increments used in Figure 3c-d). e-f) Simulations were run with parameters identical to panel a-b, but on a grid of [η = 10-12-10-6, γ = 10-10-10-1] with 0.25 log increments (rather than the [η = 10-12-10-1, γ = 10-12-10-1] with 0.5 log increments). c, e) Likelihood of the model as a function of the donor re-seeding (including donor-to-recipient conjugation) rate (η), and the rate of transconjugant-to-recipient plasmid transfer (γ). All other parameter values are given in the supplementary materials. The most likely parameter set is shown in red. d, f) The fraction of simulations with plasmid re-seeding, defined as a final transconjugant population size above 5×10⁸ CFU/g feces, as a function of η. Here γ is fixed at its most likely value. The black vertical dotted line indicates the estimated most likely value (from panel c or e). The red vertical dotted line indicates a hypothetical 100-fold decrease of η (shown by a red arrow; e.g. by vaccination).
Figure 1
Figure 1. Gut-tissue associated S.Tm persisters are a reservoir for conjugative plasmids.
a) Working hypothesis. Plasmid-bearing S.Tm (blue) form persisters (smaller, circular shape) in gut tissues and the mLN. These can survive antibiotic treatment, re-seed the gut lumen and transfer their plasmid to recipients (green). Transconjugants (red) can further amplify plasmid spread. b) Oral infection mouse model. c) Donor mucosa invasion is required for persister-promoted plasmid transfer. Invasive (SL1344 P2cat; SmR, CmR) or non-invasive S.Tm (SL1344noninv P2cat; TTSS-1 negative; SmR, CmR) were used as donors and S.Tm 14028S aphT (P2 free) as recipients (KanR, AmpR), as shown in panel b. Transconjugant proportions in feces from experiments with invasive (solid black circles; grey bars indicate median; n=15 mice; 5 independent experiments; n=9 mice pooled from data in Fig. 3) or noninvasive donors (open black circles; white bars indicate median; n=6 mice; 2 independent experiments). Dashed lines connect data points from the same mice. d) Donor reservoirs in the cecal mucosa from mice as infected in panel c were quantified by tissue gentamycin protection. Solid blue circles: invasive donors; open blue circles: noninvasive donors; lines indicate the median; Statistics are performed using a two-tailed Mann-Whitney U test (p>0.05 (ns), p<0.05 (*), p<0.01 (**), p<0.001 (***), p<0.0001 (****)). Dotted line: detection limit. e) Persisters in the cecum lamina propria (oral model; day 8). S.Tm (yellow; α-LPS O5 and α-LPS O12 staining), nuclei (blue), actin (green) and lamina propria (ICAM-1; red) are stained. Ep., epithelium; Lu., Lumen; L.p., lamina propria. Scale bars=20μm. White arrows highlight S.Tm (magnified in inset). Representative of three independent experiments. Quantification is provided in Extended Data Fig. 4.
Figure 2
Figure 2. Persisters at systemic sites are a reservoir for plasmid transfer in the gut.
a) Working hypothesis. Same as Fig. 1a, but donors are introduced by intravenous infection. b) I.V. infection mouse model. c) Persisters in the spleens and livers. In two independent experiments, n=8 mice (grey circles) were infected i.v. with an equal mix of five SL1344 P2cat TAG strains (SmR, CmR). Black circles indicate control mice (n=8) infected for 5 days without ceftriaxone treatment. Extended Data Fig. 5a shows counts for additional organs. d-e) SPI-2 promotes donor reservoir formation at systemic sites. In two independent experiments, mice were infected as described in panel B with donors, i.e. mixtures of five wild-type (n=6; closed circles) or SPI-2 deficient (n=6; open circles) SL1344 P2cat TAG strains (SmR, CmR). d) Donor populations in internal organs from mice infected with wild-type (solid blue) or SPI-2 deficient donors (open blue). Lines indicate the median. e) Fecal populations from mice from panel d. Transconjugant proportions in feces from experiments with wild-type (solid black circles; grey bars indicate median) or noninvasive donors (open black circles; white bars indicate median). Dashed lines connect data points from the same mice. Statistics are performed using a two-tailed Mann-Whitney U test (p>0.05 (ns), p<0.05 (*), p<0.01 (**), p<0.001 (***)). Dotted lines: detection limits.
Figure 3
Figure 3. Plasmid transfer is initiated by rare donor re-seeding events and can be prevented by vaccination.
Mice were orally infected (Fig. 1b) with tagged donor (five SL1344 P2cat TAG; SmR, CmR) and recipient mixtures (five 14028S TAG strains; KanR, AmpR; n=8 mice; three independent experiments). Donors, recipients and transconjugants were enumerated by plating (Extended Data Fig. 7a) and plasmid-tag distributions analyzed by qPCR (raw data shown in Extended Data Fig. 6b). a-b) Plasmid-tag distribution in mucosa-associated donors and fecal transconjugants at day 15. Dotted lines indicate conservative qPCR detection limits (2.9×10⁻³). Line indicates mean; error bars indicate standard deviation. c) Modeling results. Simulations are described in the supplementary discussion. A rate of donor re-seeding and donor-to-recipient conjugation of η = 3.16×10⁻¹⁰ per day and a rate of transconjugant-to-recipient conjugation of γ = 3.16×10⁻⁸ per CFU/g feces per day optimally fit the data (red). d) Effect of η on transconjugant detection. Analysis as described in the supplementary discussion. Reducing η by 100-fold below the value estimated for naïve mice (black dotted line; η = 3.16×10⁻¹⁰) diminishes transconjugant detection (red dotted line). e-f) Vaccination diminishes conjugation. Mice vaccinated with killed S.Tm (open circles; n = 14; four independent experiments) or PBS (naïve; closed circles; n = 9; three independent experiments) were infected with tagged donor and recipient mixtures as in panel a-b. Donors, recipients and transconjugants were enumerated by plating. e) Mucosa-associated donor populations at day 15. f) Fecal transconjugant proportions in naive (black circles; grey bars indicate median) or vaccinated mice (light gray circles; light gray bars indicate median) from panel e. Dashed lines connect data points from the same mice. Statistics are performed using a two-tailed Mann-Whitney U test (p>0.05 (ns), p<0.05 (*), p<0.01 (**), p<0.001 (***), p<0.0001 (****)). Dotted lines: detection limits.
Figure 4
Figure 4. Tissue-associated persisters promote resistance plasmid transfer between different Enterobacteriaceae.
a-b) Plasmid transfer to E. coli. 5 mice (one experiment) were infected orally as described in Fig. 1b-d with donors (S.Tm SL1344 P2cat; SmR, CmR) and recipients (E. coli 8178 P2cured (AmpR)). Mucosa-associated donors and fecal transconjugants were enumerated by plating. Median indicated by solid line. Bars indicate median. c-d) ESBL plasmid transfer between Salmonella spp.. The experiment used S.Tm SL1344 pESBL15; SmR, AmpR as the donor and S.Tm 14028S aphT; KanR as recipient (n=5 mice; one experiment). It was performed and evaluated as in panels a-b, except that we used kanamycin from day 3-8 instead of ampicillin in the drinking water, since pESBL15 confers ampicillin resistance. e-f) Plasmid transfer from S.Tm to E. coli using the i.v. model. 6 mice (two independent experiments) were infected as described in Fig. 2b-e with donors (S.Tm SL1344 P2cat; SmR, CmR; i.v.) and recipients (E. coli 8178 P2cured (AmpR); oral). Tissue-associated donors and fecal transconjugants were enumerated by plating. Median indicated by solid line. Bars indicate median. Panel a-f) Dotted lines indicate detection limit by selective plating. Panel b, d, f) Dashed lines connect data points from the same mice to illustrate the progression of plasmid spread after initial detection.

Comment in

References

    1. Parisi A, et al. Health Outcomes from Multidrug-Resistant Salmonella Infections in High-Income Countries: A Systematic Review and Meta-Analysis. Foodborne Pathog Dis. 2018 doi: 10.1089/fpd.2017.2403. - DOI - PubMed
    1. Wright GD. The antibiotic resistome: the nexus of chemical and genetic diversity. Nat Rev Microbiol. 2007;5:175–186. doi: 10.1038/nrmicro1614. - DOI - PubMed
    1. Brauner A, Fridman O, Gefen O, Balaban NQ. Distinguishing between resistance, tolerance and persistence to antibiotic treatment. Nat Rev Microbiol. 2016;14:320–330. doi: 10.1038/nrmicro.2016.34. - DOI - PubMed
    1. Fridman O, Goldberg A, Ronin I, Shoresh N, Balaban NQ. Optimization of lag time underlies antibiotic tolerance in evolved bacterial populations. Nature. 2014;513:418–421. doi: 10.1038/nature13469. - DOI - PubMed
    1. Claudi B, et al. Phenotypic variation of Salmonella in host tissues delays eradication by antimicrobial chemotherapy. Cell. 2014;158:722–733. doi: 10.1016/j.cell.2014.06.045. - DOI - PubMed

Publication types

MeSH terms

Substances